VHW-Grundlagenseminar, Berlin, 4. Oktober 2016
Data landscapes
Neue Wege der Analyse und
Visualisierung von Geodaten
Hallo,
ich bin
Alsino.
alsino skowronnek

Interface designer
Wirtschaftsgeograph
Interaktive Karten & Daten
@alsinosko
darkbluedata.com
The New Geo
oder:
Warum Geo heute weit mehr ist als GIS
Daten
- AUSGANGSPUNKT: UNSERE STÄDTE SIND HEUTE RIESIGE DATENMASCHINEN

- Daten erlauben es, unsichtbare Vorgänge sichtbar zu machen und räumliche Muster zu erkennen
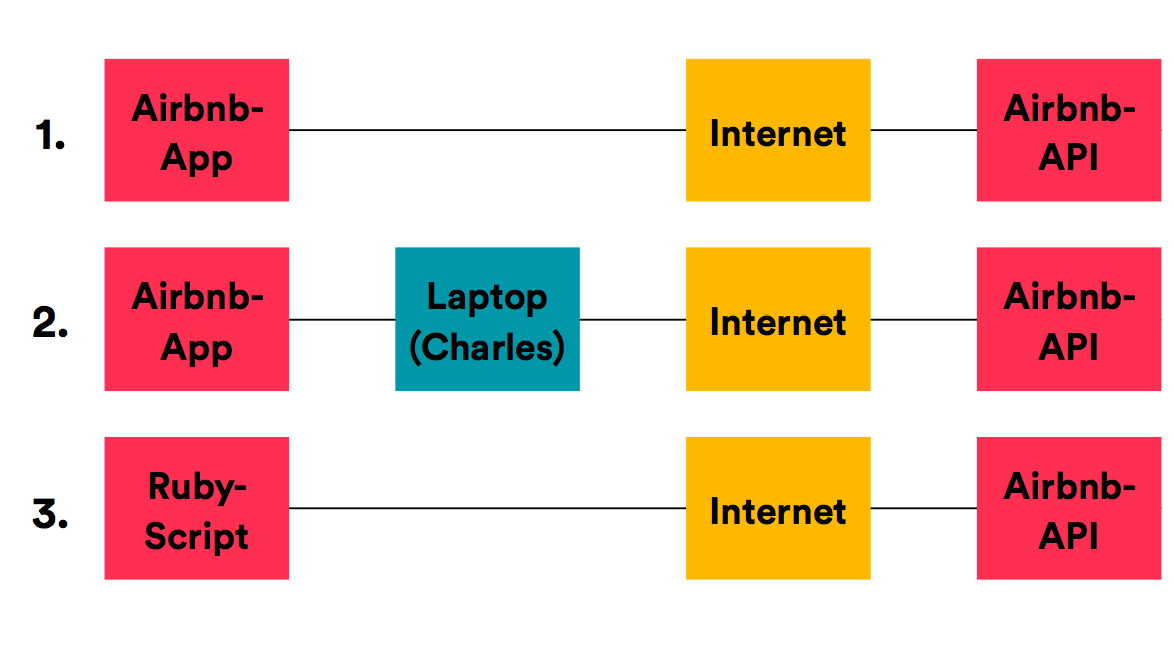
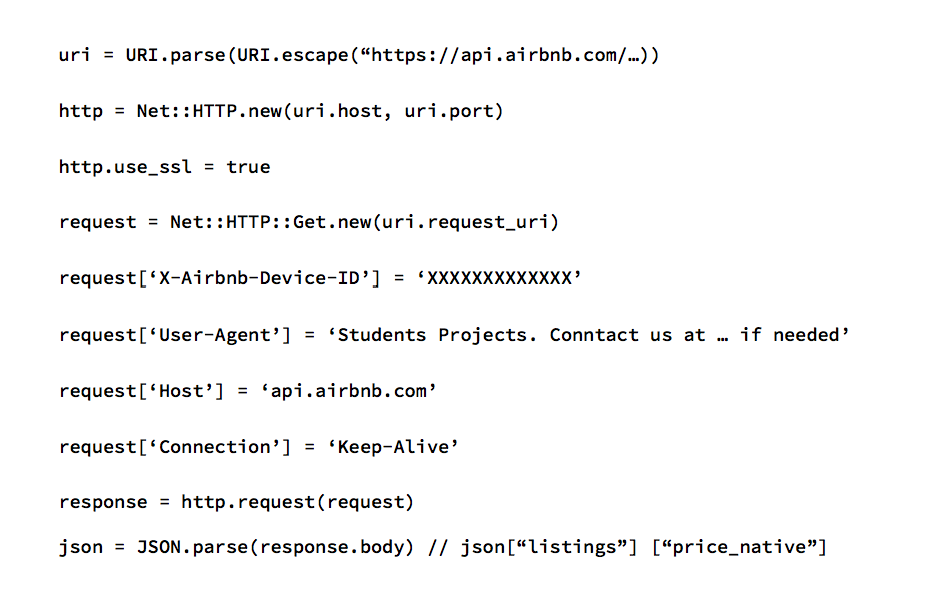
- Neue Datenquellen ermöglichen dies, oftmal sind diese Daten offen (open data) oder wir müssen sie erschließen (APIs, hidden APIs), etc.
2. Thema:
Geo und moderne Dataviz heute (3 trends: alles online, mehr offenheit (or not), Geo communities (z.B. OSM, Maptime, UCLab)
3. Beispiele ich
4. Beispiele UCLab
- Kommunikation/ Marketing
- Forschung/ Research/ Exploration
- Analyse vs. Visualisierung
- Innovative Analyse, Methoden und neue Visualisierungstechniken von Geodaten
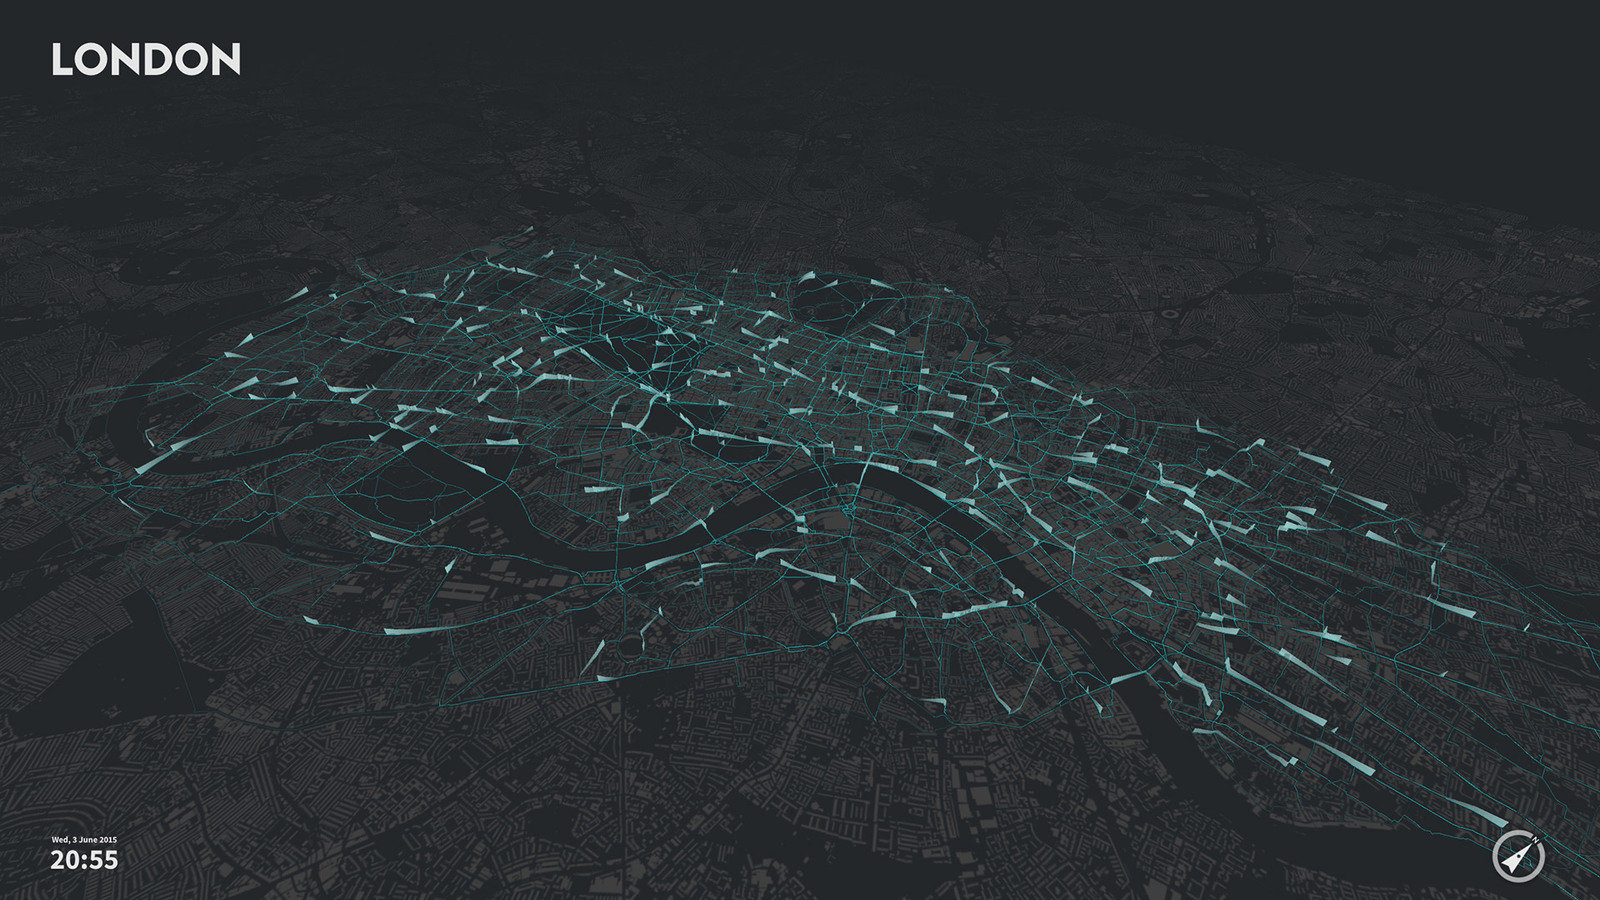
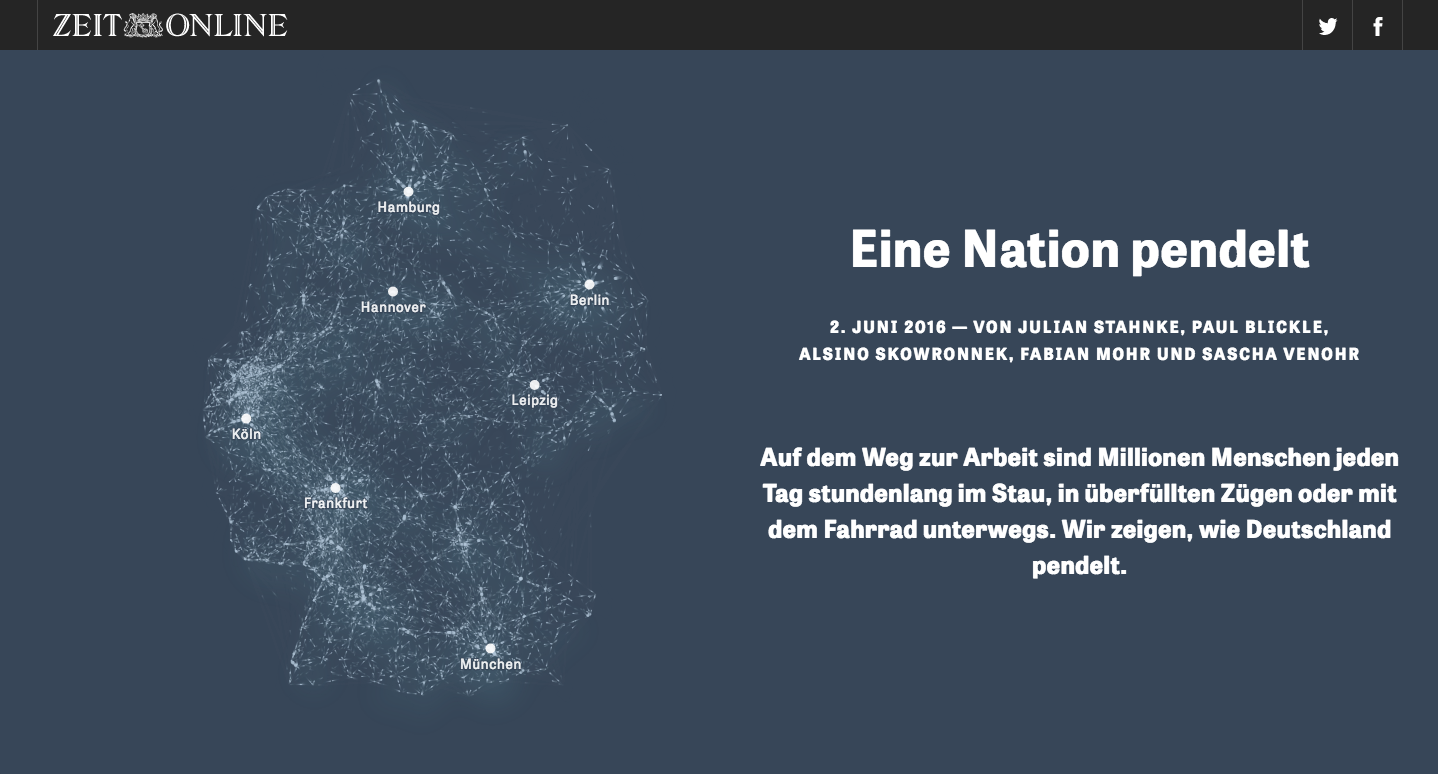
- Visualisierung urbaner Mobilität (Beispielprojekte)
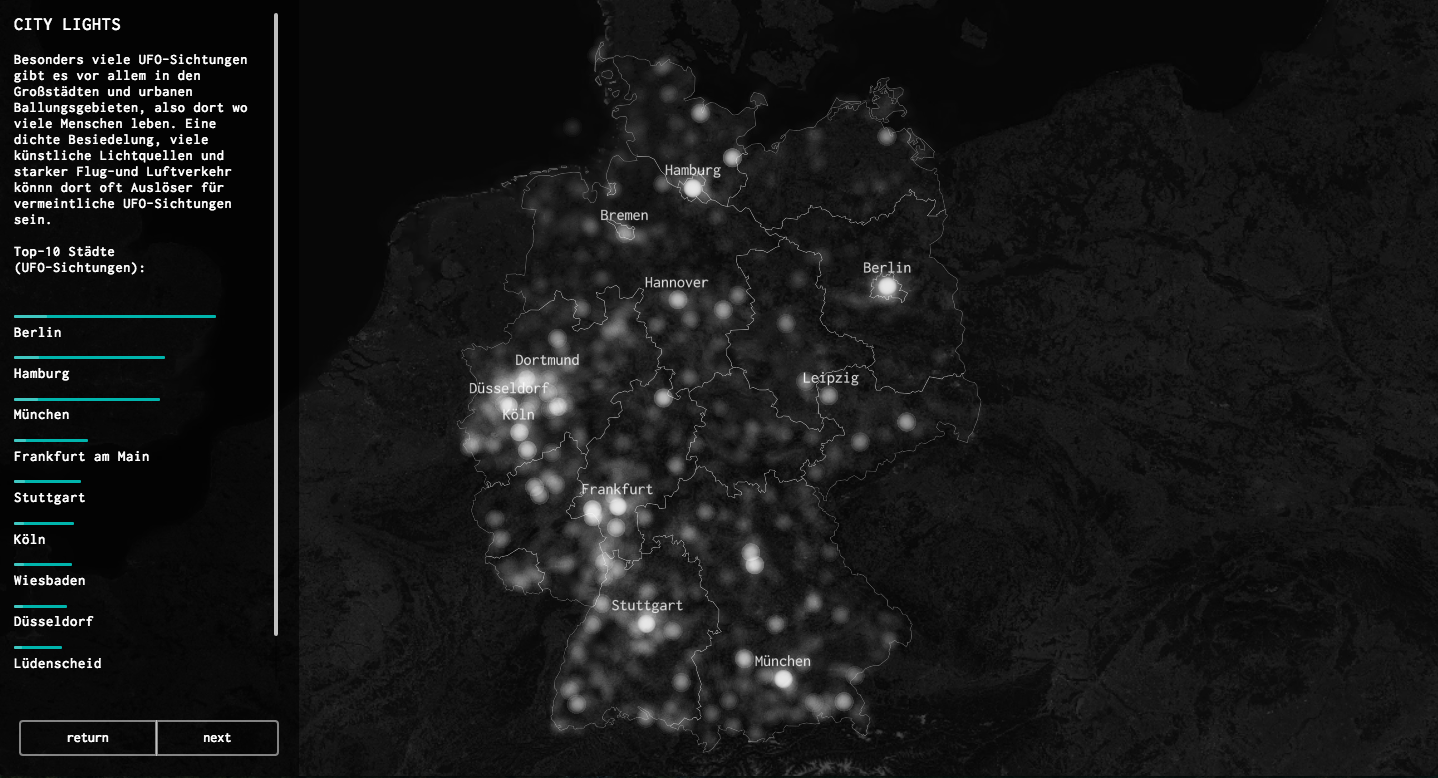
UFOs
Airbnb vs. Berlin

1.0
2.0
Background:
- Student project at the University of Applied Science, Potsdam, early 2015
- Storytelling with Data and Design
- Idea: Find a topic that is of personal interest to us: Lucas and Alsino were looking for a flat at the time in Berlin
"Why don't you just move into one of those Airbnb flats?...They are super easy to get..."
(a friend)
THE QUESTION
Is Airbnb (partly) responsible
for the shortage of affordable housing in Berlin?
THE PROBLEM
Very emotional discussion
Not based on facts
Data?
Results
(what happened earlier...)
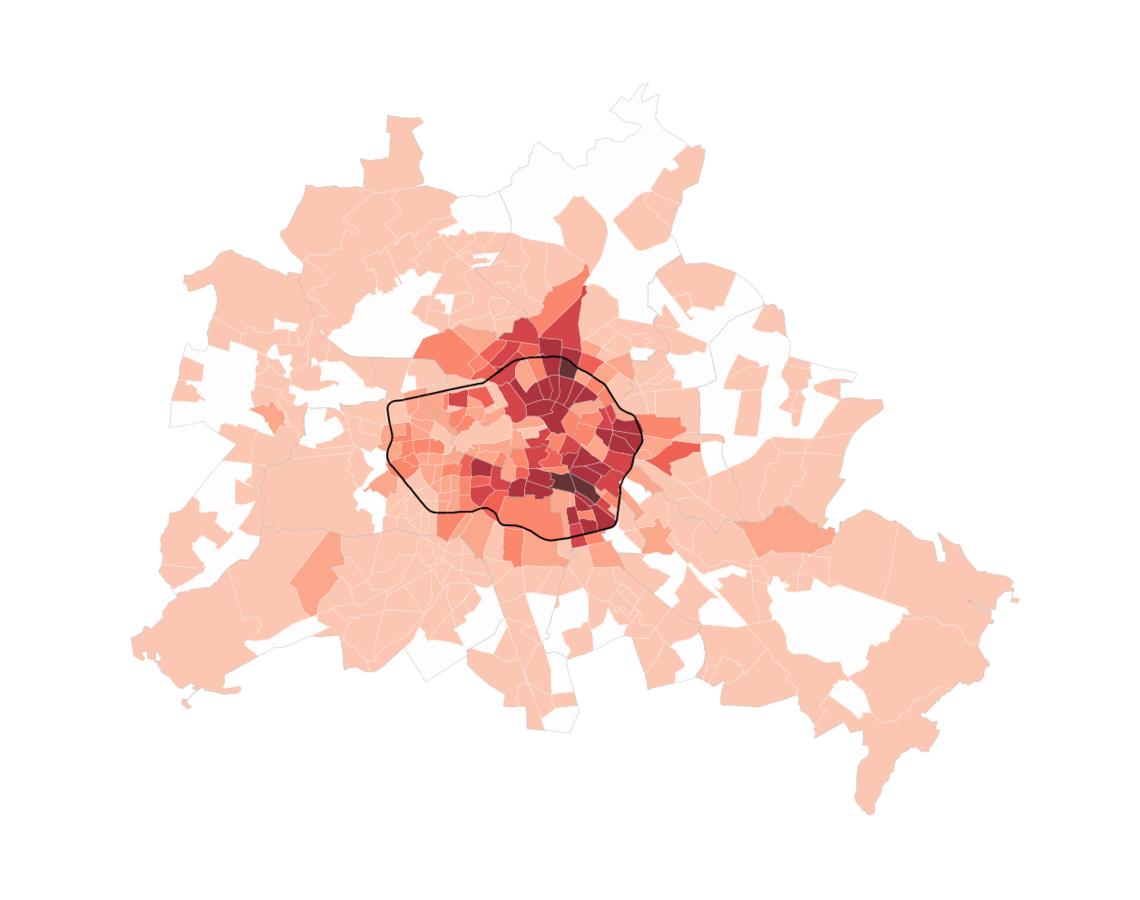
11701
AIRBNB LISTINGS
IN BERLIN
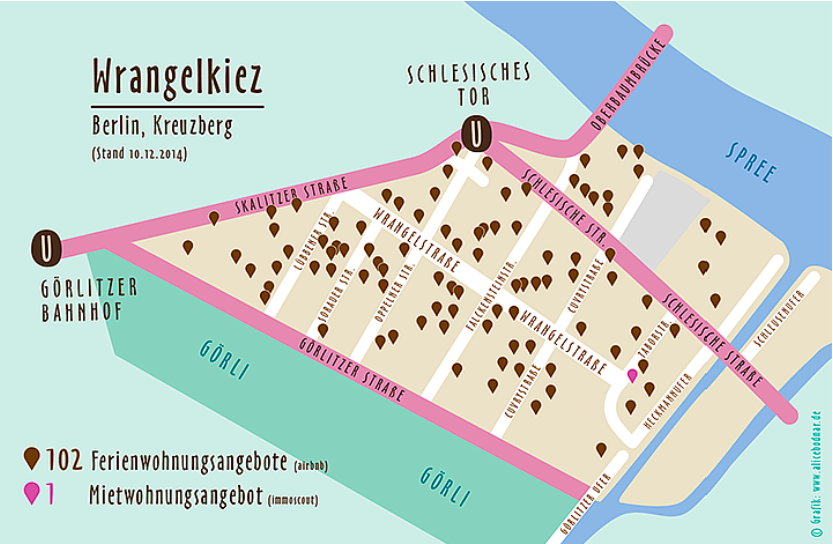
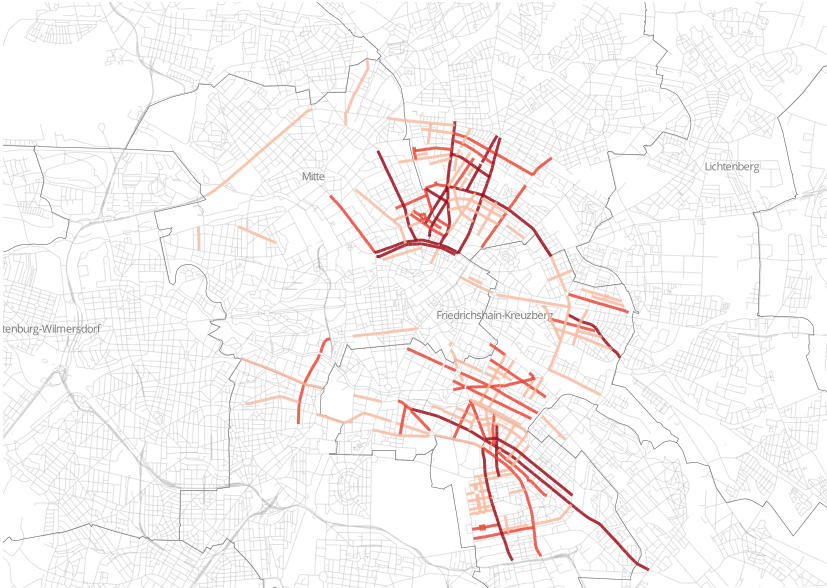
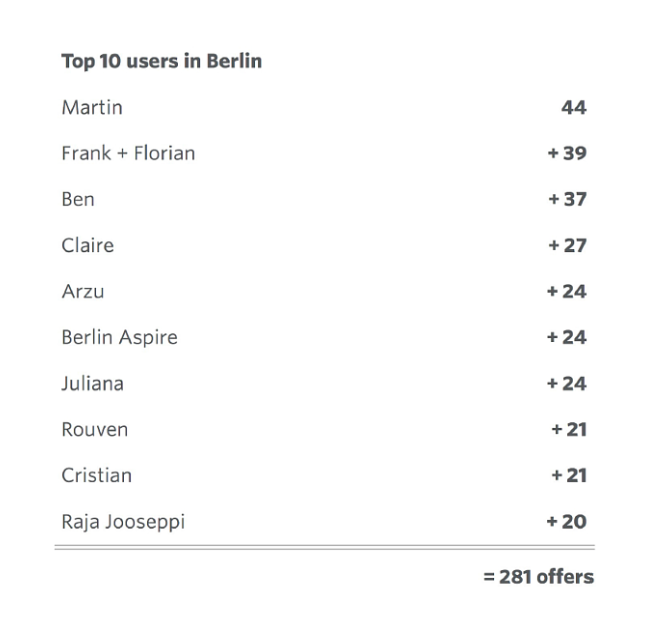
104
LISTINGS ON
JUST ONE STREET
AIRBNB HOSTS ARE
IN FOR THE €€€€
REACTIONS:


(18.3.15 17:08 – 50 Minutes after launch)
Email from Airbnb:
"Dear students, who is responsible for this data generation and where did you get the data?"
"[...] We would like to do an interview with you about your study. It is pretty much advertising for Airbnb, because we would like to show the situation as it is
(and it's true, the platfom is booming right now). [...]"
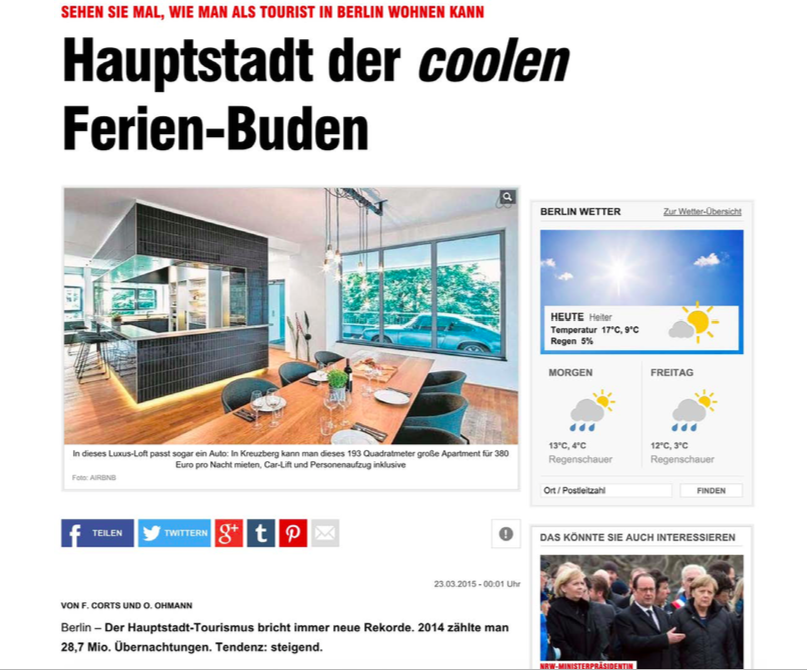
(a big German tabloid)
(20.3.15 17:08 – 2 days after launch)

Fast forward: 1 year later
Law against misappropriation of housing space:
- forbidden to temporarily sublet > 50% of flat space
- landlord agreement required
- enforced from 1 May 2016
- fines up to € 100.000 in case of violation
- "fuzzy" legal description: different city districts handle it differently
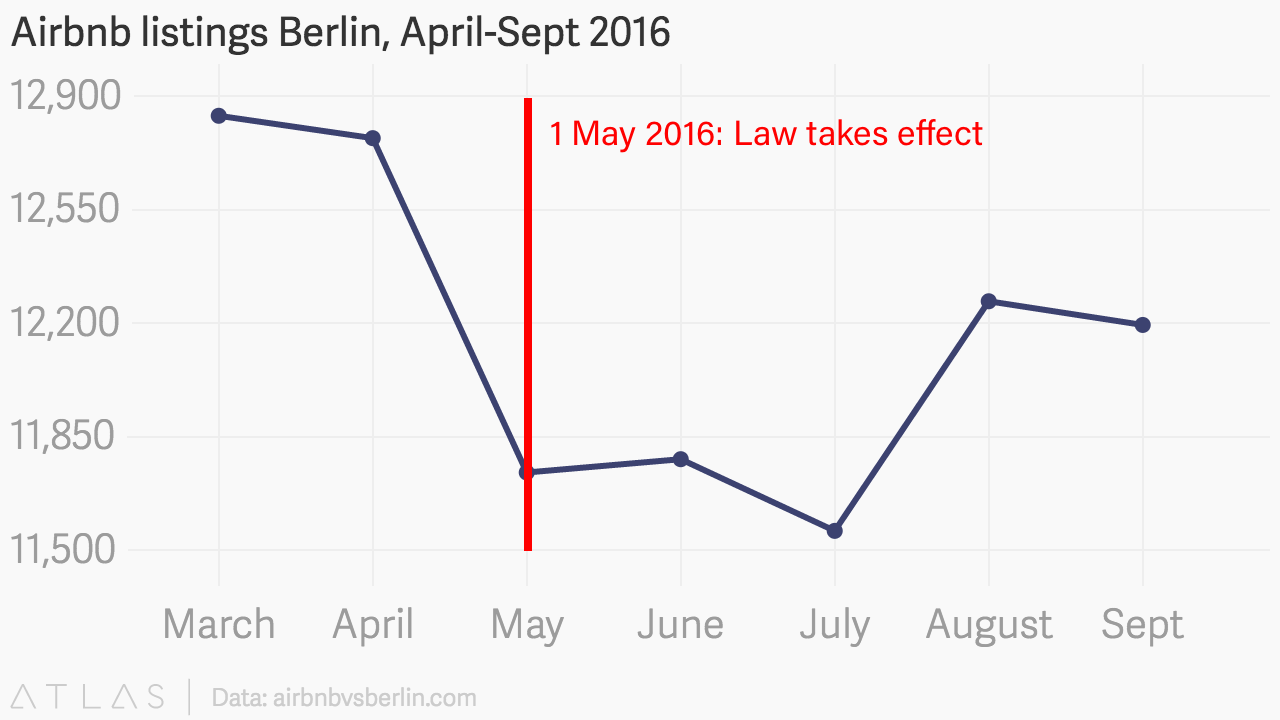
So, what are the consequences?
Only slight and temporary drop in listings
(and almost back to pre-law level)
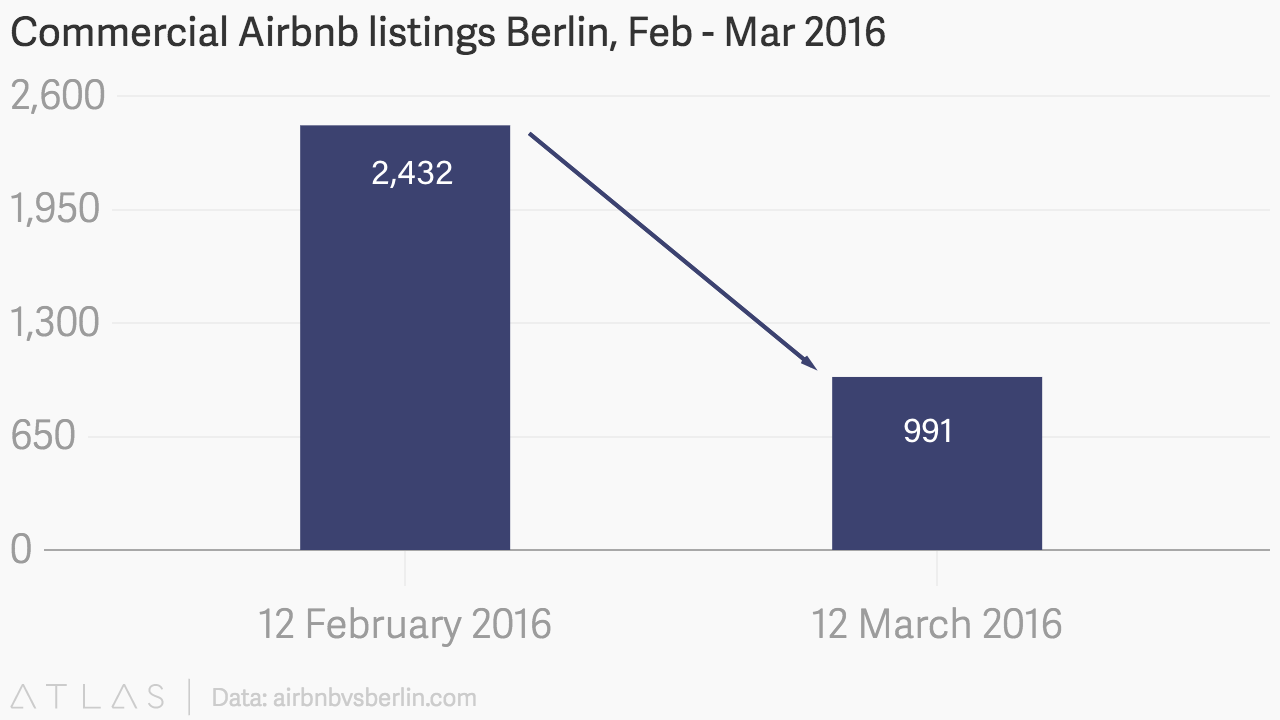
The big "cleaning"
12,352
Airbnb-listings
14%
Share commercial flats
Current situation: Berlin
24 September 2016
5,834
Users
52%
Share entire homes
13,311
Airbnb-listings
3%
Share commercial flats
Current situation: Copenhagen
24 September 2016
10,432
Users
79%
Share entire homes
Other German cities?
24. September 2016
| City | Airbnb listings | % commercial flats* |
|---|---|---|
| Munich | 8.619 | 14 |
| Hamburg | 5.092 | 12 |
| Cologne | 2.925 | 20 |
| Hannover | 1.855 | 41 |
| Düsseldorf | 1.757 | 34 |
| Frankfurt | 1.190 | 16 |
| Stuttgart | 768 | 20 |
*flats by commercial users
A few learnings from the project
Data + visualization
=
Powerful tools
1. Explore
Data can be hard to get, but essential for an informed debate
2.Debate
Regulation needs to be targeted "well" to address the real issues
3.Act
Maptime Berlin

Maptime Berlin

Maptime Berlin

Thanks!