AngularJs Performance
Dr. Gleb Bahmutov PhD
Kensho
- Personal site http://glebbahmutov.com/
- Blog http://glebbahmutov.com/blog/
- Twitter @bahmutov
Kensho app

Improving angular web app performance example
post Covers many topics
- Accurate profiling using code snippets
- v8 engine optimization warnings
- idle digest cycle optimization
- removing expensive filters
- using bind-once
- Angular vs manual HTML generation
- splitting work into batches
- offloading work to separate thread
-
optimizing memory allocation
- Memory profiling
- on-demand computation
- minimize objects attached to the scope
- updating and showing only visible elements
important parts
- Accurate profiling using code snippets
- v8 engine optimization warnings
- idle digest cycle optimization
- removing expensive filters
- using bind-once
- Angular vs manual HTML generation
- splitting work into batches
- offloading work to separate thread
-
optimizing memory allocation
- Memory profiling
- on-demand computation
- minimize objects attached to the scope
- updating and showing only visible elements
benchmarking vs profiling
Benchmarking is useless in complete application
Use live application profiling instead.
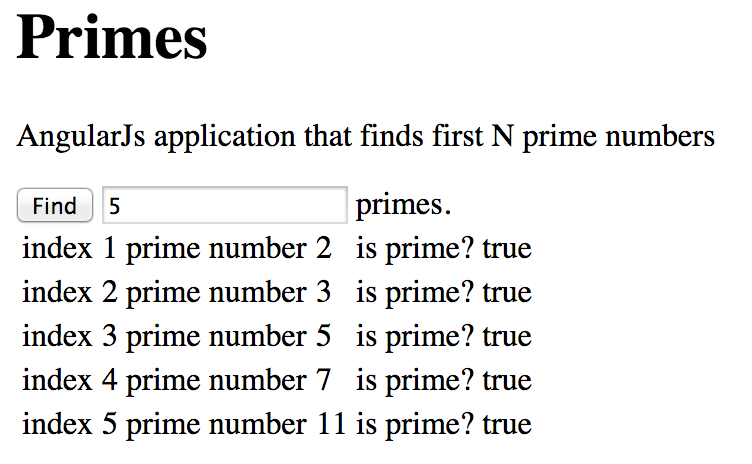
- step-0 initial application
- step-1 removed try-catch
- step-2 reusing found primes
- step-3 checking fewer numbers per prime
- step-4 profiling idle digest
- step-5 removed unnecessary filters
- step-6 one way binding using bind-once
- step-7 generating HTML in code
- step-8 2 batch generation
- step-9 small batches
- step-10 appending each table body
- step-11 web workers
- step-12 memory profiling
- step-13 on-demand computation using infinite scroll
- step-14 expensive copy in deep watch
- step-15 limit work to visible elements
Tags
- step-0 initial application
- step-1 removed try-catch
- step-2 reusing found primes
- step-3 checking fewer numbers per prime
- step-4 profiling idle digest
- step-5 removed unnecessary filters
- step-6 one way binding using bind-once
- step-7 generating HTML in code
- step-8 2 batch generation
- step-9 small batches
- step-10 appending each table body
- step-11 web workers
- step-12 memory profiling
- step-13 on-demand computation using infinite scroll
- step-14 expensive copy in deep watch
- step-15 limit work to visible elements
Tags: your code, digest cycle, DOM, on-demand computation
- step-0 initial application
- slow even for 1000 primes
- step-1 removed try-catch
- slow for 10k primes
- step-2 reusing found primes
- step-3 checking fewer numbers per prime
- fast for 100k primes
- step-4 profiling idle digest
- pauses after changing N value in the input box
- step-5 removed unnecessary filters
- faster idle digest
- step-6 one way binding using bind-once
- fast idle digest - slow 100k DOM update
-
step-7 generating HTML in code
- Faster rendering, still long pause before visible
- step-8 2 batch generation
- Long freeze after initial rendering
- step-9 small batches
- Better responsiveness
- step-10 appending each table body
- Faster DOM updates
- step-11 web workers
- No freezing
- step-12 memory profiling
- GC collection events
-
step-13 on-demand computation using infinite scroll
- Only compute data right before it is needed
- step-14 expensive copy in deep watch
- Large objects attached to the scope are expensive in the watch due to copy operation
- step-15 limit work to visible elements
- Minimize DOM to only elements that can potentially be visible
Angular performance
Lessons
- Learn how to accurately profile your code
- Optimize top bottleneck first
- Minimize number of watchers
- Simplify watch expressions - precompute data
- Work in batches - use web workers
- Work on demand - ng-infinite-scroll
- Limit DOM elements to visible data - angular-vs-repeat
does angular have A performance problem?
No
You can easily profile and optimize each part to perform well for you specific application while staying inside the AngularJS ecosystem.