Connecting Google Maps with Live Feeds
TGIS 304 : Web GIS
Winter 2015 updated for Fall 2017
So
Much
Data
Weather
Transit
Earthquakes
Tides
Ships around the globe
...
Social media...
Here are several of links to Live data and that can be overlaid on maps
Energy Maps
http://energy.gov/maps
http://www.wunderground.com/weather/api/d/712683233b8fa25a/edit.html
http://www.wunderground.com/weather/api/d/docs
712683233b8fa25a
Vessel maps
http://www.vesselfinder.com/
http://www.marinetraffic.com/
Earthquake maps
http://www.oe-files.de/gmaps/eqmashup.html
https://github.com/lothc/Data-visualization

Weather
http://googlegeodevelopers.blogspot.com/2012/04/weather-layer-now-available-in-google.html
http://www.wunderground.com/weather/api/d/pricing.html
http://openweathermap.org/help/openlayer_tile.html
http://www.wunderground.com/wundermap/?zip=73130&magic=1&wmo=99999
http://www.nws.noaa.gov/gis/otherpage.html

http://openweathermap.org/api

Bus
http://www.piercetransit.org/about-website/
https://github.com/OneBusAway/onebusaway/wiki
	https://github.com/domoritz/live-bus-seattle
https://github.com/afiler/busdrone/
http://domoritz.de/live-bus-seattle/#12/47.6210/-122.3328
We need to look at others examples...
Install to make it easier to view JSON this chrome plug-in
Now let's look at two examples using this tool
and this one
what are the differences between these two json files?
More examples
- Esri Drought tracker http://livingatlas.arcgis.com/drought/
Places to find live data feeds
- Traffic https://www.waze.com/livemap
- Crime http://web6.seattle.gov/mnm/incidentresponse.aspx
- Real time births and deaths http://www.theatlantic.com/health/archive/2013/10/a-real-time-map-of-births-and-deaths/280609/
- Transit http://tripplanner.kingcounty.gov/hiwire?.a=iRealTimeDisplay
- Health Concerns http://www.healthmap.org/en/
- Earthquake http://quakes.globalincidentmap.com/
- Lightening map! http://www.lightningmaps.org/realtime
- ESRI fire map http://www.esri.com/services/disaster-response/wildlandfire/latest-news-map
Live update Earthquake map!
http://faculty.washington.edu/bricker0/503_4.html
MapBox
Esri
WHY google maps API?
They have excellent tutorials and documentation
https://developers.google.com/maps/documentation/javascript/earthquakes

Graduated Circles

https://developers.google.com/maps/tutorials/visualizing/earthquakes#circle_size
WHY google maps API examples all look so different???
Start with babysteps
As we learned from previous lab assignments, easy to run into trouble.
Let's start with baby steps and have a back up plan - that will evolve as we go along.
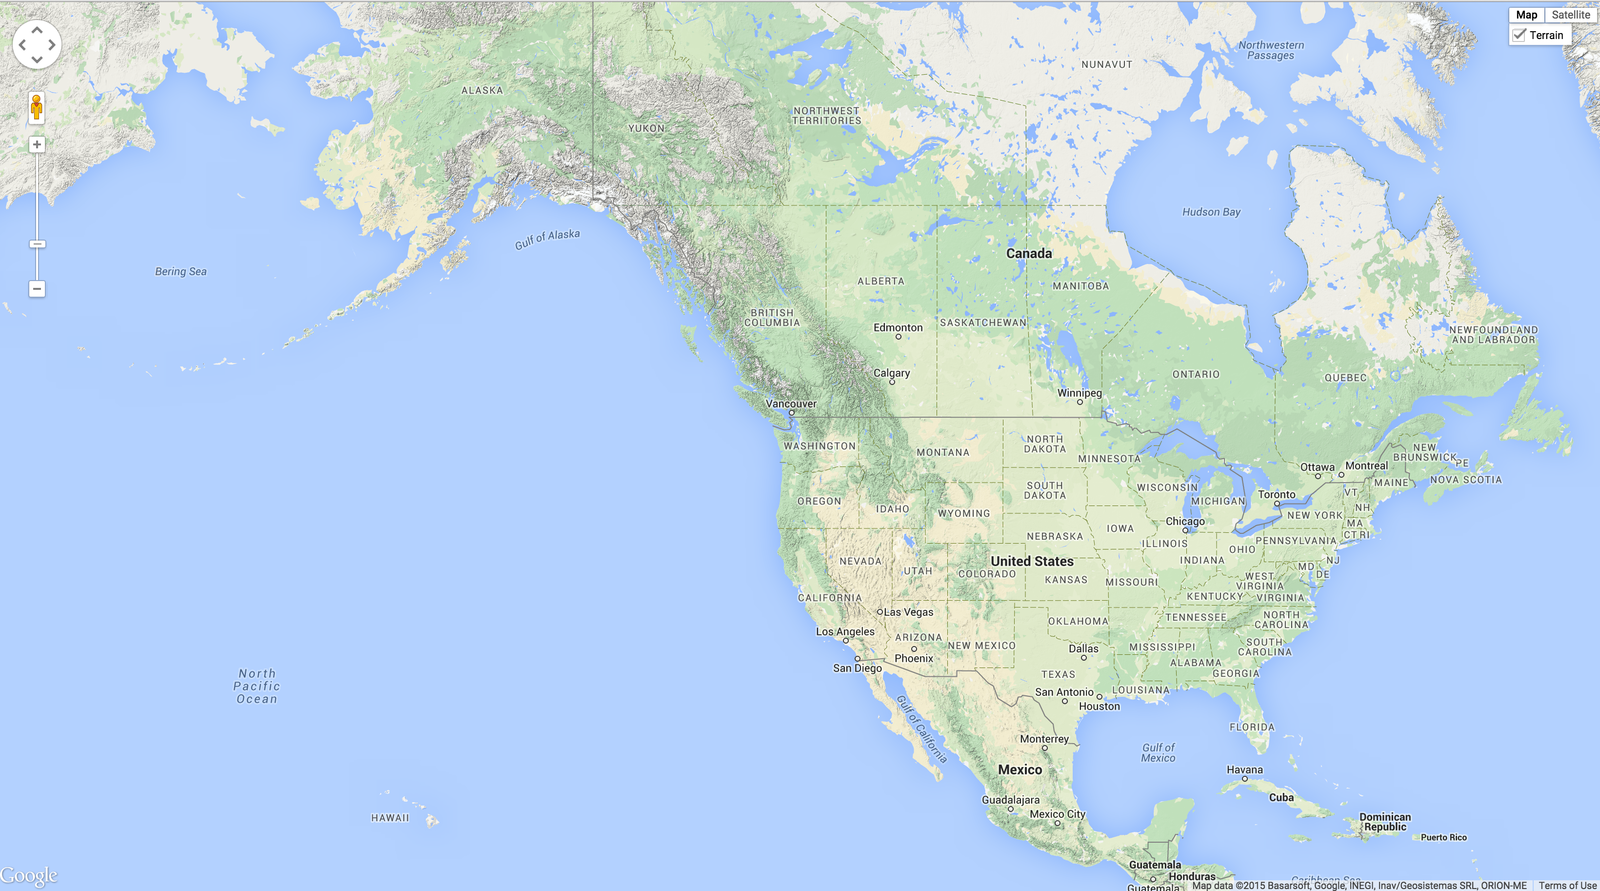
Start with a map of our region!
<!DOCTYPE html>
<html>
  <head>
    <title>Just a Map</title>
    <meta name="viewport" content="initial-scale=1.0">
    <meta charset="utf-8">
    <style>
      /* Always set the map height explicitly to define the size of the div
       * element that contains the map. */
      #map {
        height: 100%;
      }
      /* Optional: Makes the sample page fill the window. */
      html, body {
        height: 100%;
        margin: 0;
        padding: 0;
      }
    </style>
  </head>
  <body>
    <div id="map"></div>
    <script>
      var map;
      function initMap() {
        map = new google.maps.Map(document.getElementById('map'), {
          center: {lat: 47.225, lng: -122.46},
          zoom: 8,
           mapTypeId: 'terrain',
           tilt: 33,
           position: 'top_right'

        });
      }
    </script>

    <script src="https://maps.googleapis.com/maps/api/js?key=YOUR_KEY_HERE"
    async defer></script>
  </body>
</html>
google maps API - this should be review
<!DOCTYPE html>
<html>
  <head>
    <title>Hello World!</title>
    <meta name="viewport" content="initial-scale=1.0, user-scalable=no">
    <meta charset="utf-8">
    <style>
      html, body, #map-canvas {
        height: 100%;
        margin: 0px;
        padding: 0px
      }
    </style>
    <script src="https://maps.googleapis.com/maps/api/js?v=3.exp&signed_in=true"></script>
    <script>
var map;
function initialize() {
  var mapOptions = {
    zoom: 10,
    center: new google.maps.LatLng(47.2414, -122.4594)

  };
  map = new google.maps.Map(document.getElementById('map-canvas'),
      mapOptions);


}

google.maps.event.addDomListener(window, 'load', initialize);

    </script>
  </head>
  <body>

    <div id="map-canvas"></div>
  </body>
</html>
Let's look again at each part
HTML DOM
Document Object Model
Define map <div> in body of html

Then style map <div> in CSS
Then call the javascript from Google
<script src="https://maps.googleapis.com/maps/api/js?v=3.exp&signed_in=true"></script>I recommend this way using an
API Key
<script src="https://maps.googleapis.com/maps/api/js?key=YOUR_KEY_HERE"></script>Google signed in maps - preservers users preferences if they are logged into Google Account
https://maps.googleapis.com/maps/api/jsOr Try
Set the map variable
var map;
function initialize() {
  var mapOptions = {
    zoom: 10,
    center: new google.maps.LatLng(47.2414, -122.4594)

  };
  map = new google.maps.Map(document.getElementById('map-canvas'),
      mapOptions);


}
Here we tell the browser to do the following when the map is initialized
- set the zoom level to 10
- and center the map on Tacoma, WA
- and then load the map
Change the map type
var map;
function initialize() {
  var mapOptions = {
    zoom: 10,
    center: new google.maps.LatLng(47.2414, -122.4594),
    mapTypeId: google.maps.MapTypeId.TERRAIN

  };
  map = new google.maps.Map(document.getElementById('map-canvas'),
      mapOptions);


}
My favorite Google Map base map is Terrain so I set it as the default using the following steps
- add a coma after the lat long coordinates
- add one more line under center
Note: if you are using the signed in version of Google Maps - this will not work
load, map!!!
}

google.maps.event.addDomListener(window, 'load', initialize);

    </script>
  </head>
  <body>
    <div id="map-canvas"></div>

  </body>
</html>
Now make sure the map is going to load. Make sure that the map is placed on the page and that it will render on load event
Check to see that the DOM elements are in the body of the html
<div>
Your code and map should look like this
<!DOCTYPE html>
<html>
  <head>
    <title>EarthQuake Map</title>
    <meta name="viewport" content="initial-scale=1.0, user-scalable=no">
    <meta charset="utf-8">
    <style>
      html, body, #map-canvas {
        height: 100%;
        margin: 0px;
        padding: 0px
      }


    </style>

    <script src="https://maps.googleapis.com/maps/api/js?key=YOURKEYHERE"></script>
    <script>
var map;
function initialize() {
  map = new google.maps.Map(document.getElementById('map-canvas'), {
    zoom: 4,
    center: {lat: 47.2414, lng: -122.4594},
    mapTypeId: google.maps.MapTypeId.TERRAIN
  });

}

google.maps.event.addDomListener(window, 'load', initialize);

    </script>
  </head>
  <body>
    <div id="map-canvas"></div>

  </body>
</html>
Click to
Now lets overlay a live Earthquake feed
from USGS
So many ways to do this
- GeoRSS
- WMS -raster
- JSON
So many ways to do this
- GeoRSS - Lets Try this one
- WMS
- JSON - And this one
GeoRSS
GeoRSS makes it possible for applications to request, aggregate and share geotagged feeds. Generally XML
two encodings:
- Simple- supports geometry
- GML- supports greater range of features, notably WGS-87 coordinate system
USGS Feeds
//You can pick from a wide variety of GeoRSS feeds offered by NOAA here http://earthquake.usgs.gov/earthquakes/feed/v1.0/kml.php
//To get a live feed to overlay on your map add the following
var georssLayer = new google.maps.KmlLayer({
url: 'http://earthquake.usgs.gov/earthquakes/feed/v1.0/summary/2.5_month_depth_link.kml'
});
georssLayer.setMap(map);
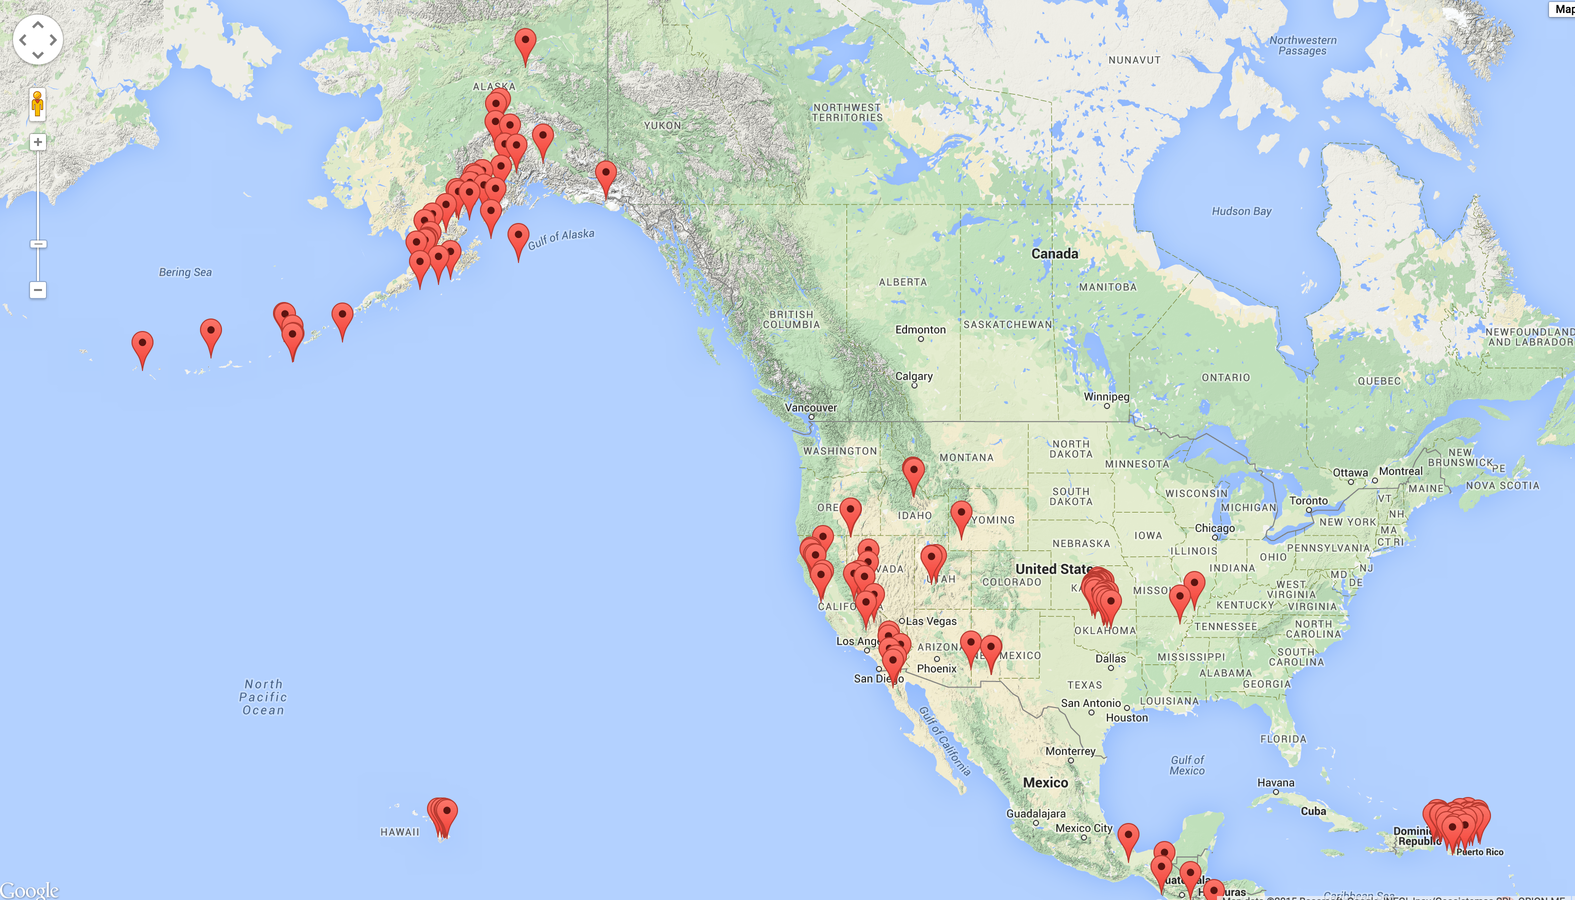
}Full code here, you should use a different feed, replace my kml
<!DOCTYPE html>
<html>
  <head>
    <title>EarthQuake Map</title>
    <meta name="viewport" content="initial-scale=1.0, user-scalable=no">
    <meta charset="utf-8">
    <style>
      html, body, #map-canvas {
        height: 100%;
        margin: 0px;
        padding: 0px
      }


    </style>

    <script src="https://maps.googleapis.com/maps/api/js?key=AIzaSyAMEcmfTe3x_Iq9o0dQY7edGBo_wfgwyjA"></script>
    <script>
var map;
function initialize() {
  map = new google.maps.Map(document.getElementById('map-canvas'), {
    zoom: 4,
    center: {lat: 47.2414, lng: -122.4594},
    mapTypeId: google.maps.MapTypeId.TERRAIN
  });


//You can pick from a wide variety of GeoRSS feeds offered by NOAA here http://earthquake.usgs.gov/earthquakes/feed/v1.0/kml.php
    var georssLayer = new google.maps.KmlLayer({
    url: 'http://earthquake.usgs.gov/earthquakes/feed/v1.0/summary/2.5_month_depth_link.kml'
  });
  georssLayer.setMap(map);

}


google.maps.event.addDomListener(window, 'load', initialize);

    </script>
  </head>
  <body>
    <div id="map-canvas"></div>

  </body>
</html>
Does your new map look something like this?
Replace the GeoRSS var with the following -->
// Load GeoJSON.
  map.data.loadGeoJson('http://earthquake.usgs.gov/earthquakes/feed/v1.0/summary/2.5_week.geojson');


}
Let's try JSON next
So that was quick and easy but
- not in much control of style
- or content
- and color is not rendering
JSON
- JavaScript Object Notation
- means of storing data (human readable)
- http://www.copterlabs.com/blog/json-what-it-is-how-it-works-how-to-use-it/
JSONP
JSON with padding - wraps up JSON response into a JavaScript function and sends that script to the browsers - making it possible to render in all browsers
http://json-jsonp-tutorial.craic.com/index.html
jQuery
makes Ajax/HTTPD calls from a script to a server - fetching server response in JSON
AJAX
ability for a webpage to request new dat after it has loaded in the web browser, response to user action on the webpage displayed
We learned before that
Size matters
How much JSON is too much JSON?
Callback
an asynchronous equivalence of a function that gets called a the end of a task
browser process can run without waiting for the data to load with the live streaming GeoJSON data to finish updating.
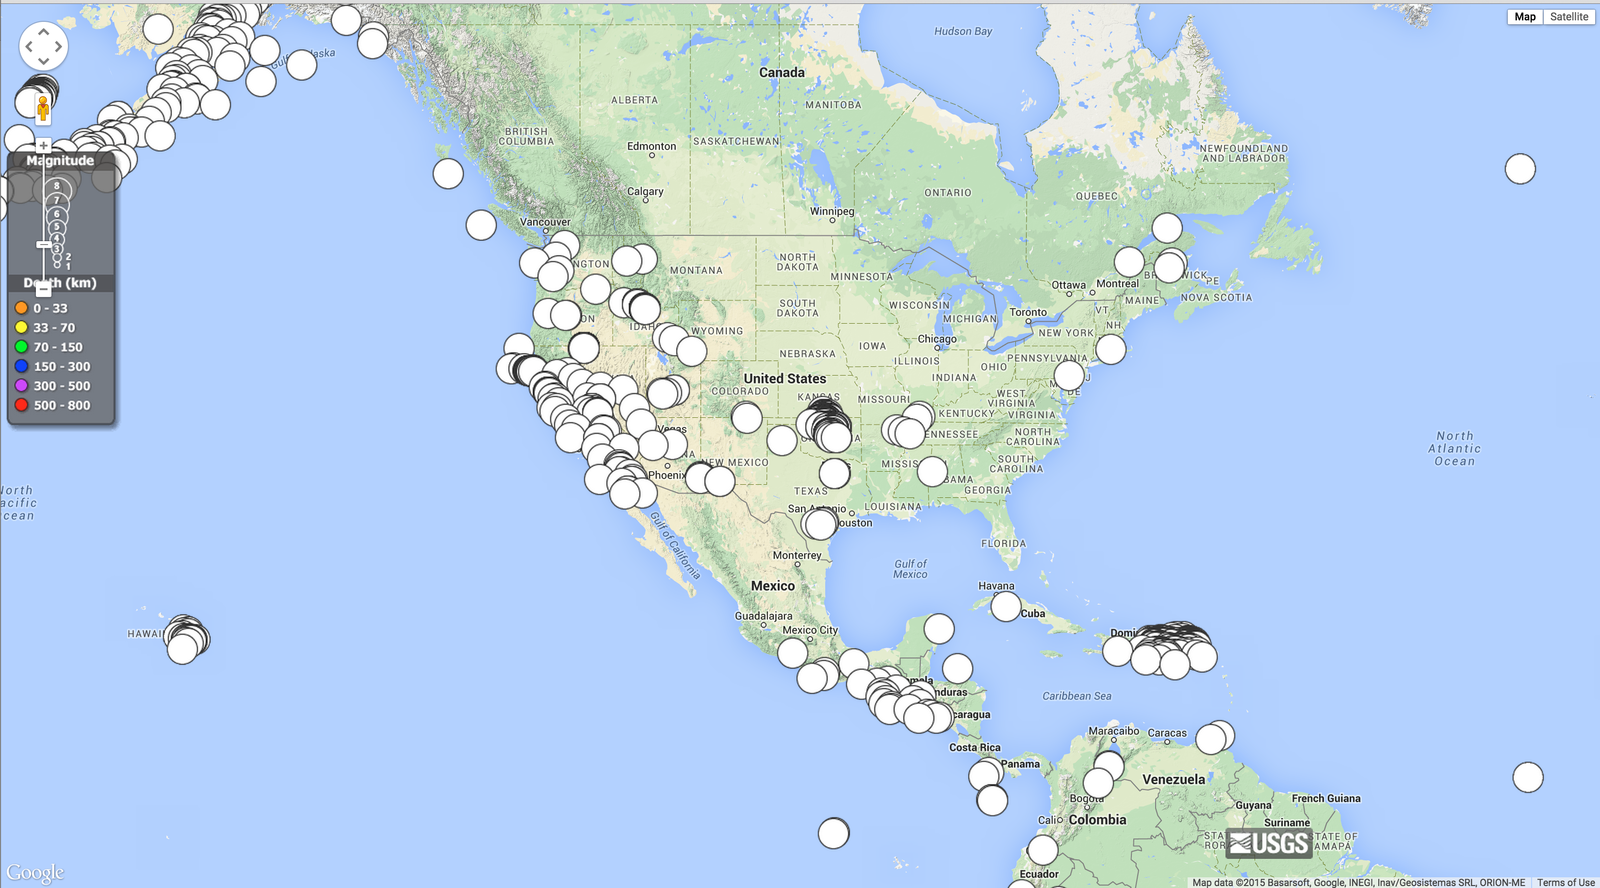
Great!
We got a map to render with points of Earthquakes!
but this is kind of lame, the end user has no idea what they are looking at! Time to doctor it up!
Add this code for text box to update with feature information, look at the JSON to see what attributes are available for display
  // Set mouseover event for each feature.
  map.data.addListener('mouseover', function(event) {
    document.getElementById('info-box').textContent =
        event.feature.getProperty("title");
 });
Now yours should look something like this
<!DOCTYPE html>
<html>
  <head>
    <title>EarthQuake Map</title>
    <meta name="viewport" content="initial-scale=1.0, user-scalable=no">
    <meta charset="utf-8">
    <style>
      html, body, #map-canvas {
        height: 100%;
        margin: 0px;
        padding: 0px
      }
 #info-box {
      background-color: red;
      border: 1px solid red;
      bottom: 30px;
      height: 20px;
      padding: 10px;
      position: absolute;
      right: 30px;
    }

    </style>

    <script src="https://maps.googleapis.com/maps/api/js?key=YOURKEY"></script>
    <script>
var map;
function initialize() {
  map = new google.maps.Map(document.getElementById('map-canvas'), {
    zoom: 4,
    center: {lat: 47.2414, lng: -122.4594},
    mapTypeId: google.maps.MapTypeId.TERRAIN
  });


 // Load GeoJSON from USGS.
  map.data.loadGeoJson('http://earthquake.usgs.gov/earthquakes/feed/v1.0/summary/2.5_week.geojson');

// Set mouseover event for each feature.
  map.data.addListener('mouseover', function(event) {
    document.getElementById('info-box').textContent =
        event.feature.getProperty("mag")+" magnitude on Richter scale"+" location: "+ event.feature.getProperty("place")

  });
}

google.maps.event.addDomListener(window, 'load', initialize);

    </script>
  </head>
  <body>
    <div id="map-canvas"></div>
     <div id="info-box">?</div>

  </body>
</html>
On your own change the following
- Content in the info window!
- CSS - change colors
- Add a title + link to USGS and a little about the data being presented on the map
- You are welcome to change the json being referenced too - but be sure to tell the map user what they are looking at.
- Feel free to use examples you find on the web
- Good luck!
Steps to add the info box
- add CSS
- set mouse over or click event
- decide what property you want to show in your info box
- Open JSON in new window to find property name
- You may pick more than one
- I recommend downloading this JSON Formatter chrome plugin
- add <div> to the body of your page
 #info-box {
      background-color: white;
      border: 1px solid black;
      bottom: 30px;
      height: 40px;
      padding: 10px;
      position: absolute;
      left: 30px;
    }
add a legend based on your code for example - css and div to the body
<div id="legendGradient" style="background: -webkit-linear-gradient(left, rgba(255, 255, 255, 1), rgba(94, 188, 0, 1), rgba(191, 202, 0, 1), rgb(198, 187, 0), rgb(209, 134, 7), rgb(292, 97, 21), rgb(300, 70, 57, 1));"></div><div id="legendText1">0<span style="white-space:pre">                                                                                   4+</span></div><div id="legendText2" align="center">Magnitude

    </div>
</div>
#legend {
position: relative;
margin-left: 10px;
width: 400px;
height: 35px;
margin-top: 10px;
margin-left: 10px;
}
#legendGradient {
width: 100%;
height: 15px;
border: 1px solid black;
}Bare minimum cartographic elements we need to add
- title - use headings <h1>
- link to where data came from - add links using <p> & <a href>
- info box to add information about each point
Steps to add the info box
- add CSS
- set mouse over or click event
- decide what property you want to show in your info box
- Open JSON in new window to find property name
- You may pick more than one
- add <div> to the body of your page
Google Maps Example
check out the JSFiddle for this example
<!DOCTYPE html>
<html>
  <head>
    <title>What kind of map is this?</title>
    <meta name="viewport" content="initial-scale=1.0, user-scalable=no">
    <meta charset="utf-8">
    <style>
      html, body, #map-canvas {
        height: 100%;
        margin: 0px;
        padding: 3px
      }
 #info-box {
      background-color: white;
      border: 1px solid red;
      bottom: 30px;
      height: 20px;
      padding: 10px;
      position: absolute;
      left: 30px;
    }

    </style>

    <script src="https://maps.googleapis.com/maps/api/js?key=YOURKEYHERE"></script>
    <script>

var map;
function initialize() {
  map = new google.maps.Map(document.getElementById('map-canvas'), {
    zoom: 4,
    center: {lat: 47.2414, lng: -122.4594},
    mapTypeId: google.maps.MapTypeId.TERRAIN
  });


 // Load GeoJSON.
  map.data.loadGeoJson('http://earthquake.usgs.gov/earthquakes/feed/v1.0/summary/2.5_week.geojson');

  // Set mouseover event for each feature.
  map.data.addListener('mouseover', function(event) {
    document.getElementById('info-box').textContent =
        event.feature.getProperty("mag")+" magnitude on Richter scale"+" location: "+ event.feature.getProperty("place")

  });

  //What is happening here?

map.data.setStyle(function(feature) {
    var magnitude = feature.getProperty('mag');
    return {
      icon: getCircle(magnitude)
    };
  });
}
 //What is happening here? Change this to a different scale and color

function getCircle(magnitude) {
  var circle = {
    path: google.maps.SymbolPath.CIRCLE,
    fillColor: 'red',
    fillOpacity: .2,
    scale: Math.pow(2, magnitude) / 2,
    strokeColor: 'white',
    strokeWeight: .5
  };
  return circle;
}

function eqfeed_callback(results) {
  map.data.addGeoJson(results);
}


google.maps.event.addDomListener(window, 'load', initialize);

    </script>
  </head>
  <body>
    <div id="map-canvas"></div>
     <div id="info-box">?</div>

  </body>
</html>
Here is some helpful code but don't forget to change yours!