Kaggle Paris Meetup
Meetup #18 Agenda
- welcome by Mobiskill
- Meetup status , stats/figure , trends
- TrackML particule tracking , David Rousseau in2p3 ( Saclay)
- Kaggle learn, Bruno Seznec
- Airbus challenge, finished competiton
Meetup status , stats/figure , trends
Around 1k members , 3/4 meetup by year
Call for new organizers:
contact speakers, find hosting / sponsors
2018 summary and trends
- Theory : main conf : ICML Stockholm, ICLR Vancouver, NIPS Montreal , sold out in 12'
- All papers, posters, video (not always) available on the web
-
Auto ML / Studios
- Cloud : from mamouth AWS , GCP ML platforms (codelabs) to startup : paperspace.io , prevision.io, ...
Agenda
- Meetup status , stats/figure , trends
- TrackML particule tracking , David Rousseau in2p3 ( Saclay)
- Kaggle learn, Bruno Seznec
- Airbus challenge, finished competition
Tracking particule
Link to David's slides , CERN et al. sponsorship
Two parts challenge :
1°) Precision ( Ended competition)
https://www.kaggle.com/c/trackml-particle-identification
https://sites.google.com/site/trackmlparticle/results
2°) Performance open until march 2019
https://competitions.codalab.org/competitions/20112
Dedicated site : https://sites.google.com/site/trackmlparticle/
Unsupervised ML challenge, EDA
Size Train 46 Go for train_1 Test
Metric :
Agenda
- Meetup status , stats/figure , trends
- TrackML particule tracking , David Rousseau in2p3 ( Saclay)
- Kaggle learn, Bruno Seznec
- Airbus challenge, finished competition
Kaggle Learn
Home course machine learning explainability
3 parts / Notebooks
- permutation importance
https://www.kaggle.com/dansbecker/permutation-importance
- partial plot
https://www.kaggle.com/dansbecker/partial-plots
- shap value / plot
https://www.kaggle.com/dansbecker/shap-values
Kaggle Learn
Home course machine learning explainability
3 parts / Notebooks
Motivations , Use Cases
https://www.kaggle.com/dansbecker/use-cases-for-model-insights
For history see
https://medium.com/@Zelros/a-brief-history-of-machine-learning-models-explainability-f1c3301be9dc
Kaggle Learn
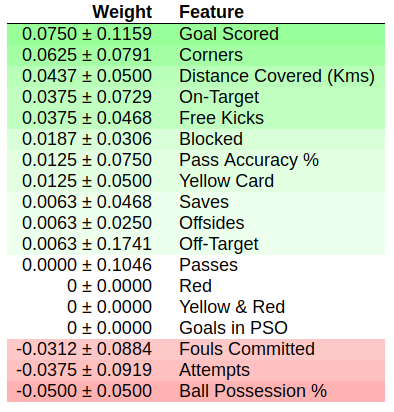
- permutation importance
https://www.kaggle.com/dansbecker/permutation-importance
Take away
sort of feature importance : after shuffling a column (permutation) ,
you see the consequence on the accuracy of your model > performance decrease
eli5 python lib , scikit-learn 0.20+
very similar to drift computation
in MLbox for example
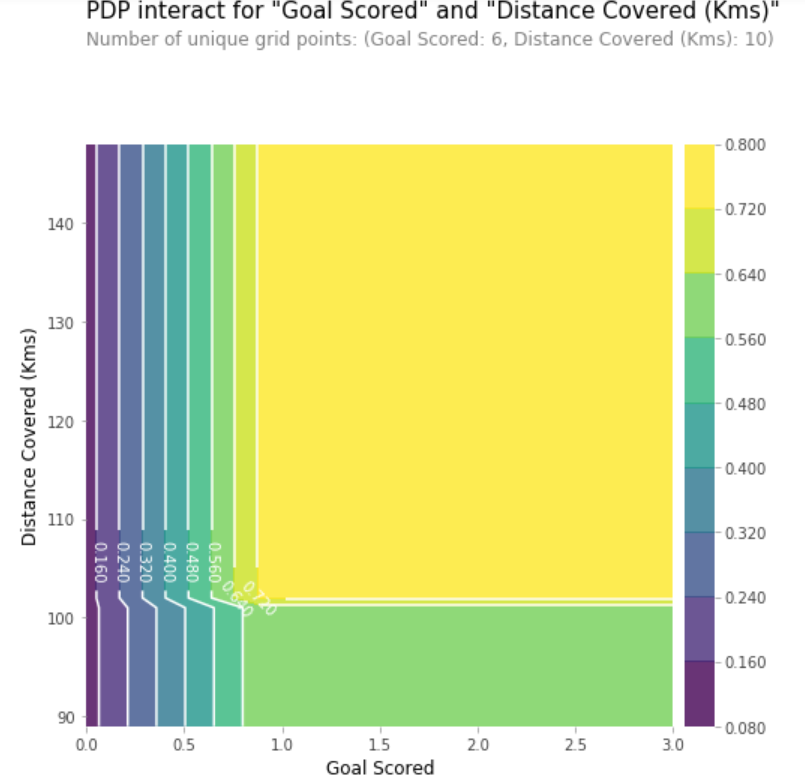
Kaggle Learn
- partial dependence plot
https://www.kaggle.com/dansbecker/partial-plots
Take away
partial dependence plots show how
a feature affects predictions
act like coefficients in the linear or
logistic regression
pdpbox python lib
You can also compute the dependance
of 2 features
Kaggle Learn
- shap value / plot
https://www.kaggle.com/dansbecker/shap-values
Take away
SHAP Values (an acronym from SHapley Additive exPlanations) break down a prediction to show the impact of each feature.
How the feature affect the prediction on "Man of the match"
in red/pink features that increase the pred. in blue feat. that decrease the pred.
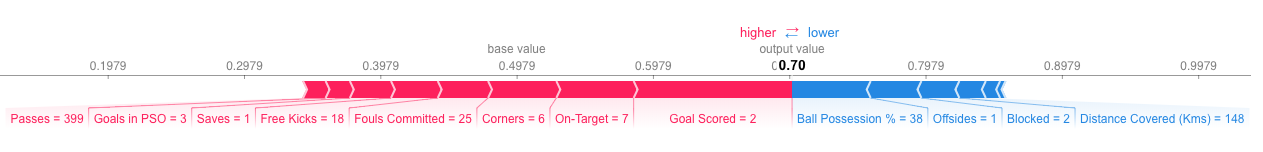
shap python lib
Agenda
- Meetup status , stats/figure , trends
- TrackML particule tracking , David Rousseau in2p3 ( Saclay)
- Kaggle learn, Bruno Seznec
- Airbus challenge, finished competition
Airbus ship detection
- Image object detection, build a model that detects all ships in satellite images as quickly as possible
- Size : train imgs , test imgs - 25 Go download
- Metric : F2 score , + mean . Intersection over Union
- EDA , bis
- 5 submissions per day !
- Some kernels
- https://www.kaggle.com/iafoss/unet34-submission-tta-0-699-new-public-lb
- https://www.kaggle.com/hmendonca/airbus-mask-rcnn-and-coco-transfer-learning
- finished last week
- prices : 60 k$ in total
- RETEX from Airbus postponed to another Meetup