Carparks-SG
(or how to build an simple web application using LTA's API)
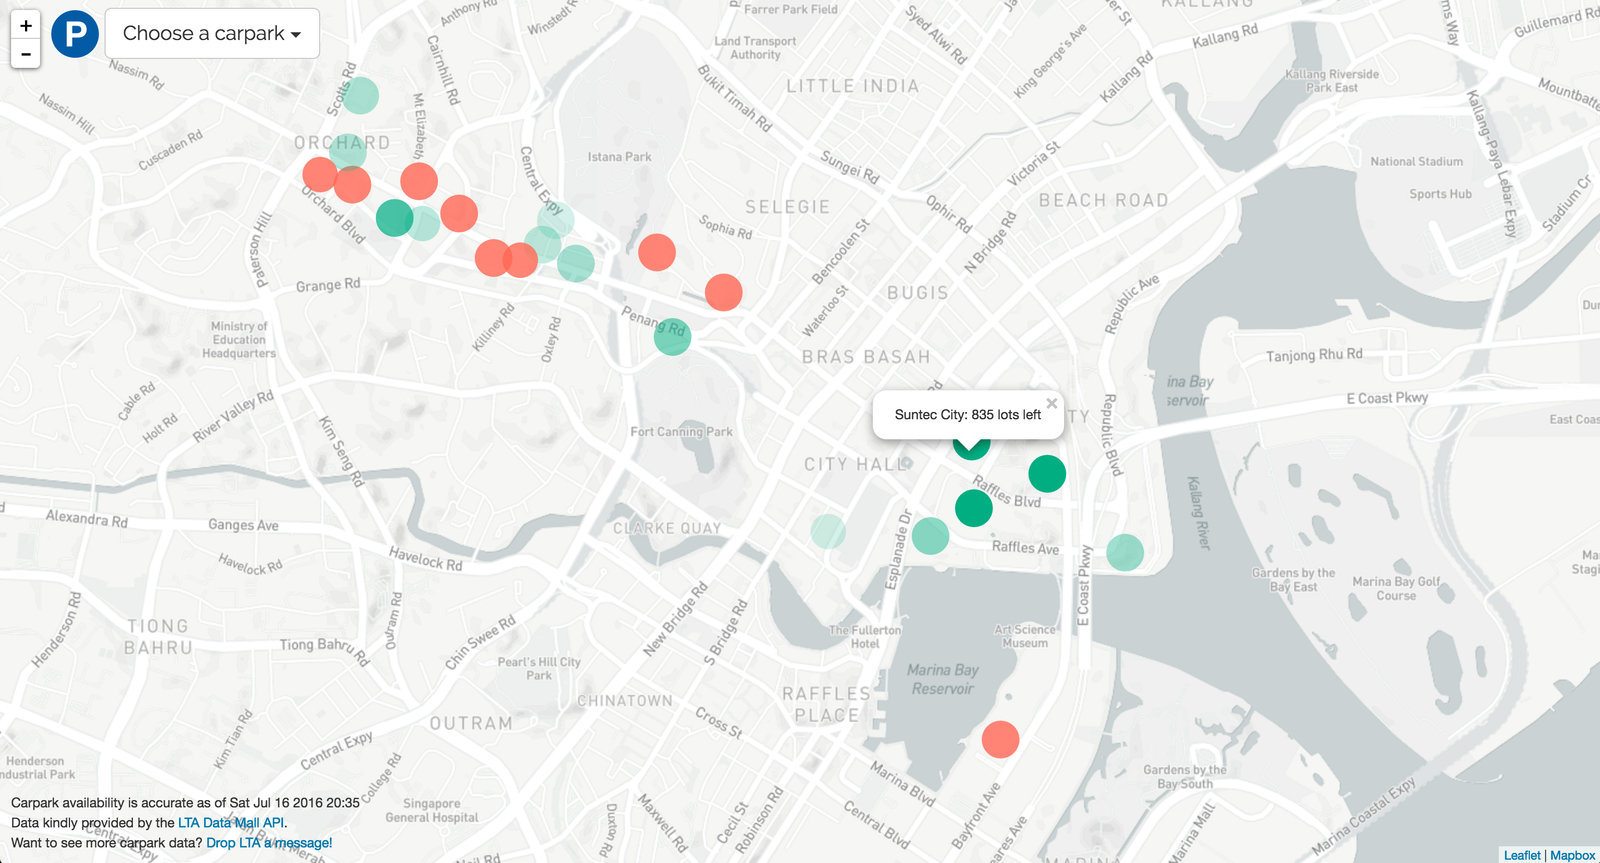
url: carparks-sg.herokuapp.com
github repo: github.com/davified/project-3a-clean
presentation: bit.ly/2ard8f0
About @davified
- Student at General Assembly WDI
- (used to be a) Trade policy analyst
- Political Science graduate
Past projects

Past projects
Building the app in 4 steps
-
Exploring data (LTA Data Mall & Postman)
-
Setting up server for API calls (Node and Express)
-
Serving data to the client (AJAX requests)
-
Visualising data on a map (leaflet.js)
1. Exploring data
- Awesome Documentation at LTA DataMall
- Comprises data on
-
Bus stops, arrival and routes
-
Taxi availability
-
Carpark availability
-
ERP rates
-
Estimated travel time
-
Roadworks
-
Traffic incidents
-
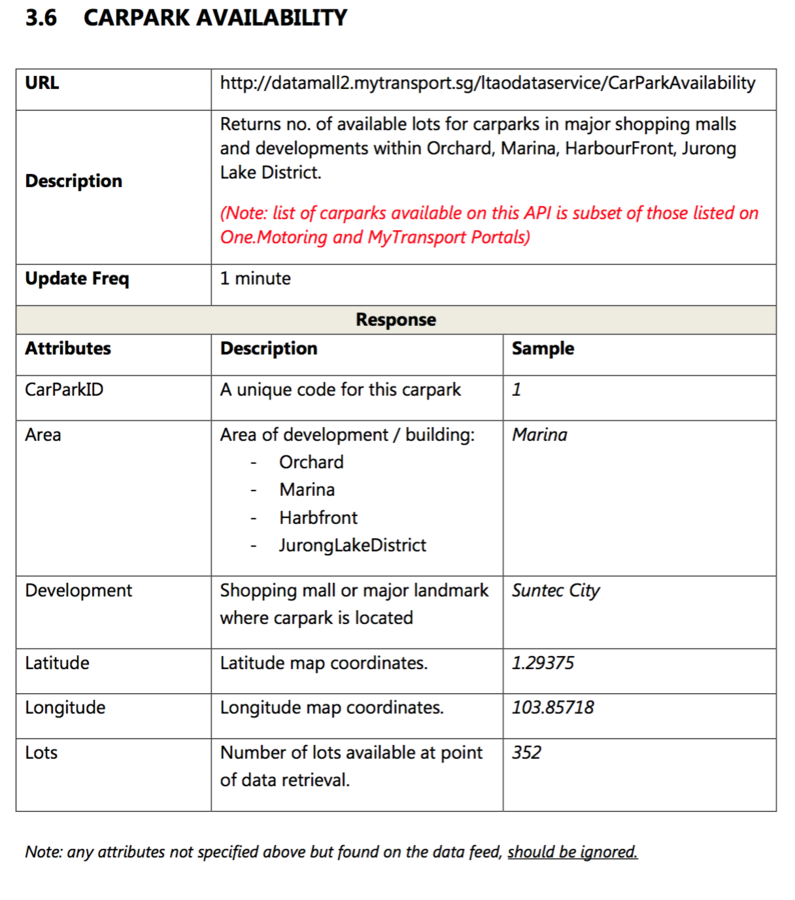
- Carpark availability
- Latitude
- Longitude
- Name of development
- Number of available parking lots
- Postman - a convenient way to make AJAX requests to APIs (demo)
1. Exploring data
2. Setting up a server with Express

2. Setting up a server with Express
-
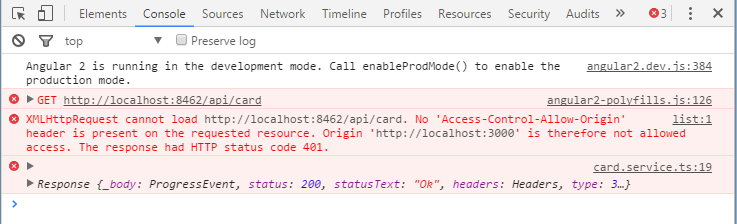
beCORS...
-
The same-origin policy prevents JavaScript from making requests across domain boundaries (e.g. https, localhost, file://) to prevent a malicious script on one page from obtaining access to sensitive data on another web page.
-
Enabling cross-origin resource sharing (CORS) on an Express server overcomes this barrier
2. Setting up a server with Express
const express = require('express')
const path = require('path')
const bodyParser = require('body-parser')
const port = process.env.PORT || 3000
const api = require('./api')
const dotenv = require('dotenv')
dotenv.load()

var app = express()

app.use(express.static(path.join(__dirname, 'public')))
app.use(function (req, res, next) {
  res.header('Access-Control-Allow-Origin', '*')
  res.header('Access-Control-Allow-Headers', 'Origin, X-Requested-With, Content-Type, Accept')
  next()
})

app.use('/api', api)

app.get('/', function (req, res) {
  res.sendFile(path.join(__dirname + '/index.html'))
})

// setting up the port
app.listen(port, function () {
  console.log(`express has started on port ${port}`)
})
app.js
2. Setting up a server with Express
var express = require('express')
var router = express.Router()
var request = require('request')
const dotenv = require('dotenv')
dotenv.load()

var options = {
  url: 'http://datamall2.mytransport.sg/ltaodataservice/CarParkAvailability',
  headers: {
    'accountkey': process.env.ACCOUNTKEY,
    'uniqueuserid': process.env.UNIQUEUSERID,
    'accept': 'application/json'
  }
}

router.get('/', (req, res) => {
  request(options, function (error, response, body) {
    if (!error && response.statusCode === 200) {
      var info = JSON.parse(body)
      var infoArray = info['value']
      res.send(infoArray)
    }
  })
})

module.exports = router3. Serving data to the client
1. Sending an AJAX request to our own API
function getData () {
    $.ajax({
      url: 'https://carparks-sg.herokuapp.com/api',
      type: 'GET',
      success: function (data) {
        visualiseData(data)
      }
    })
  }
2. Appending data returned from our AJAX request onto a map, using leaflet.js
4. Geographic visualisation with Leaflet.js in 2 steps
- Load base map
- Add markers and popups
4. Leaflet.js in 3 steps
- Load base map
<html>
<body>
    <div id="mapid"></div> <!-- the awesomeness of leaflet is appended on this single line -->
</body>


<script>
// creating a map
var mymap = L.map('mapid').setView([1.2981, 103.8498], 15)

// selecting the base map
L.tileLayer('https://api.mapbox.com/styles/v1/mapbox/light-v9/tiles/256/{z}/{x}/{y}?
             access_token={accessToken}', {
  attribution: '<a href="http://mapbox.com">Mapbox</a>',
  maxZoom: 18,
  zoomControl: false,
  accessToken: 'process.env.MAPBOXACCESSTOKEN'
}).addTo(mymap)
</script>
</html>
(you can browse through cool base maps here)
4. Leaflet.js in 2 steps
2. Add markers (circles, in my case)
// our ajax request returns us an array of objects (i.e. data)

function visualiseData (data) {
  data.sort(function (b, a) { return (a.Development > b.Development) ? 1 :
    ((b.Development > a.Development) ? -1 : 0) })

  for (var i = 0; i < data.length; i++) {
    var lon = data[i].Longitude
    var lat = data[i].Latitude
    var lots = data[i].Lots
    var message = data[i].Development + ': ' + data[i].Lots + ' lots left'

    var intensity = lots / 600

    var circle = L.circle([lat, lon], 80, {
      fillColor: '#09AD83',
      fillOpacity: intensity,
      stroke: false,
      className: 'animate'
    })

  circle.bindPopup(message)

  }
}
You've just learnt how to create a nifty web app using LTA's API!
Text
Questions?
Future tweaks to the project
- Experiment with traffic accident data
- Include HDB and URA carpark data
- Note: HDB and URA's data only shows total number of lots, rather than number of available lots