Be a Hero
Drupal Performance
David Flores @dmouse
Conoce al nerd

David Flores
@dmouse
david@consultoriadigital.mx
Linux, Drupal, Movíles, Periodismo, BackEnd, Web, Javascript, FrontEnd, Seguridad, HTML5, Python, evangelist, @LinuxPuebla, ...sometimes #Nerd Speaker
¡Mi sitio ya es popular!

Lo básico
CSS/JS Compression
Disable theme registry
Disable database loggin and tracker
Block cache
Apache mod_expires
"Boost Module"
(El varnish de los pobres)

No estaba hecho para volar...
Refactorización
Módulos innecesarios

Revisar consultas
(views y modulos propios)

Módulos con operaciones poco optimas


Buscamos programadores
(Que tengan buenos reflejos)

Escalabilidad
Demo

dmouse [at] Ryuk ~ > ab -n 100 -c 5 "http://dev/camp/node"
Server Software:        Apache/2.2.15
Concurrency Level:      5
Time taken for tests:   9.466 seconds

Requests per second:    10.56 [#/sec] (mean)
Time per request:       473.307 [ms] (mean)
Time per request:       94.661 [ms] (mean, across all concurrent requests)
Transfer rate:          734.09 [Kbytes/sec] received

Connection Times (ms)
              min  mean[+/-sd] median   max
Connect:        0    0   0.0      0       0
Processing:   179  470 252.6    415    1701
Waiting:      169  456 249.8    403    1686
Total:        179  470 252.6    416    1702

Percentage of the requests served within a certain time (ms)
  50%    416
  66%    438
  75%    459
  80%    468
  90%    495
  95%   1372
  98%   1690
  99%   1702
 100%   1702 (longest request)
Sin cache
Con cache
dmouse [at] Ryuk ~ > ab -n 100 -c 5 "http://dev/camp/node"Server Software: Apache/2.2.15Concurrency Level: 5 Time taken for tests: 2.802 seconds Complete requests: 100 Failed requests: 0 Write errors: 0 Total transferred: 7031905 bytes HTML transferred: 6985200 bytes Requests per second: 35.68 [#/sec] (mean) Time per request: 140.125 [ms] (mean) Time per request: 28.025 [ms] (mean, across all concurrent requests) Transfer rate: 2450.35 [Kbytes/sec] received Connection Times (ms) min mean[+/-sd] median max Connect: 0 0 0.1 0 1 Processing: 5 140 449.1 12 2445 Waiting: 4 138 447.3 11 2435 Total: 5 140 449.1 13 2445 Percentage of the requests served within a certain time (ms) 50% 13 66% 14 75% 15 80% 16 90% 299 95% 1528 98% 2278 99% 2445 100% 2445 (longest request)
Comparamos
Sin cache
Connection Times (ms)
              min  mean[+/-sd] median   max
Connect:        0    0   0.1      0       1
Processing:     5  140 449.1     12    2445
Waiting:        4  138 447.3     11    2435
Total:          5  140 449.1     13    2445
Connection Times (ms)
min mean[+/-sd] median max
Connect: 0 0 0.0 0 0
Processing: 179 470 252.6 415 1701
Waiting: 169 456 249.8 403 1686
Total: 179 470 252.6 416 1702Con cache
Web Server
Apache/Nginx
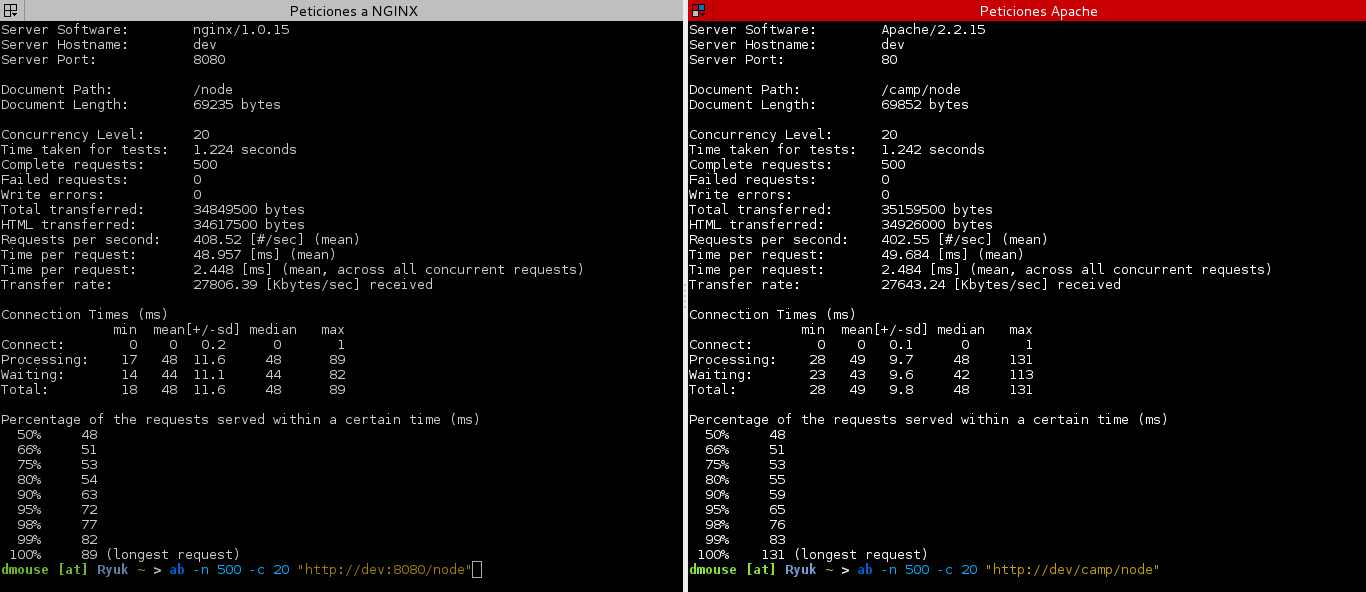
Concurrencia
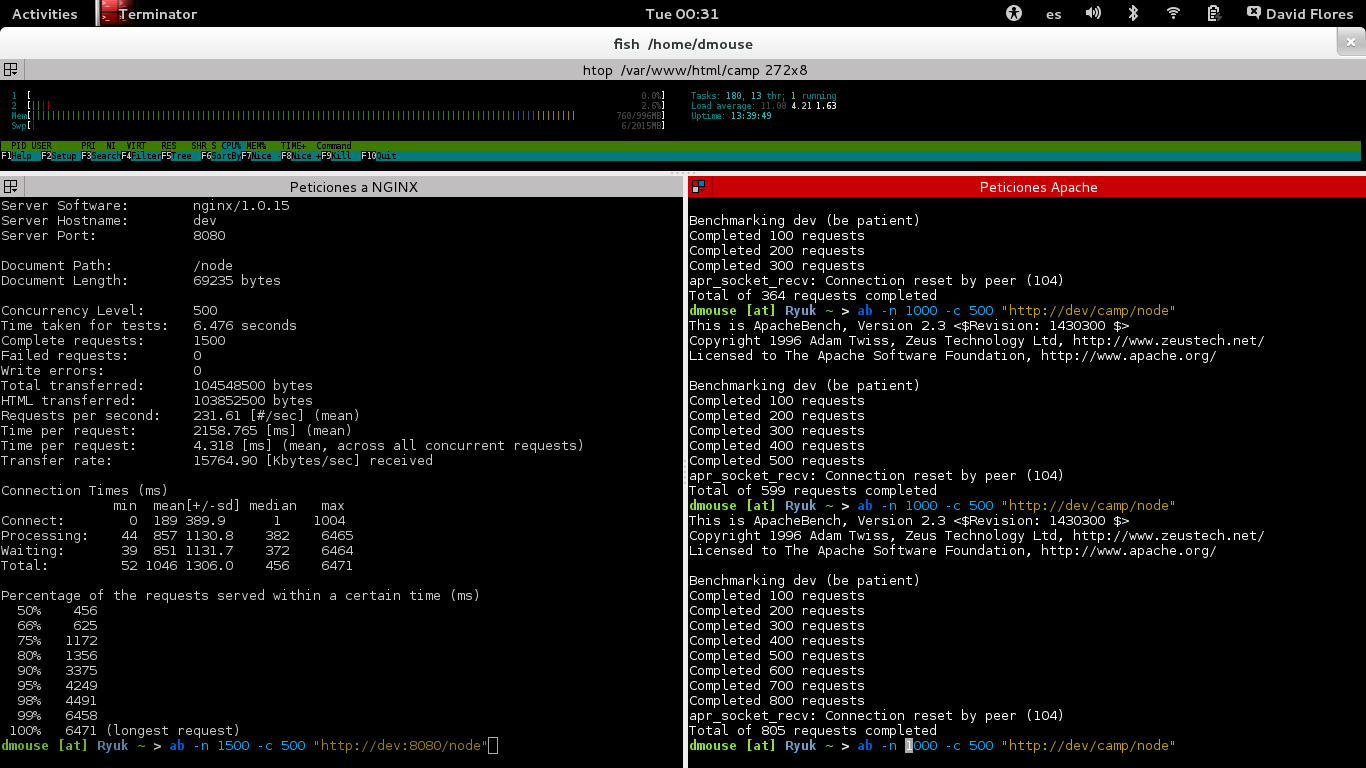
Comparación
Nginx
Apache
ab -n 1000 -c 300 "http://dev/camp/node"
Connection Times (ms)
              min  mean[+/-sd] median   max
Connect:        0  427 1022.2      1    7017
Processing:   325 1660 2188.9    475   13931
Waiting:      323 1645 2176.6    467   13930
Total:        325 2087 2507.1    620   14934
Connection Times (ms)
min mean[+/-sd] median max
Connect: 0 20 136.7 0 1003
Processing: 84 805 427.7 788 3442
Waiting: 83 771 426.8 744 3442
Total: 87 826 450.2 791 3445
ab -n 1500 -c 500 "http://dev:8080/node"
Configuración
https://gist.github.com/dmouse/5479498
Drupal cache

cache_field
 mysql> describe cache_field ;
+------------+--------------+------+-----+---------+-------+
| Field      | Type         | Null | Key | Default | Extra |
+------------+--------------+------+-----+---------+-------+
| cid        | varchar(255) | NO   | PRI |         |       |
| data       | longblob     | YES  |     | NULL    |       |
| expire     | int(11)      | NO   | MUL | 0       |       |
| created    | int(11)      | NO   |     | 0       |       |
| serialized | smallint(6)  | NO   |     | 0       |       |
+------------+--------------+------+-----+---------+-------+
5 rows in set (0.02 sec)
select cid,expire,created,serialized from cache_field limit 1;
+------------------+--------+------------+------------+
| cid | expire | created | serialized |
+------------------+--------+------------+------------+
| field:node:10012 | 0 | 1372664587 | 1 |
+------------------+--------+------------+------------+
1 row in set (0.00 sec)mysql> select data from cache_field limit 1;a:6:{s:16:"field_categor_as";a:1:{s:3:"und";a:1:{i:0;a:1:{s:3:"tid";s:2:"24";}}}s:12:"field_imagen";a:1:{s:3:"und";a:1:{....}{s:5:"value";s:1526:"<p> </p> <p>José Andrés

Predis
 $redis = new Predis\Client(array(
    array('host' => '10.0.0.1', 'port' => 6379),
    array('host' => '10.0.0.2', 'port' => 6379)
));

$replies = $redis->pipeline(function ($pipe) {
    for ($i = 0; $i < 1000; $i++) {
        $pipe->set("key:$i", str_pad($i, 4, '0', 0));
        $pipe->get("key:$i");
    }
});
https://github.com/nrk/predis
Redis Benchmark
root in ~ > redis-benchmark -r 1000000 -n 2000000 -t get,set,lpush,lpop -P 16 -qSET: 214661.36 requests per second GET: 288558.62 requests per second LPUSH: 344056.41 requests per second LPOP: 392233.78 requests per second
Comparación
Con Redis
# ab -n 3000 -c 1000 "http://dev:8080/node"Connection Times (ms) min mean[+/-sd] median max Connect: 0 63 236.6 0 1005 Processing: 16 930 1511.7 159 7352 Waiting: 16 923 1509.9 159 7351 Total: 16 993 1522.7 183 7361
# ab -n 3000 -c 1000 "http://dev:8080/node"Connection Times (ms) min mean[+/-sd] median max Connect: 0 3 5.8 0 16 Processing: 14 10267 22723.6 23 91020 Waiting: 0 10247 22705.5 23 91020 Total: 14 10270 22728.4 23 91036
Sin Redis
Configuración
Varnish
Al Inifinito y más allá
 Server Software:        nginx/1.0.15
Server Hostname:        dev
Server Port:            6081

Document Path:          /node
Document Length:        69235 bytes

Concurrency Level:      3000
Time taken for tests:   29.107 seconds
Complete requests:      60000
Failed requests:        56797
   (Connect: 0, Receive: 0, Length: 56797, Exceptions: 0)
Write errors:           0
Non-2xx responses:      56796
Total transferred:      274924893 bytes
HTML transferred:       259529045 bytes
Requests per second:    2061.38 [#/sec] (mean)
Time per request:       1455.337 [ms] (mean)
Time per request:       0.485 [ms] (mean, across all concurrent requests)
Transfer rate:          9224.03 [Kbytes/sec] received

Connection Times (ms)
              min  mean[+/-sd] median   max
Connect:        0   64 298.0      0    7012
Processing:    32 1052 367.5   1008   27538
Waiting:       32 1051 350.6   1007   20483
Total:         32 1116 468.2   1029   27565

Percentage of the requests served within a certain time (ms)
  50%   1029
  66%   1101
  75%   1135
  80%   1145
  90%   1358
  95%   1961
  98%   2245
  99%   3875
 100%  27565 (longest request)
root@Ryuk ~# ab -n 60000 -c 3000 "http://dev:6081/node"
~ $ ab -n 60000 -c 3000 "http://dev:6081/node"