Data Visualization with D3
David Leonard
March 10th, 2016
David Leonard
David Leonard
What I do:
Grad Student
Dev Games
Yahoo!

What is D3?
Data
- Driven
Documents
HTML
Hyper
Text
Markup
Language
<tagname>content</tagname>
HTML
HTML
<!DOCTYPE html>
<html>
  <head>
    <title>Page Title</title>
  </head>
  <body>
    <h1>My First Heading</h1>
    <p>My first paragraph.</p>
  </body>
</html>
HTML Attributes
<!DOCTYPE html>
<html>
  <head>
    <title>Page Title</title>
  </head>
  <body>
    <h1 id='someID'>My First Heading</h1>
    <p  class='someClass'>My first paragraph.</p>
  </body>
</html>
DOM Tree

Document Object Model
CSS
Cascading
Style
Sheets
p { color: red; font-size: 10px; }
CSS
css selector
property
value
CSS
<!DOCTYPE html>
<html>
  <head>
    <title>Page Title</title>


  </head>
  <body>
    <h1>My First Heading</h1>
    <p>My first paragraph.</p>
  </body>
</html>
<style type='text/css'>
  p {
    color: red;
  }
</style>
External CSS
<!DOCTYPE html>
<html>
  <head>
    <title>Page Title</title>

  </head>
  <body>
    <h1>My First Heading</h1>
    <p>My first paragraph.</p>
  </body>
</html>
p {
  color: red;
}
styles.css
<link rel='stylesheet' href='styles.css'/>
CSS ID Selector
<!DOCTYPE html>
<html>
  <head>
    <title>Page Title</title>

  </head>
  <body>
    <h1 id='someID'>My First Heading</h1>
    <p>My first paragraph.</p>
  </body>
</html>
#someID {
  color: red;
}
styles.css
<link rel='stylesheet' href='styles.css'/>
CSS Class Selector
<!DOCTYPE html>
<html>
  <head>
    <title>Page Title</title>

  </head>
  <body>
    <h1 class='someClass'>My First Heading</h1>
    <p>My first paragraph.</p>
  </body>
</html>
.someClass {
  color: red;
}
styles.css
<link rel='stylesheet' href='styles.css'/>
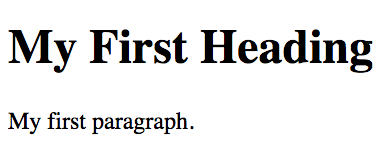
JavaScript
What can JavaScript do?
<!DOCTYPE html>
<html>
  <head>
    <title>DOM Manipulation example</title>
  </head>
  <body>
    <p>JavaScript is magic.</p>
  </body>
</html>
<!DOCTYPE html>
<html>
  <head>
    <title>DOM Manipulation example</title>
  </head>
  <body>
    <p>JavaScript is magic.</p>

  </body>
</html>
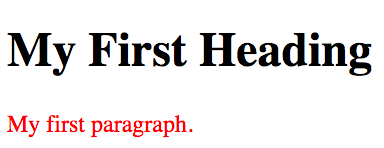
<script type='text/javascript'>
   var paragraphs = document.getElementsByTagName('p');
   for(var i = 0; i < paragraphs.length; i++) {
     paragraphs[i].style.color = 'red';
   }
</script>
JavaScript is pretty cool!

...right?

Interactive Stories
credit: http://www.dangersoffracking.com/

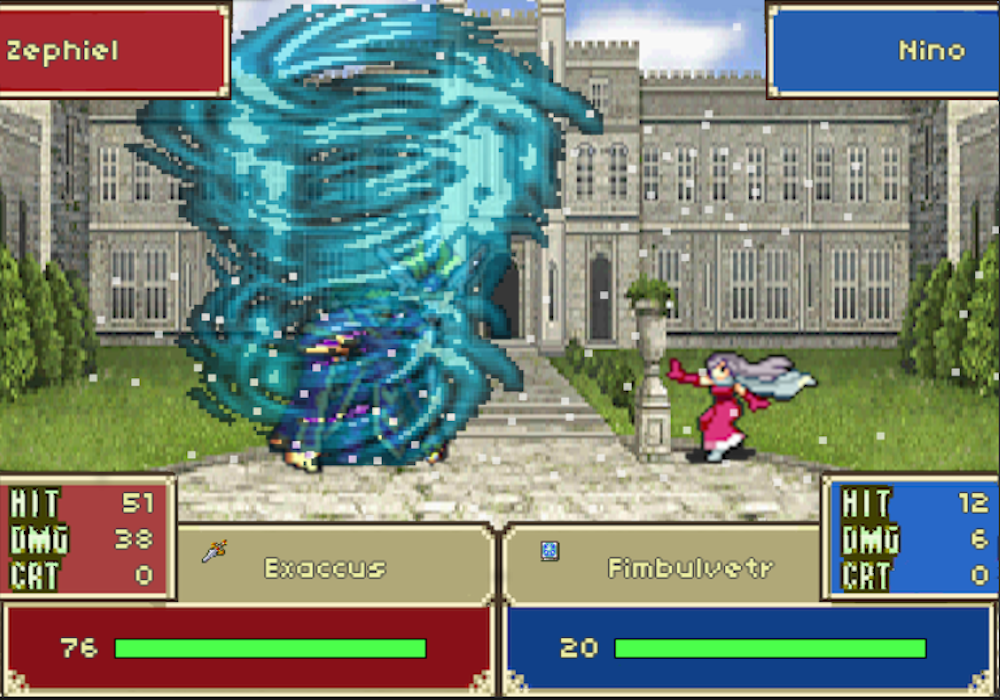
Awesome Browser Games

Interactive Visualizations


EcmaScript
EcmaScript
Language Specification


EcmaScript 2016 (ES6)
Latest Version of JavaScript
Classes
Modules
Let / Const
Scope
EcmaScript 2016 (ES6)


JavaScript Crash Course
Functions
function multiply(x, y) {
   return x * y;
}
Function constructor
var multiply = function(x, y) {
   return x * y;
};
Anonymous Function
var multiply = function func_name(x, y) {
   return x * y;
};
Function in variable
Scope
var snack = 'Meow Mix';

function getFood(food) {
    if (food) {
        var snack = 'Friskies';
        return snack;
    }
    return snack;
}

getFood(false);
// undefined
// undefined
Scope
var snack = 'Meow Mix';

function getFood(food) {
    var snack;

    if (food) {
        snack = 'Friskies';
        return snack;
    }
    return snack;
}

getFood(false);
Hoisting!
(A)
(B)
Scope Continued
function Person(name) {
    this.name = name;
}

Person.prototype.prefixName = function (arr) {
    return arr.map(function (character) {
        return this.name + character;
    });
}
Object Property
// Cannot read property 'name' of undefined
Scope Continued
function Person(name) {
    this.name = name;
}

Person.prototype.prefixName = function (arr) {
    var that = this;
    return arr.map(function (character) {
        return that.name + character;
    });
};
// Store this
Arrow Functions (ES6)
function Person(name) {
    this.name = name;
}

Person.prototype.prefixName = function (arr) {
    return arr.map((character) => this.name + character);
}
Arrow Functions (ES6)
return arr.map(function (character) {
  return that.name + character;
});
return arr.map((character) => this.name + character);
Objects
Just a collection of key / value pairs
var person = {
  firstName:'David',
  lastName:'Leonard',
  age:25,
  eyeColor:'brown'
};
> person.firstName  // 'David'
> person.eyeColor   // 'brown
Method Chaining
var obj = {
    first:  function() { alert('first');   return obj; },
    second: function() { alert('second');  return obj; },
    third:  function() { alert('third');   return obj; }
}
obj.first().second().third();
JavaScript is Aysnchronous!
Sync vs Async
var users = [];

$.get('/users', function(data) {
  users = data;
});
renderUsersOnPage(users);
Asynchronous Call
Callback Functions
$.get('/users', (data) => {
  var users = data;
  renderUsersOnPage(users);
});
Callback Hell
func1(function (value1) {
    func2(value1, function (value2) {
        func3(value2, function (value3) {
            func4(value3, function (value4) {
                func5(value4, function (value5) {
                    // Do something with value 5
                });
            });
        });
    });
});
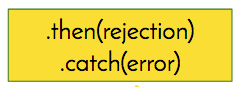
Promises
new Promise(resolve => resolve(data))
    .then(result => console.log(data));
new Promise((resolve, reject) =>
    reject(new Error('Failed to fufill Promise')))
    .catch(reason => console.log(reason));
Promises

Promises
var userData = new Promise((resolve, reject) => {
  $.get('/users', (data) => {
    if (data) {
      resolve(data);
    } else {
      reject(new Error('Failed to fetch data'));
    }
  });
});

renderUsersOnPage(userData);
D3 Fundamentals
Selections
var paragraphs = document.getElementsByTagName('p');
 for(var i = 0; i < paragraphs.length; i++) {
  paragraphs[i].style.color = 'red';
}
.selectAll( )
d3.selectAll('p').style('color', 'red');
.select( )
d3.select('body').append('p').text('New paragraph!');
var body = d3.select('body');
var p = body.append('p');
p.text('New paragraph!');
Binding Data
d3.selectAll('p')
    .data([4, 8, 15, 16, 23, 42])
    .style('font-size', function(d) { return d + 'px'; });
Virtual Selections
<!DOCTYPE html>
<html>
  <head>
    <script type="text/javascript" src="d3.v2.min.js"></script>
  </head>
  <body>
  </body>
</html
var dataset = [ 1, 2, 3 ]

var p = d3.select('body').selectAll('p')
  .data(dataset)
  .enter()
  .append('p')
  .text('hello');
Virtual Selections
.enter( )
.update( )
.exit( )
Virtual Selections
var p = d3.select('body').selectAll('p')
  .data(dataset)
  .enter()
Virtual Selections
var p = d3.select('body').selectAll('p')
  .data(dataset)
  .enter()
  .append('p')
Virtual Selections
var p = d3.select('body').selectAll('p')
  .data(dataset)
  .enter()
  .append('p')
  .text('hello')
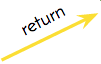
Virtual Selections
var p = d3.select('body').selectAll('p')
  .data(dataset)
  .enter()
  .append('p')
  .text('hello')

console.log(p);
Virtual Selections
var p = d3.select('body').selectAll('p')
  .data(dataset)
  .enter()
  .append('p')
  .text( function (d) { return d; } );
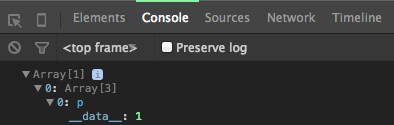
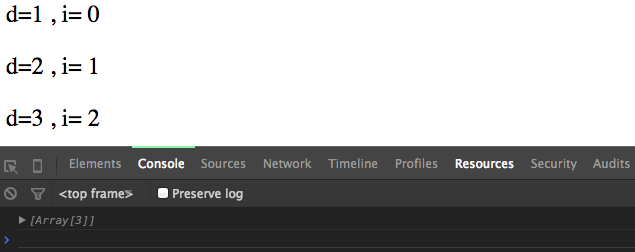
Virtual Selections
var p = d3.select('body').selectAll('p')
  .data(dataset)
  .enter()
  .append('p')
  .text( function (d, i) { return 'd=' + d + ' , i= ' + i ; } );

console.log(p);
Update and Exit
var numbers = [15, 8, 42, 4];
<div id="chart">
  <div class="bar" style="height: 15px; margin-top: 85px;"></div>
  <div class="bar" style="height: 8px; margin-top: 92px;"></div>
  <div class="bar" style="height: 42px; margin-top: 58px;"></div>
  <div class="bar" style="height: 4px; margin-top: 96px;"></div>
</div>
function update() {
  var selection = d3.select('#chart')
    .selectAll('.bar').data(numbers)
}
Update and Exit
function update() {
  var selection = d3.select('#chart')
    .selectAll('.bar').data(numbers)


}
    .style('height', function(d) {
      return d;
    })
    .style('margin-top', function(d) {
      return 100 - d;
    })
.on('click', function(e, i) {
  numbers.splice(i, 1);
  update();
});
Update and Exit
function update() {
  ...


};
selection.enter()
.append('div').attr('class', 'bar')
.style('height', function(d){
  return d;
})
.style('margin-top', function(d){
  return 100 - d;
})
.on('click', function(e, i){
  numbers.splice(i, 1);
  update();
});
selection.exit().remove();
Update and Exit
d3.select('#add-btn').on('click', function(e) {
  numbers.push(Math.round(Math.random() * 100));
  update();
});
Update and Exit

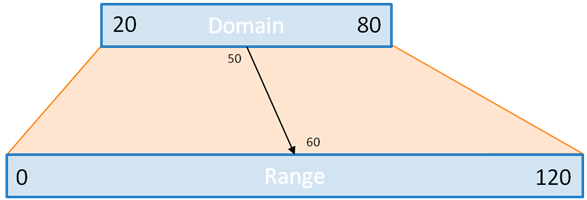
Scales
Scales are functions that map from an input domain to an output range.
Mike Bostock
Scales
var dataset = [ 100, 200, 300, 400, 500 ];
What if we had larger numbers?
Linear Scales
credit: http://www.jeromecukier.net/wp-content/uploads/2011/08/d3scale1.png
Linear Scale Construction
var scale = d3.scale.linear()
  .domain([100, 500])
  .range([10, 350]);


> scale(100); // Returns 10
> scale(300); // Returns 180
> scale(500); // Returns 350
Scalable Vector Graphics
SVG Rectangle
<svg width='50' height='50'>
  <rect x='0' y='0' width='50' height='50' fill='green' />
</svg>

SVG Circle
<svg width='50' height='50'>
  <circle cx='25' cy='25' r='25' fill='purple' />
</svg>

SVG Ellipse
<svg width='50' height='50'>
  <ellipse cx='25' cy='25' rx='15' ry='10' fill='red' />
</svg>

SVG Lines
<svg width='50' height='50'>
  <line x1='5' y1='5' x2='40' y2='40' stroke='gray' stroke-width='5' />
</svg>

SVG Paths
<svg width='100' height='100'>
  <path d='


    stroke='red'
    stroke-width='2'
    fill='none'
  />
</svg>
M 10 25
L 10 75
L 60 75
L 10 25'
SVG Groups
<svg width='200' height='200'>

   <circle cx='20' cy='20' r='20' fill='green' />
   <circle cx='70' cy='70' r='20' fill='purple' />


   <rect x='110' y='110' height='30' width='30' fill='blue' />
   <rect x='160' y='160' height='30' width='30' fill='red' />

</svg>
<g>
<g>
<g/>
<g/>
Axes
Constructing Axes
var svgContainer = d3.select('body').append('svg')
  .attr('width', 400)
  .attr('height', 100);
var axisScale = d3.scale.linear()
  .domain([0, 100])
  .range([0, 400]);
var xAxis = d3.svg.axis()
  .scale(axisScale);
var xAxisGroup = svgContainer.append("g")
  .call(xAxis);
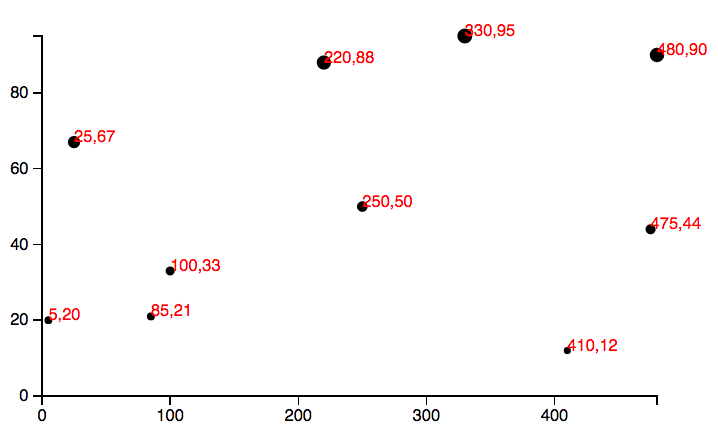
Constructing Axes

Constructing Axes
var width = 500;
var height = 300;
var padding = 30;

var dataset = [
  [5, 20], [480, 90], [250, 50], [100, 33], [330, 95],
  [410, 12], [475, 44], [25, 67], [85, 21], [220, 88]
];
Constructing Axes
var xScale = d3.scale.linear()
  .domain([0, d3.max(dataset, function(d) { return d[0]; })])
  .range([padding, width - padding * 2]);
var yScale = d3.scale.linear()
  .domain([0, d3.max(dataset, function(d) { return d[1]; })])
  .range([height - padding, padding]);
var rScale = d3.scale.linear()
  .domain([0, d3.max(dataset, function(d) { return d[1]; })])
  .range([2, 5]);
Constructing Axes
var xAxis = d3.svg.axis()
  .scale(xScale)
  .orient('bottom')
  .ticks(5);
var yAxis = d3.svg.axis()
  .scale(yScale)
  .orient('left')
  .ticks(5);
Constructing Axes
var svg = d3.select('body')
  .append('svg')
  .attr('width', width)
  .attr('height', height);
Constructing Axes
var svg = d3.select('body')
  .append('svg')
  .attr('width', width)
  .attr('height', height);
Constructing Axes
svg.selectAll('circle')
  .data(dataset)
  .enter()
  .append('circle')
  .attr('cx', function(d) {
    return xScale(d[0]);
  })
  .attr('cy', function(d) {
    return yScale(d[1]);
  })
  .attr('r', function(d) {
    return rScale(d[1]);
  });
Constructing Axes
svg.selectAll('text')
  .data(dataset)
  .enter()
  .append('text')
  .text(function(d) {
    return d[0] + ',' + d[1];
  })
  .attr('x', function(d) {
    return xScale(d[0]);
  })
  .attr('y', function(d) {
    return yScale(d[1]);
  })
  .attr('font-family', 'sans-serif')
  .attr('font-size', '11px')
  .attr('fill', 'red');
Constructing Axes
svg.append('g')
  .attr('class', 'axis')
  .attr('transform', 'translate(0,' + (height - padding) + ')')
  .call(xAxis);
svg.append('g')
  .attr('class', 'axis')
  .attr('transform', 'translate(' + padding + ',0)')
  .call(yAxis);
Constructing Axes
Thanks!
Github: https://github.com/DrkSephy
ES6 Cheatsheet: https://github.com/DrkSephy/es6-cheatsheet
Dashing D3: https://www.dashingd3js.com/
D3 Resources
Scott Murray: http://alignedleft.com/tutorials/d3
D3 Blocks: https://bl.ocks.org/
D3 Slides: https://bost.ocks.org/mike/d3/workshop/#0
Data Visualization with D3
By David Leonard
Data Visualization with D3
A brief dive into HTML / CSS / JS along with a deep dive into D3.js.


