Detecting the Cyclic Behavior of Malware with graph theory. The Cerber ransomware case
InBot2016
Sebastian Garcia
sebastian.garcia@agents.fel.cvut.cz
@eldracote
Live Slides: bit.ly/Inbot16
The Machine Discussion
-
Is it working?
-
Amount of Data
-
Validation/Results
-
Time
-
Adversaries, Coupled System
-
Are humans not working?
The Network Detection Issue
-
IoC are the best we have.
-
IoC are not enough, specially for new malware. Not to mention how malware evolves.
-
Payloads are usually not available (crowdsource).
-
Flows usually are. But what can we do from them?
The Markov's Problem
-
Stratosphere IPS Project.
-
Machine Learning to help protect NGO's network.
-
-
Model each connection as a string of letters and apply Markov Chains to model the behavior.
-
Works, but some connections looks exactly the same as normal ones. We can not differentiate them.
https://stratosphereips.org
The Proximity Controversy
-
Maybe, we are looking too closely.
-
TCP Behavior of Cerber Ransomware
The Proximity Controversy
-
Maybe, we are looking too closely.
-
UDP Behavior of Cerber Ransomware
The Cerber Internalization
-
Only suspicious connection, 31.184.234.0/24 range, UDP port 6892
-
hi0072895
-
ffc44638ecb00072870150ba
-
ffc44638ecb00d
-
-
In our capture, some Adobe legit update connection:
-
104.127.48.56 80/tcp
-
99,i,i,i,i,i,i,i,i,i,i,i,i,i,i,I,I,i,i,i,i,i,i,i,i,i,i,i,i,h,z,Z000Z,i,i,i,i,i,i
-
-
The Graph Idealization
-
Given that the malware connections are generated by an algorithm, they are related. We hypothesize that the relationship can be modeled.
-
Our model is a graph for each srcIP, where:
-
Each node is the tuple DstIP, DstPort, Proto.
-
The sequence of flows from one node to another in the network are the edges.
-
The Graph Idealization
-
Made by Daniel Šmolík, from the Stratosphere team
-
The more times an edge is found, the thicker it is.
-
The more times a node is repeated, the bigger it is.
-
The more times a node loops with it self, the color gets darker.
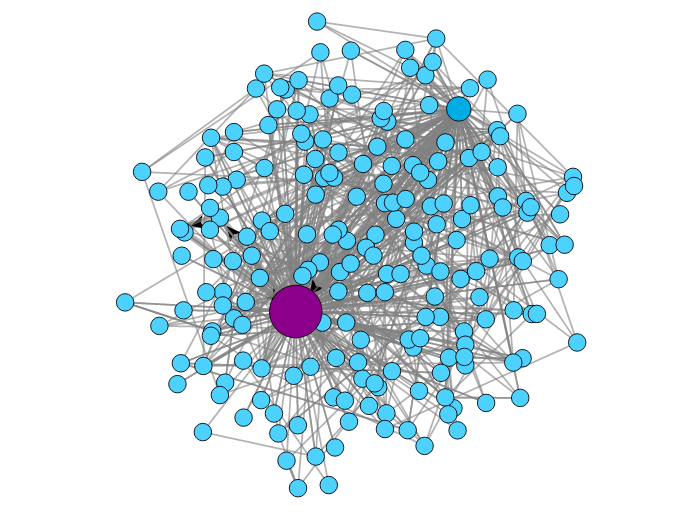
The Normal Behavior I
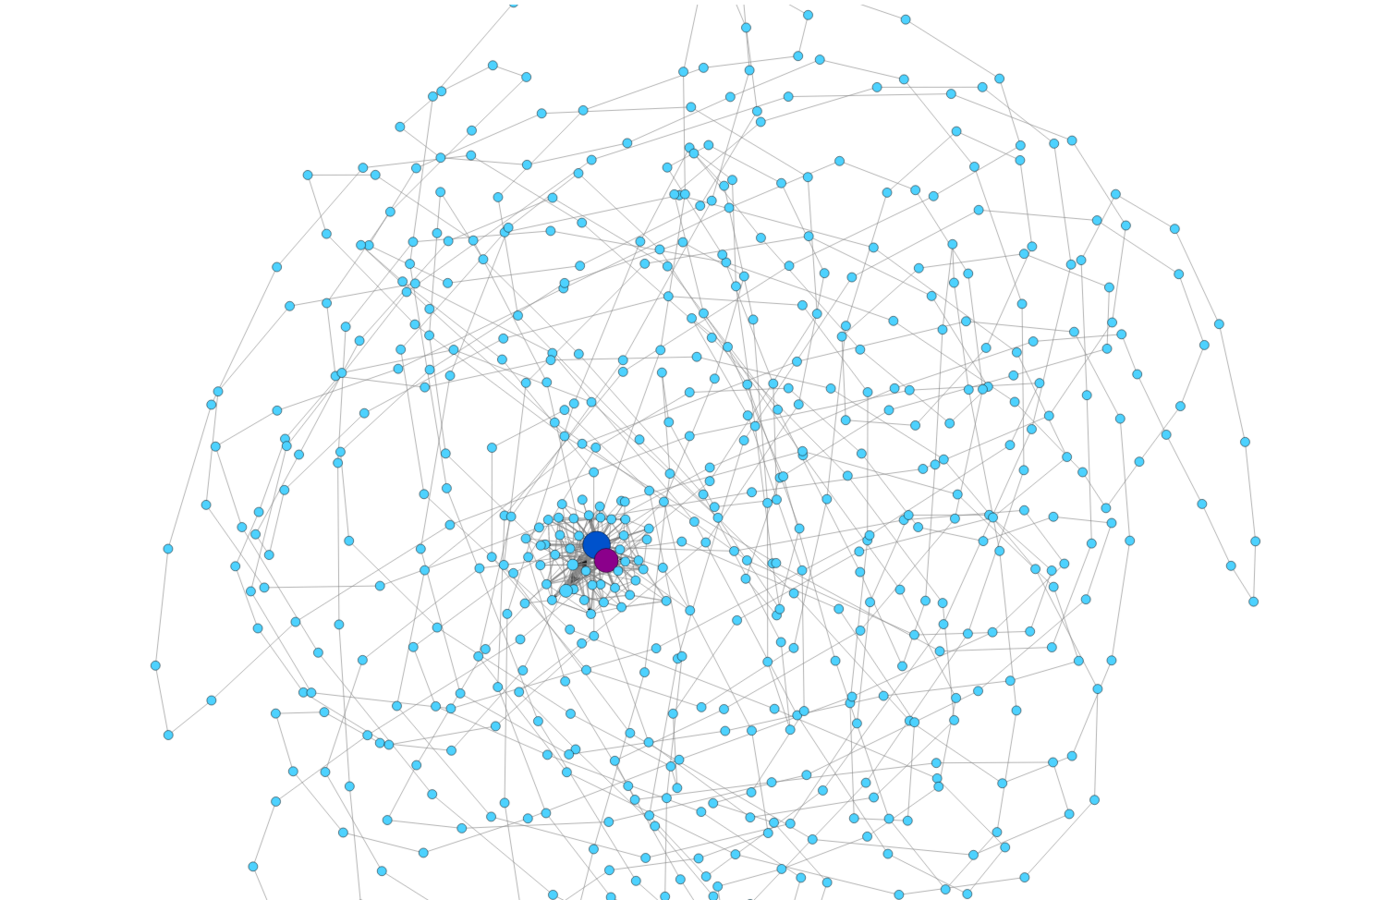
The Normal Behavior II
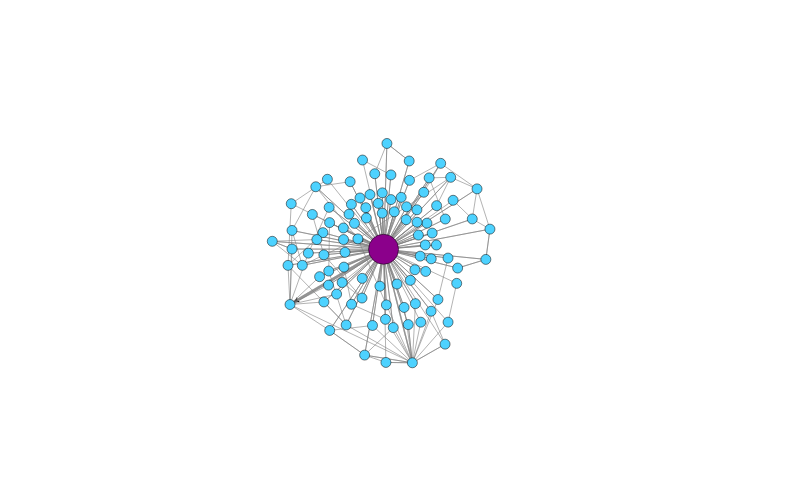
The Cerber Ransomware Contraption
The Cerber Ransomware Contraption
The Simple Analytic Analysis
-
# of nodes.
-
# of edges.
-
# of times a node loops with itself.
-
# of times an edge is repeated.
-
The percentage of repeating edges from the total edges.
Analyzing the Behavior of a Host
-
Cerber Ransomware
-
Nodes: 566, Edges: 702
-
Autolooping nodes: 20
-
Repeating edges: 590 (84%)
-
-
Normal I
-
Nodes: 98, Edges: 263
-
Autolooping nodes: 47
-
Repeating edges: 6 (2.2%)
-
-
Normal II
-
Nodes: 1072, Edges: 1881
-
Autolooping nodes: 95
-
Repeating edges: 4 (0.21%)
-
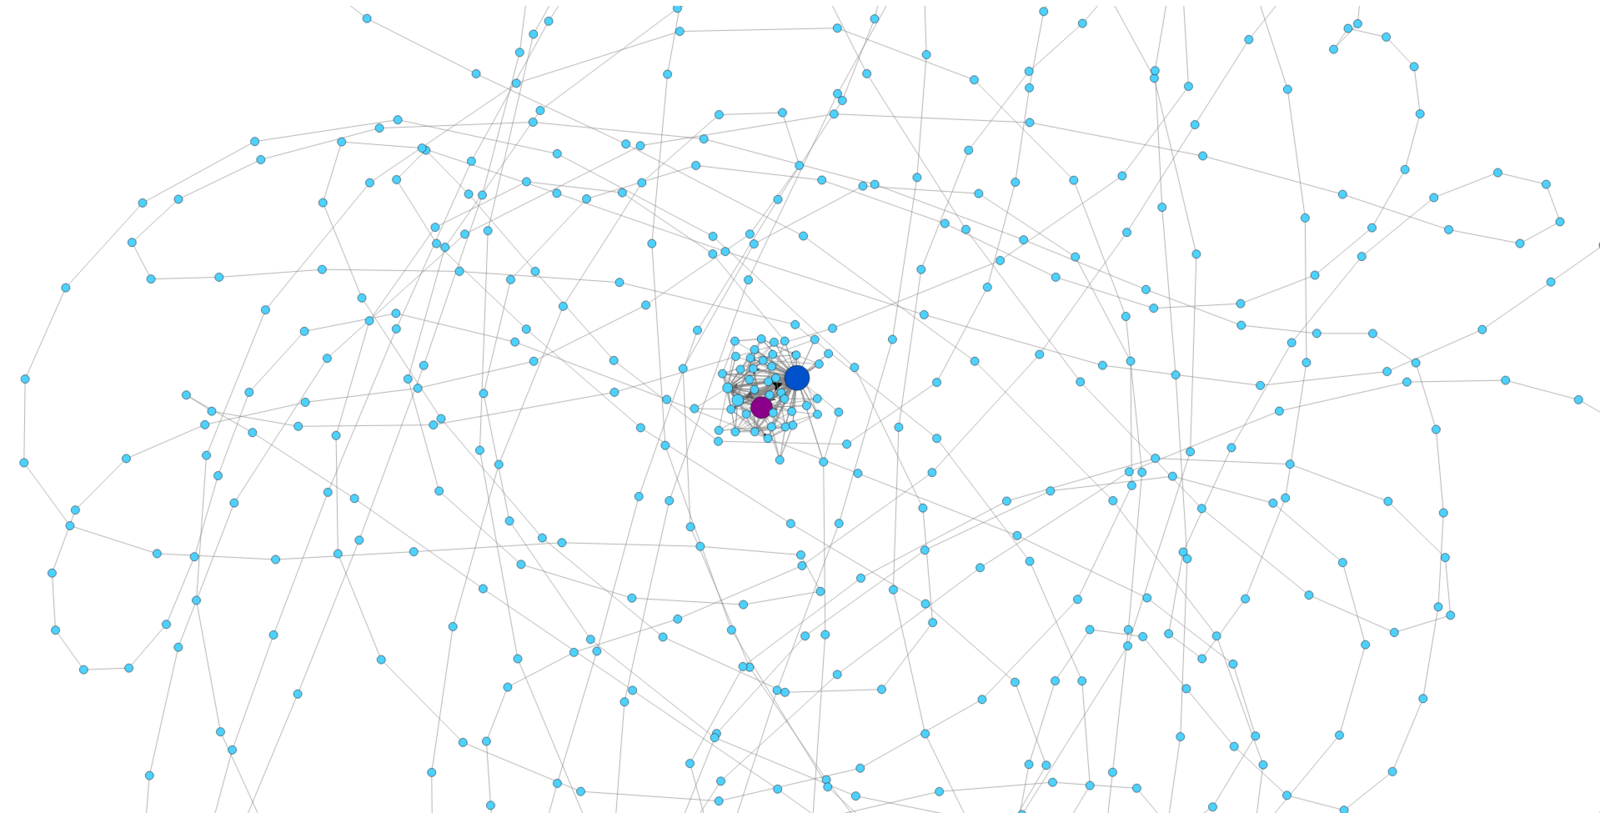
The Extreme Normality Case
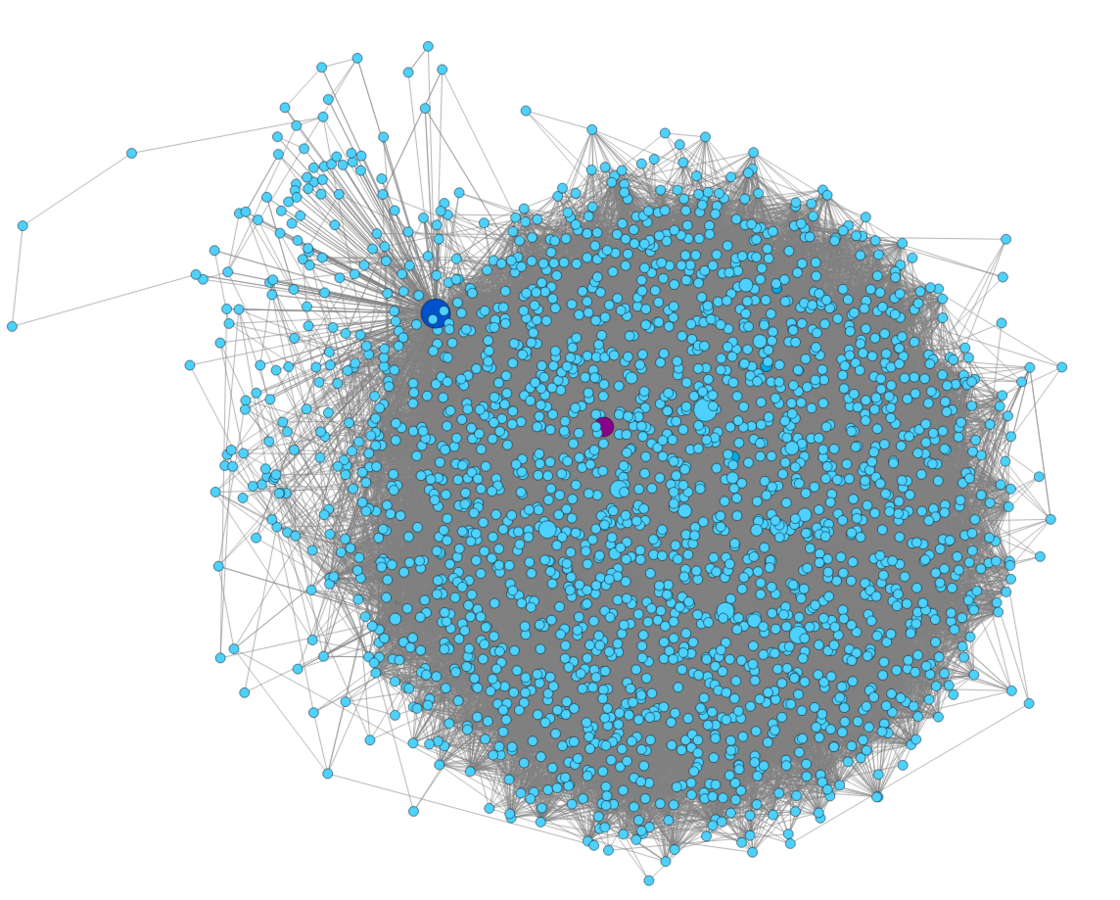
Analyzing the Behavior of a Host
-
Extreme Normal
-
Nodes: 2,499, Edges: 32,023
-
Autolooping nodes: 219
-
Repeating edges: 318 (0.99%)
-
-
Other Normals
-
1.1%, 1%, 0.9%, 0.9%
-
-
Other Malware
-
Ctu179, Barys: 100%
-
Ctu186, Normal+Cerber: 99.75%
-
Ctu183, Locky: 97.95%
-
The Sality Case

(6.2%)
Conclusion and Thanks!
-
The relationships seem to be consistent.
-
The behavior of the malware can be modeled and used for detection.
-
We always need better experiments. Now working this approach with our NGOs.
-
Thanks Daniel Smolík for his work.