Audit Plugin:
Dashboards with the Elastic Stack
June 13-15, 2017
iRODS User Group Meeting 2017
Utrecht, Netherlands
Justin James
Applications Engineer
iRODS Consortium

Audit Plugin:
Dashboards with the Elastic Stack

Introduction

- The audit plugin generates messages for every policy enforcement point (PEP) that is fired.
- This plugin generates AMQP messages.
- We will take these messages and feed them through the Elastic Stack.
- The result is a useful presentation of the status of an iRODS grid.
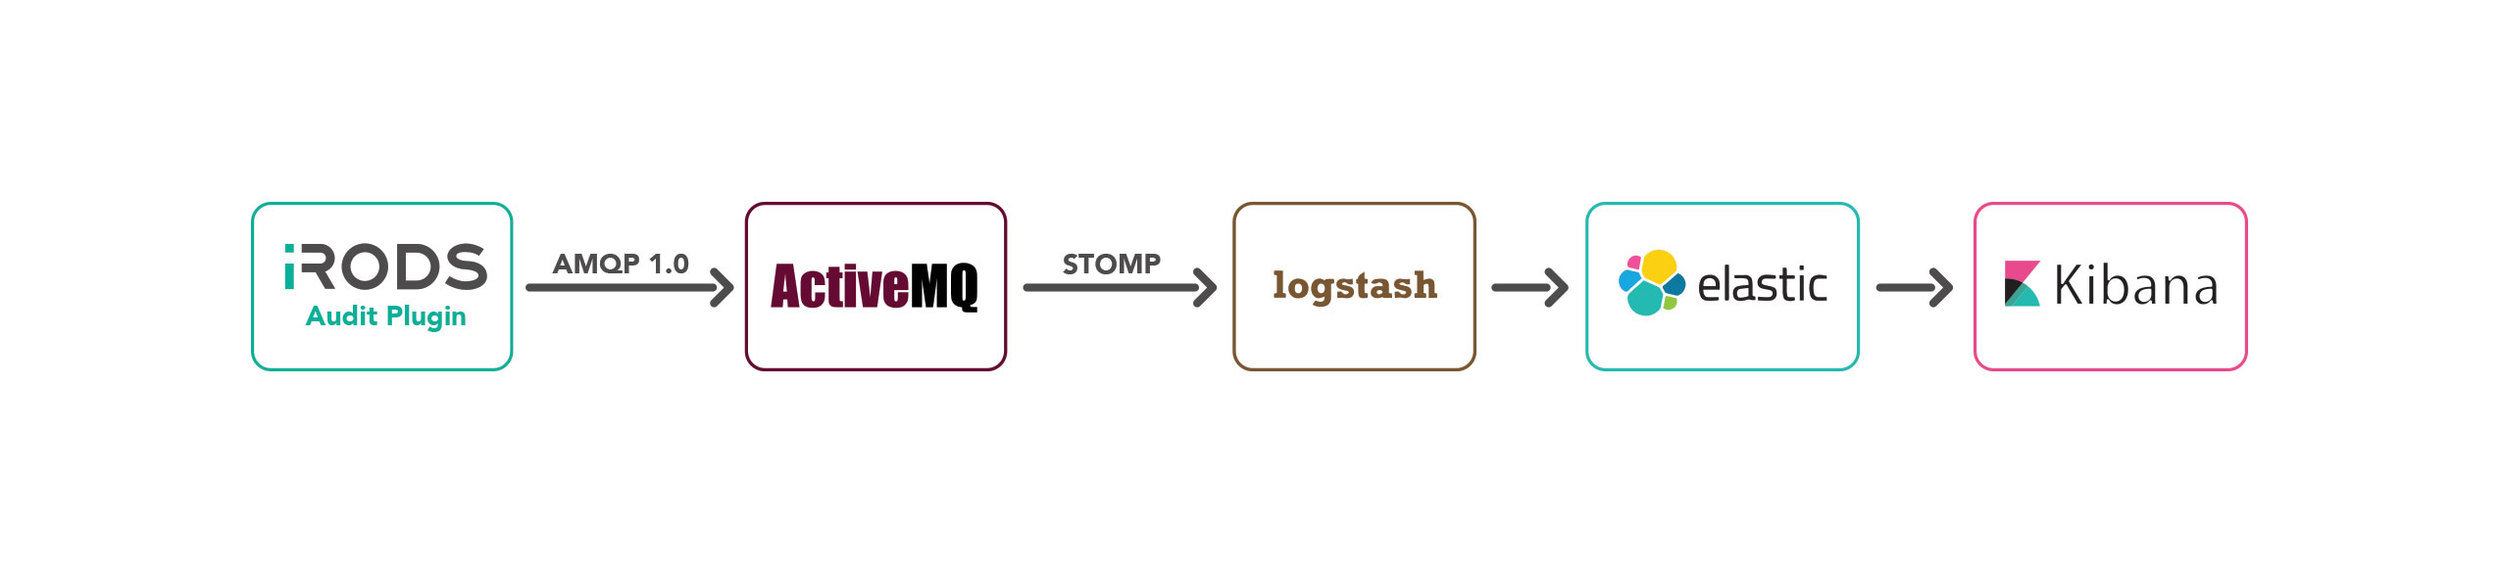
Introduction (Data Flow)
- iRODS audit plugin generates an AMQP message for each dynamic PEP.
- These messages are stored in a message broker. In our example we will use ActiveMQ as the broker.
- Logstash reads each message from the broker and sends the message to Elasticsearch.
- Kibana is used to create customized visualizations of the Elasticsearch data.
Audit Rule Engine Plugin (Set Up Build Dependencies)
The rule engine plugin will be included in pre-built packages. For now we will build these packages ourselves.
Before we can build the plugin, we need to get some build dependencies:
wget -qO - https://core-dev.irods.org/irods-core-dev-signing-key.asc\
 | sudo apt-key add -
echo "deb [arch=amd64] https://core-dev.irods.org/apt/ $(lsb_release -sc) main"\
 | sudo tee /etc/apt/sources.list.d/renci-irods-core-dev.list
sudo apt-get update
sudo apt-get install -y irods-externals*
sudo apt-get install -y irods-dev
sudo apt-get install -y qpid-client
export PATH=/opt/irods-externals/cmake3.5.2-0/bin:$PATH
Audit Rule Engine Plugin (Build and Install)
Clone the repository and build and install the audit rule plugin.
git clone https://github.com/irods/irods_rule_engine_plugin_audit_amqp
cd irods_rule_engine_plugin_audit_amqp
mkdir build
cd build
cmake ..
make package
sudo dpkg -i irods-rule-engine-plugin-audit-amqp-4.2.0-ubuntu14-x86_64.deb
Audit Rule Engine Plugin (Configuration)
The last installation step is to update /etc/irods/server_config.json to use the rule engine plugin. Add the following in the rule_engines array.
{
 "instance_name": "irods_rule_engine_plugin-audit_amqp-instance",
 "plugin_name": "irods_rule_engine_plugin-audit_amqp",
 "plugin_specific_configuration" : {
   "pep_regex_to_match" : "audit_.*",
   "amqp_topic" : "queue://audit_messages",
   "amqp_location" : "localhost:5672",
   "amqp_options" : ""
   }
}
Add "audit_" in the rule_engine_namespace.
    "rule_engine_namespaces": [
        "",
        "audit_",
        "indexing_"
    ],
Message Broker (Installation)
The audit plugin sends AMQP 1.0 events to a message broker.
wget http://archive.apache.org/dist/activemq/5.13.2/apache-activemq-5.13.2-bin.tar.gz
gunzip apache-activemq-5.13.2-bin.tar.gz
tar xvf apache-activemq-5.13.2-bin.tar
cd apache-activemq-5.13.2/bin
./activemq start
We will install Apache ActiveMQ as the message broker.
Perform the following steps to install and start the message broker.
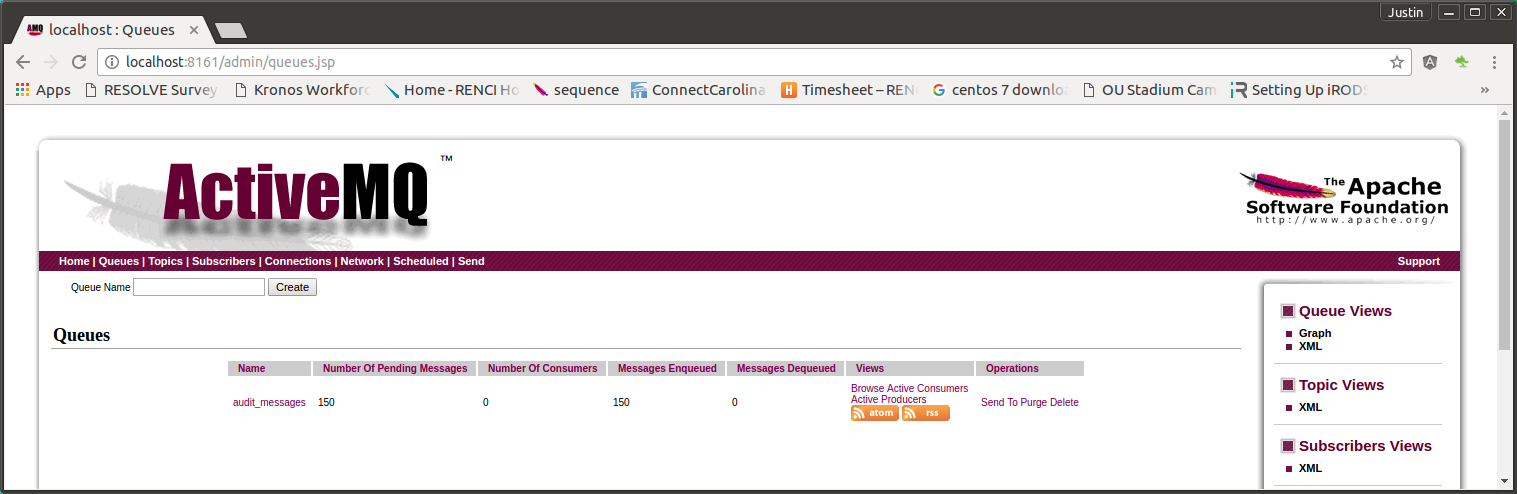
Message Broker (Testing)
In a browser, navigate to http://localhost:8161/admin/ (the default login/password is admin/admin) and click on "Queues". Perform some iCommands and see messages being added to the "audit_messages" queue.
ElasticSearch (Installation)
All of the dynamic PEP information will be stored in an ElasticSearch database.
echo "deb http://packages.elastic.co/elasticsearch/2.x/debian stable main" | sudo tee -a /etc/apt/sources.list.d/elasticsearch-2.x.list
sudo apt-get update
sudo apt-get --force-yes install elasticsearch
sudo service elasticsearch restart
Install ElasticSearch:
ElasticSearch (Configuration)
curl -XPUT 'http://localhost:9200/audit_log'
curl -XPUT localhost:9200/audit_log/_mapping/hostname_mapping -d '
{
  "properties": {
    "hostname": {
       "type": "string",
      "index": "not_analyzed"
    }
  }
}'
Set up an index on Elasticsearch and make sure the hostname field is not analyzed. This will allow us to group data by hostname.
Logstash (Installation)
wget -qO - https://packages.elastic.co/GPG-KEY-elasticsearch | sudo apt-key add -
echo "deb http://packages.elastic.co/logstash/2.1/debian stable main" | \
    sudo tee -a /etc/apt/sources.list.d/logstash-2.x.list
sudo apt-get update
sudo apt-get install logstash
cd /opt/logstash/bin/

# install logstash-input-stomp plugin
sudo ./plugin install logstash-input-stomp
Logstash reads the messages from the ActiveMQ message broker, transforms them, and stores them in Elasticsearch.
Install Logstash and the stomp plugin.
Logstash (Configuration)
input {
    # Read the audit_messages queue messages using the stomp protocol.
    stomp {
        host        => "localhost"
        destination => "/queue/audit_messages"
        codec       => plain {
                           charset => "ISO-8859-1"
                       }
    }

}

filter {

    # Remove AMQP header and footer information from message
    ruby {
        code => " event['message'].sub!(/.*__BEGIN_JSON__/, '')
                  event['message'].sub!(/__END_JSON__.*/, '')
                "
    }
As super-user, create /opt/logstash/bin/audit.conf and put the following contents in this file.
Logstash (Configuration)
    # Parse the JSON message
    json {
        source       => "message"
        remove_field => ["message"]
    }

    # Replace @timestamp with the timestamp stored in time_stamp
    date {
        match => [ "time_stamp", "UNIX_MS" ]
    }

    # Convert select fields to integer
    mutate {
        convert => { "int" => "integer" }
        convert => { "int__2" => "integer" }
        convert => { "int__3" => "integer" }
        convert => { "file_size" => "integer" }
    }
}

output {
    # Write the output to elastic search under the audit_log index.
    elasticsearch {
        hosts => ["localhost:9200"]
        index => "audit_log"
    }
    stdout {
        codec => rubydebug {
        }
    }
}
audit.conf (cont)
Logstash (Configuration)
Logstash configuration files have three parts: input, filter, and output.
Input:
- The input section configures Logstash to read the messages from the "audit_messages" queue using the stomp protocol.
Logstash (Configuration)
Filter:
- The ruby section updates the "message" field to remove some AMQP header information. What is left should be a JSON formatted string.
- The json section parses the JSON in the message field and creates output fields corresponding to the JSON fields.
- The date section replaces the @timestamp field with the timestamp stored in 0__time_stamp.
- The mutate section converts some select strings to integers so they will have the appropriate data type in Elasticsearch.
Logstash (Configuration)
Output:
- The output writes the resulting information to Elasticsearch under the "audit_log" index.
- The stdout writes the resulting output in an easily readable format to the stdout. This can be commented out once debugging is finished.
Logstash (Starting)
Start logstash:
cd /opt/logstash/bin
./logstash -f audit.conf
Logstash (Testing)
Perform some iCommands (ils, iput, etc.). If everything is configured properly you should see messages written to stdout where Logstash was started. Also examine the ActiveMQ queue and verify that Logstash has dequeued all of the messages.
At this point the information should be written to the Elasticsearch database. You can use curl to verify this:
curl -XGET 'localhost:9200/audit_log/_search' -d '{
    "fields": [ "3__rule_name", "2__pid" ],
   "size": "100",
   "query": {
      "term": { "3__rule_name": "audit_pep_database_open_pre"}
   }
}'
Kibana (Installation)
Kibana is used to query and display information graphically from our Elasticsearch database. We will use a Kibana dashboard to monitor our iRODS grid.
echo "deb http://packages.elastic.co/kibana/4.4/debian stable main" | \
    sudo tee -a /etc/apt/sources.list.d/kibana-4.4.x.list
sudo apt-get update
sudo apt-get -y install kibana
sudo service kibana start
Install and start Kibana.
Access the Kibana web portal using the following URL: http://localhost:5601
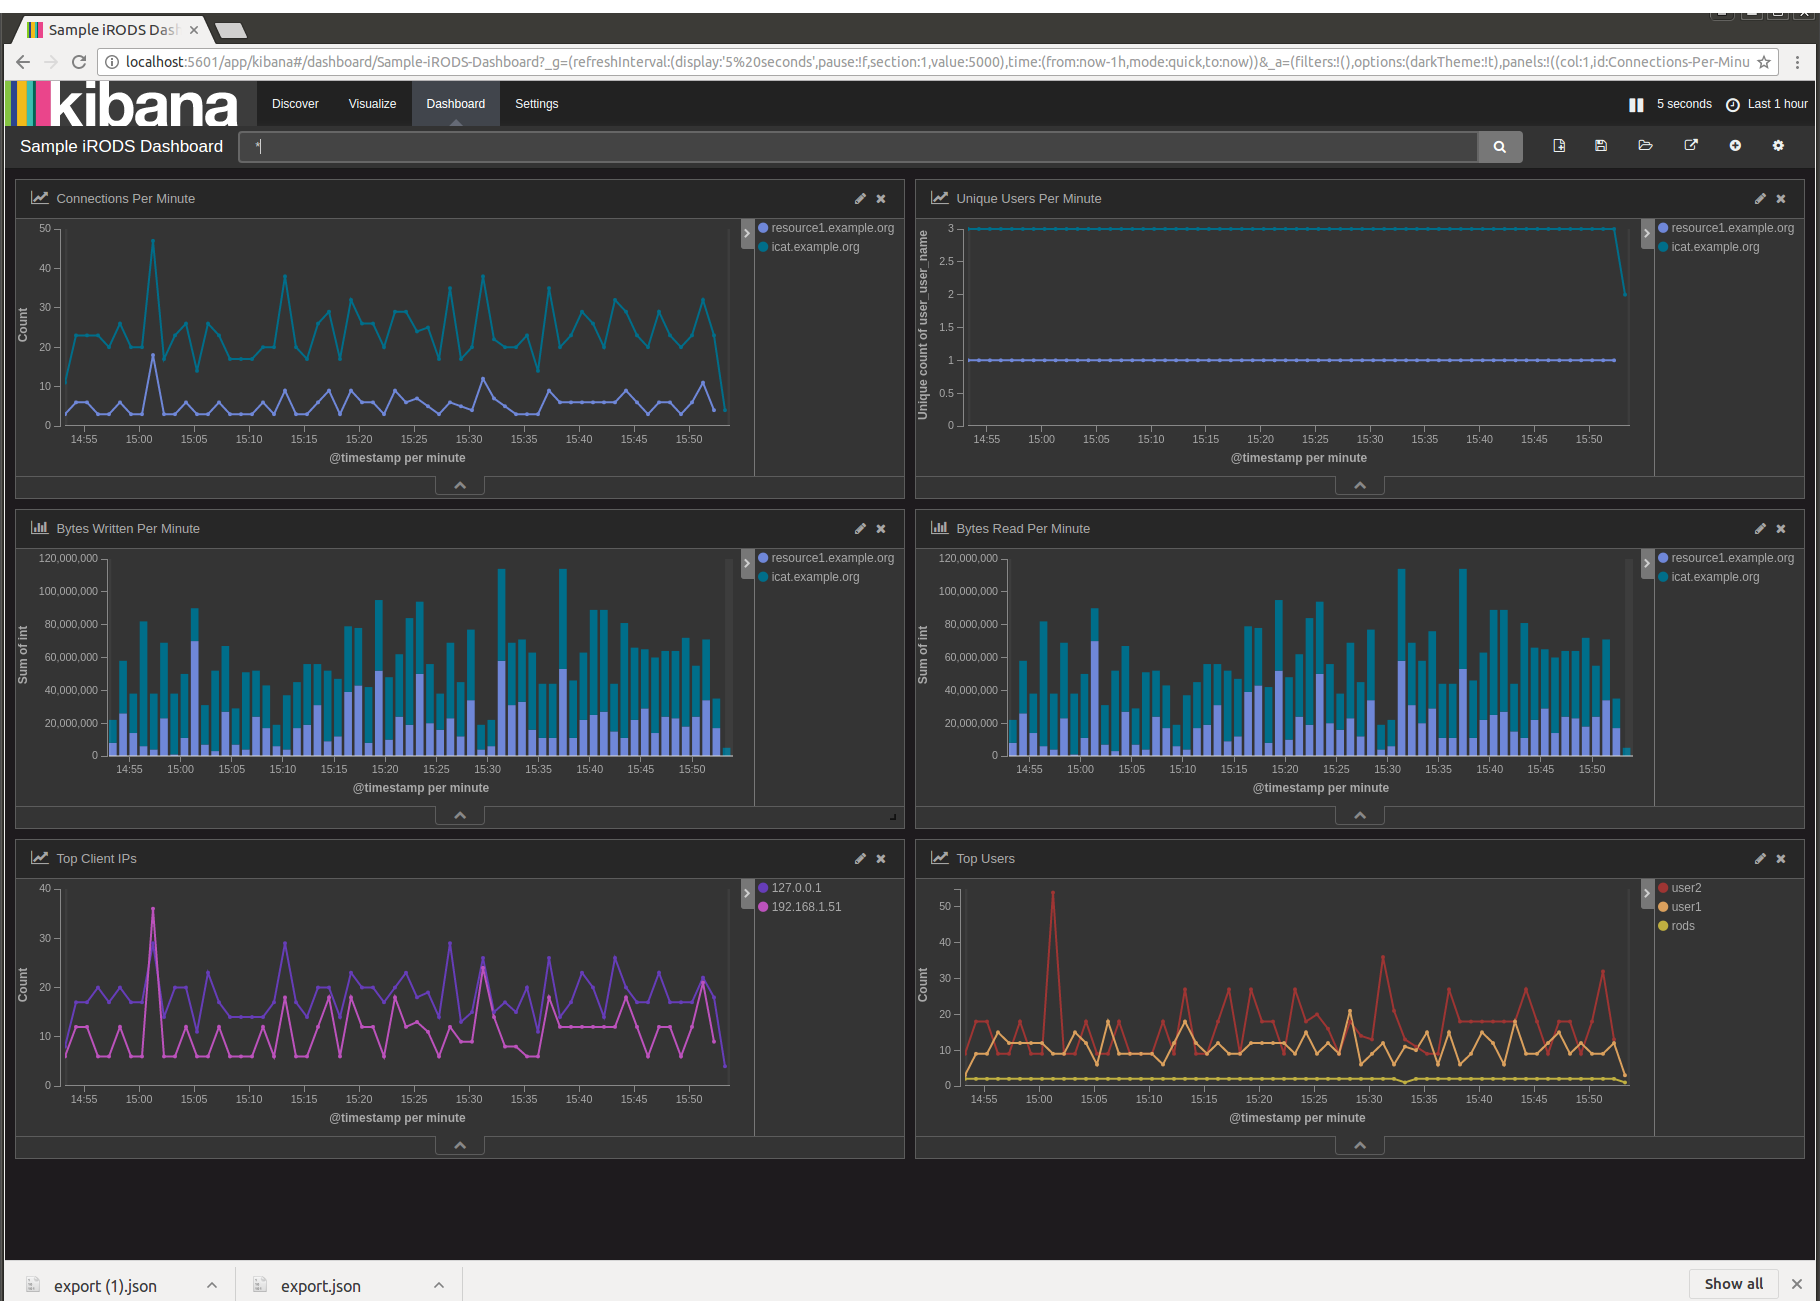
Kibana (Configuration)
We've set up a sample dashboard for Kibana which displays the following information about our grid.
- A line graph with the number of connections per minute.
- A line graph with the number of unique users per minute.
- A bar graph of the number of bytes written per minute per server.
- A bar graph of the number of bytes read per minute per server.
- A line graph of the number of connections per minute per IP address.
- A line graph of the number of connections per minute per user.
Kibana (Configuration)
Dashboards can be built with the graphical tools provided in Kibana. We've built and exported this sample dashboard. We will import this sample dashboard.
Create irods_dashboard.json with the following contents:
[
  {
    "_id": "Sample-iRODS-Dashboard",
    "_type": "dashboard",
    "_source": {
      "title": "Sample iRODS Dashboard",
      "hits": 0,
      "description": "",
      "panelsJSON": "[{\"col\":1,\"id\":\"Connections-Per-Minute\",\"panelIndex\":3,\"row\":1,\"size_x\":6,\"size_y\":4,\"type\":\"visualization\"},{\"col\":7,\"id\":\"Unique-Users-Per-Minute\",\"panelIndex\":4,\"row\":1,\"size_x\":6,\"size_y\":4,\"type\":\"visualization\"},{\"col\":1,\"id\":\"Bytes-Written-Per-Minute\",\"panelIndex\":5,\"row\":5,\"size_x\":6,\"size_y\":3,\"type\":\"visualization\"},{\"col\":7,\"id\":\"Bytes-Read-Per-Minute\",\"panelIndex\":6,\"row\":5,\"size_x\":6,\"size_y\":3,\"type\":\"visualization\"},{\"col\":1,\"id\":\"Top-Client-IPs\",\"panelIndex\":7,\"row\":8,\"size_x\":6,\"size_y\":4,\"type\":\"visualization\"},{\"col\":7,\"id\":\"Top-Users\",\"panelIndex\":8,\"row\":8,\"size_x\":6,\"size_y\":4,\"type\":\"visualization\"}]",
      "optionsJSON": "{\"darkTheme\":true}",
      "uiStateJSON": "{}",
      "version": 1,
      "timeRestore": false,
      "kibanaSavedObjectMeta": {
        "searchSourceJSON": "{\"filter\":[{\"query\":{\"query_string\":{\"analyze_wildcard\":true,\"query\":\"*\"}}}]}"
      }
    }
  },
Kibana (Configuration)
irods_dashboard.json (cont):
  {
    "_id": "Bytes-Read-Per-Minute",
    "_type": "visualization",
    "_source": {
      "title": "Bytes Read Per Minute",
      "visState": "{\"title\":\"Bytes Read Per Minute\",\"type\":\"histogram\",\"params\":{\"shareYAxis\":true,\"addTooltip\":true,\"addLegend\":true,\"scale\":\"linear\",\"mode\":\"stacked\",\"times\":[],\"addTimeMarker\":false,\"defaultYExtents\":false,\"setYExtents\":false,\"yAxis\":{}},\"aggs\":[{\"id\":\"1\",\"type\":\"sum\",\"schema\":\"metric\",\"params\":{\"field\":\"int\"}},{\"id\":\"2\",\"type\":\"date_histogram\",\"schema\":\"segment\",\"params\":{\"field\":\"@timestamp\",\"interval\":\"m\",\"customInterval\":\"2h\",\"min_doc_count\":1,\"extended_bounds\":{}}},{\"id\":\"3\",\"type\":\"terms\",\"schema\":\"group\",\"params\":{\"field\":\"hostname\",\"size\":10,\"order\":\"desc\",\"orderBy\":\"_term\"}}],\"listeners\":{}}",
      "uiStateJSON": "{}",
      "description": "",
      "version": 1,
      "kibanaSavedObjectMeta": {
        "searchSourceJSON": "{\"index\":\"audit_log\",\"query\":{\"term\":{\"rule_name\":\"audit_pep_resource_read_post\"}},\"filter\":[]}"
      }
    }
  },
Kibana (Configuration)
irods_dashboard.json (cont):
  {
    "_id": "Top-Users",
    "_type": "visualization",
    "_source": {
      "title": "Top Users",
      "visState": "{\"title\":\"Top Users\",\"type\":\"line\",\"params\":{\"addLegend\":true,\"addTimeMarker\":false,\"addTooltip\":true,\"defaultYExtents\":false,\"drawLinesBetweenPoints\":true,\"interpolate\":\"linear\",\"radiusRatio\":9,\"scale\":\"linear\",\"setYExtents\":false,\"shareYAxis\":true,\"showCircles\":true,\"smoothLines\":false,\"times\":[],\"yAxis\":{}},\"aggs\":[{\"id\":\"1\",\"type\":\"count\",\"schema\":\"metric\",\"params\":{}},{\"id\":\"3\",\"type\":\"terms\",\"schema\":\"group\",\"params\":{\"field\":\"user_user_name\",\"size\":5,\"order\":\"desc\",\"orderBy\":\"1\"}},{\"id\":\"4\",\"type\":\"date_histogram\",\"schema\":\"segment\",\"params\":{\"field\":\"@timestamp\",\"interval\":\"m\",\"customInterval\":\"2h\",\"min_doc_count\":1,\"extended_bounds\":{}}}],\"listeners\":{}}",
      "uiStateJSON": "{}",
      "description": "",
      "version": 1,
      "kibanaSavedObjectMeta": {
        "searchSourceJSON": "{\"index\":\"audit_log\",\"query\":{\"term\":{\"rule_name\":\"audit_pep_auth_agent_auth_request_pre\"}},\"filter\":[]}"
      }
    }
  },
Kibana (Configuration)
irods_dashboard.json (cont):
  {
    "_id": "Unique-Users-Per-Minute",
    "_type": "visualization",
    "_source": {
      "title": "Unique Users Per Minute",
      "visState": "{\"title\":\"Unique Users Per Minute\",\"type\":\"line\",\"params\":{\"shareYAxis\":true,\"addTooltip\":true,\"addLegend\":true,\"showCircles\":true,\"smoothLines\":false,\"interpolate\":\"linear\",\"scale\":\"linear\",\"drawLinesBetweenPoints\":true,\"radiusRatio\":9,\"times\":[],\"addTimeMarker\":false,\"defaultYExtents\":false,\"setYExtents\":false,\"yAxis\":{}},\"aggs\":[{\"id\":\"1\",\"type\":\"cardinality\",\"schema\":\"metric\",\"params\":{\"field\":\"user_user_name\"}},{\"id\":\"2\",\"type\":\"date_histogram\",\"schema\":\"segment\",\"params\":{\"field\":\"@timestamp\",\"interval\":\"m\",\"customInterval\":\"2h\",\"min_doc_count\":1,\"extended_bounds\":{}}},{\"id\":\"3\",\"type\":\"terms\",\"schema\":\"group\",\"params\":{\"field\":\"hostname\",\"size\":10,\"order\":\"desc\",\"orderBy\":\"_term\"}}],\"listeners\":{}}",
      "uiStateJSON": "{}",
      "description": "",
      "version": 1,
      "kibanaSavedObjectMeta": {
        "searchSourceJSON": "{\"index\":\"audit_log\",\"query\":{\"term\":{\"rule_name\":\"audit_pep_auth_agent_auth_request_pre\"}},\"filter\":[]}"
      }
    }
  },
Kibana (Configuration)
irods_dashboard.json (cont):
  {
    "_id": "Connections-Per-Minute",
    "_type": "visualization",
    "_source": {
      "title": "Connections Per Minute",
      "visState": "{\"title\":\"Connections Per Minute\",\"type\":\"line\",\"params\":{\"addLegend\":true,\"addTimeMarker\":false,\"addTooltip\":true,\"defaultYExtents\":false,\"drawLinesBetweenPoints\":true,\"interpolate\":\"linear\",\"radiusRatio\":9,\"scale\":\"linear\",\"setYExtents\":false,\"shareYAxis\":true,\"showCircles\":true,\"smoothLines\":false,\"times\":[],\"yAxis\":{}},\"aggs\":[{\"id\":\"1\",\"type\":\"count\",\"schema\":\"metric\",\"params\":{}},{\"id\":\"2\",\"type\":\"date_histogram\",\"schema\":\"segment\",\"params\":{\"field\":\"@timestamp\",\"interval\":\"m\",\"customInterval\":\"2h\",\"min_doc_count\":1,\"extended_bounds\":{},\"json\":\"\"}},{\"id\":\"3\",\"type\":\"terms\",\"schema\":\"group\",\"params\":{\"field\":\"hostname\",\"size\":10,\"order\":\"desc\",\"orderBy\":\"_term\"}}],\"listeners\":{}}",
      "uiStateJSON": "{}",
      "description": "",
      "version": 1,
      "kibanaSavedObjectMeta": {
        "searchSourceJSON": "{\"index\":\"audit_log\",\"query\":{\"term\":{\"rule_name\":\"audit_pep_auth_agent_auth_request_pre\"}},\"filter\":[]}"
      }
    }
  },
Kibana (Configuration)
irods_dashboard.json (cont):
  {
    "_id": "Bytes-Written-Per-Minute",
    "_type": "visualization",
    "_source": {
      "title": "Bytes Written Per Minute",
      "visState": "{\"title\":\"Bytes Written Per Minute\",\"type\":\"histogram\",\"params\":{\"addLegend\":true,\"addTimeMarker\":false,\"addTooltip\":true,\"defaultYExtents\":false,\"mode\":\"stacked\",\"scale\":\"linear\",\"setYExtents\":false,\"shareYAxis\":true,\"times\":[],\"yAxis\":{}},\"aggs\":[{\"id\":\"1\",\"type\":\"sum\",\"schema\":\"metric\",\"params\":{\"field\":\"int\"}},{\"id\":\"2\",\"type\":\"date_histogram\",\"schema\":\"segment\",\"params\":{\"field\":\"@timestamp\",\"interval\":\"m\",\"customInterval\":\"2h\",\"min_doc_count\":1,\"extended_bounds\":{}}},{\"id\":\"3\",\"type\":\"terms\",\"schema\":\"group\",\"params\":{\"field\":\"hostname\",\"size\":10,\"order\":\"desc\",\"orderBy\":\"_term\"}}],\"listeners\":{}}",
      "uiStateJSON": "{}",
      "description": "",
      "version": 1,
      "kibanaSavedObjectMeta": {
        "searchSourceJSON": "{\"index\":\"audit_log\",\"query\":{\"term\":{\"rule_name\":\"audit_pep_resource_write_post\"}},\"filter\":[]}"
      }
    }
  },
Kibana (Configuration)
irods_dashboard.json (cont):
  {
    "_id": "Top-Client-IPs",
    "_type": "visualization",
    "_source": {
      "title": "Top Client IPs",
      "visState": "{\"aggs\":[{\"id\":\"1\",\"params\":{},\"schema\":\"metric\",\"type\":\"count\"},{\"id\":\"3\",\"params\":{\"field\":\"client_addr\",\"order\":\"desc\",\"orderBy\":\"1\",\"size\":5},\"schema\":\"group\",\"type\":\"terms\"},{\"id\":\"4\",\"params\":{\"customInterval\":\"2h\",\"extended_bounds\":{},\"field\":\"@timestamp\",\"interval\":\"m\",\"min_doc_count\":1},\"schema\":\"segment\",\"type\":\"date_histogram\"}],\"listeners\":{},\"params\":{\"addLegend\":true,\"addTimeMarker\":false,\"addTooltip\":true,\"defaultYExtents\":false,\"drawLinesBetweenPoints\":true,\"interpolate\":\"linear\",\"radiusRatio\":9,\"scale\":\"linear\",\"setYExtents\":false,\"shareYAxis\":true,\"showCircles\":true,\"smoothLines\":false,\"times\":[],\"yAxis\":{}},\"title\":\"Top Client IPs\",\"type\":\"line\"}",
      "uiStateJSON": "{}",
      "description": "",
      "version": 1,
      "kibanaSavedObjectMeta": {
        "searchSourceJSON": "{\"index\":\"audit_log\",\"query\":{\"term\":{\"rule_name\":\"audit_pep_auth_agent_auth_request_pre\"}},\"filter\":[]}"
      }
    }
  }
]
Kibana (Configuration)
Load this dashboard in the Kabana web portal by performing the following tasks:
- Select Settings->Indices, update the index name or pattern to "audit_log". Tab out of this text field (to enable the create button) and click the create button.
- Select Settings->Objects->Import and load irods_dashboard.json.
- Click on the eye icon next to the "Sample iRODS Dashboard".
Note: If you get an error on input stating "Could not locate that index-pattern-field, it is likely because an iget and iput haven't been executed and certain database fields that are used by the visualizations have not yet been created. Perform an iget and iput, click Settings->Indices, click the "audit_log" index, and hit the orange refresh button at the top of the screen.*
Testing
Perform some gets and puts to each of the resource servers. Verify that the data in the dashboard is updated.
Testing