Big Data Zombies
Escenario*
250K drones con cámaras infrarrojas
Detectan infección por temperatura
Envían una lectura cada segundo
Resolución máxima: 1000 zombies

*Cada drone cubre unos 4Km cuadrados
Formato
{
"drone-id" : 1000000,
"timestamp" : "2016-01-01T10:22:00",
"latitude" : 42.0343,
"longitude" : 2.40324
}

Amazon Kinesis
Servicio de ingesta manejado
Capacidad ilimitada y escalable
Unidad de ingesta: Shard


Registros
Número de secuencia +
Clave de partición +
Blob de datos

Shards
Unidad de escritura: 25K
1000 registros por segundo
Máximo 1MB por segundo

Do the maths
250.000 registros/s
1.000 registros/shards + 10%
275 shards

Show me the money
$0.015 shard/h
$0.014 por millón de puts
$2970 + $9072 al mes*

*podemos escalar hacia abajo si vamos justos de prespuesto
La pregunta es clave
¿Qué queremos hacer?
Visualizar puntos calientes

Latitud y Longitud vs UTM
Lat Lng representa un punto 3D
Los mapas son 2D
UTM es la proyección + popular
¡Además facilita la agregación!

Ejemplo
41.390205N 2.154007E
31N 429271E 4582420N
31N 429 4582 <-1Km^2
31N 42 458 <- 100Km^2

UTM 1km como clave de shard
Correctamente distribuído
Permite agrupar por km^2

El kit de desarrollo de Kinesis
AWS Mobile SDK
Kinesis Agent (utilidad java)
Kinesis Producer library (c++)
KPL java wrapper
Kinesis Client Library (java)
KCL daemon (utilidad java)
Kinesis producer library (KPL)
ObjectMapper mapper = new ObjectMapper();

KinesisProducer kinesis = new KinesisProducer();
while(true) {

    ZombieLecture lect = nextLecture();

    LatLng latLng = lect.getCoordinates();

    UTM utm = Projections.toUTM(latLng);

    String shardKey = utm.asString(1000 /*meters*/);

    String json = mapper.writeValueAsString(lect);

    ByteBuffer data =

         ByteBuffer.wrap(json.getBytes("UTF-8"));

    kinesis.addUserRecord("zombieStream", shardKey, data);

}
Kinesis Client Llibrary (KCL)
// iterator to iterate *inside* a shard

shardIterator = getShardIteratorResult.getShardIterator();

List<Record> records;

while (true) {

  GetRecordsRequest recRequest = new GetRecordsRequest();

  recRequest .setShardIterator(shardIterator);

  recRequest .setLimit(25);
  GetRecordsResult result = client.getRecords(recRequest );

  records = result.getRecords();

  this.processRecords(records);

  shardIterator = result.getNextShardIterator();

}
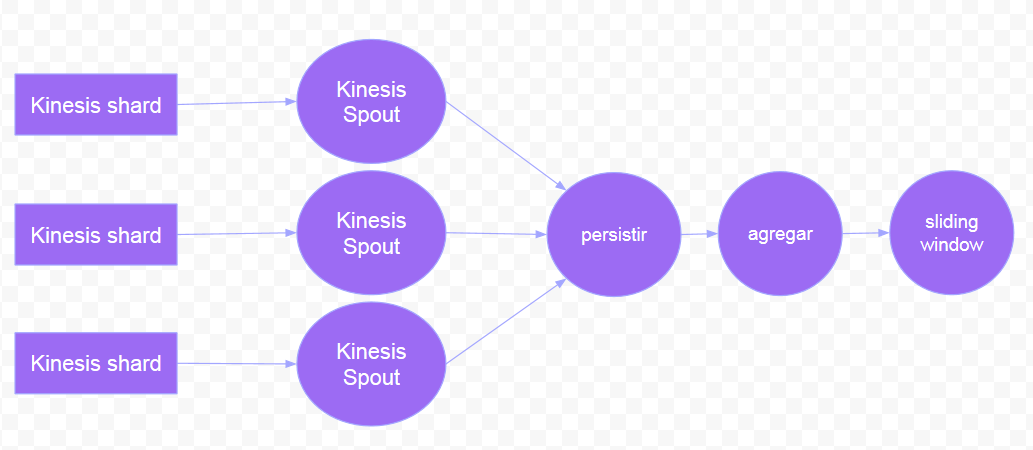
Apache Storm
Procesamiento en tiempo real
Basado en topografías
Kinesis Storm Spout como origen
Bolts para agregar y almacenar

Integración
Visualización con Leafletjs
Librería ligera para mapas
Funciona en móviles
Excelente API
Dispone de decenas de plugins
Permite dibujar heatmaps

Código de ejemplo
var map = L.map('map')
  .setView([41.3902, 2.15400], 13);

L.tileLayer('http://{s}.tile.osm.org'+
            '/{z}/{x}/{y}.png', {})
  .addTo(map);
$.ajax(...)
 .done(function(points) {
    var heat = L.heatLayer(points)
                .addTo(map);
});