Spreadsheet Sorcery
maptimeLEX | November 18, 2015
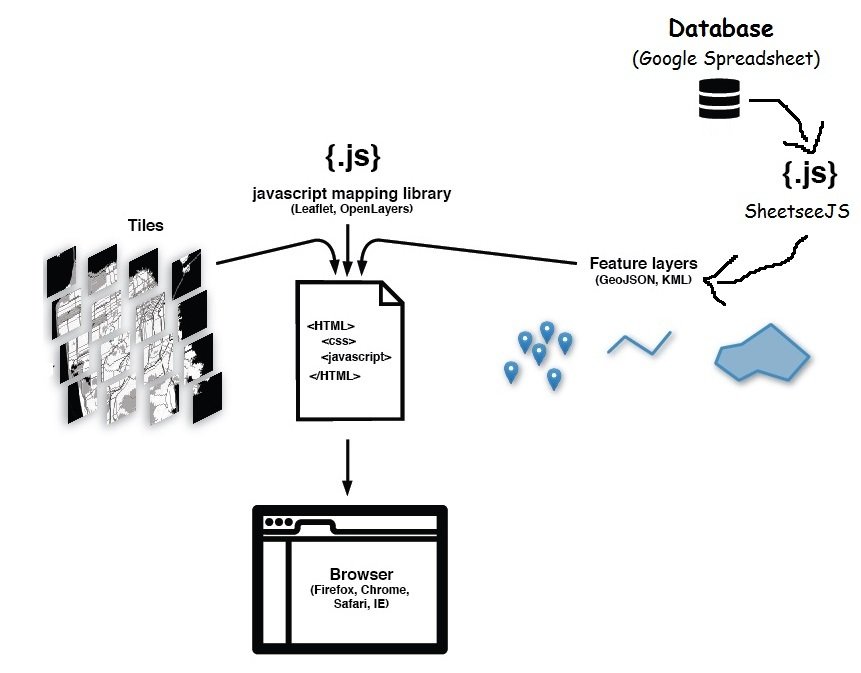
What are we doing?
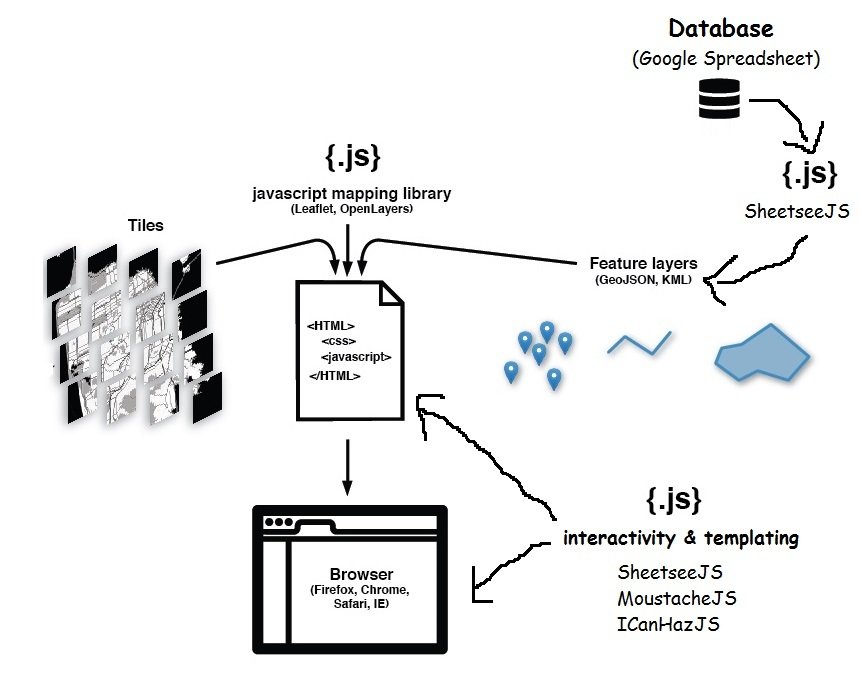
- Load data from a Google Spreadsheet (SheetseeJS)
- Transform that data into GeoJSON (SheeetseeJS)
- Map the data (mapboxJS/LeafletJS)
- Create a table of from our Google Spreadsheet data (SheetseeJS)
- Add some interactivity driven by our data (SheetseeJS, MoustacheJS, ICanHazJS)
Final Map
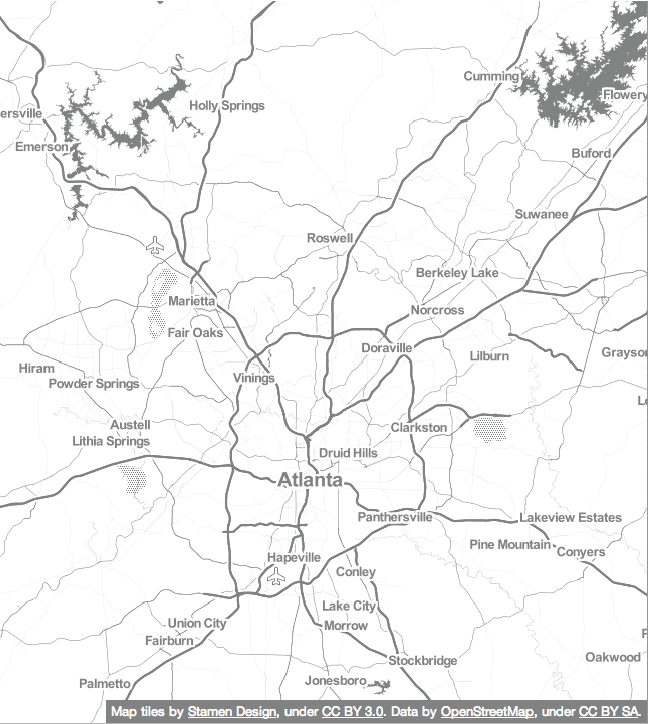
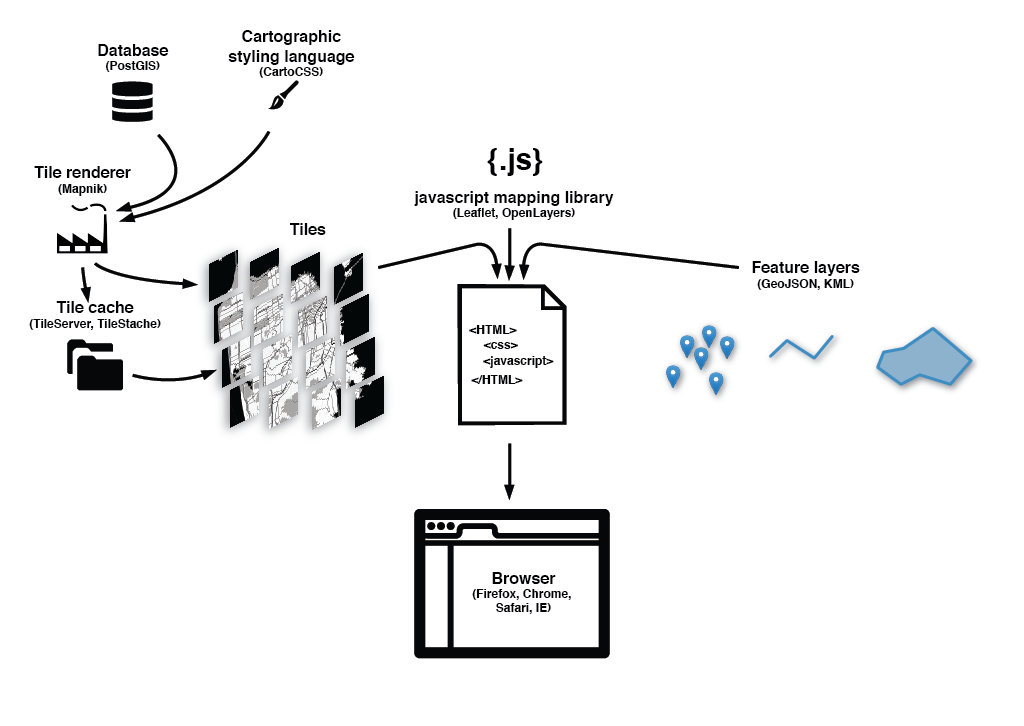
A brief refresher
Webmap have:
Webmap have:
Basemap, tile layer, base layer, reference layer, etc.
Webmap have:
Feature data, feature layer, data layer, etc.
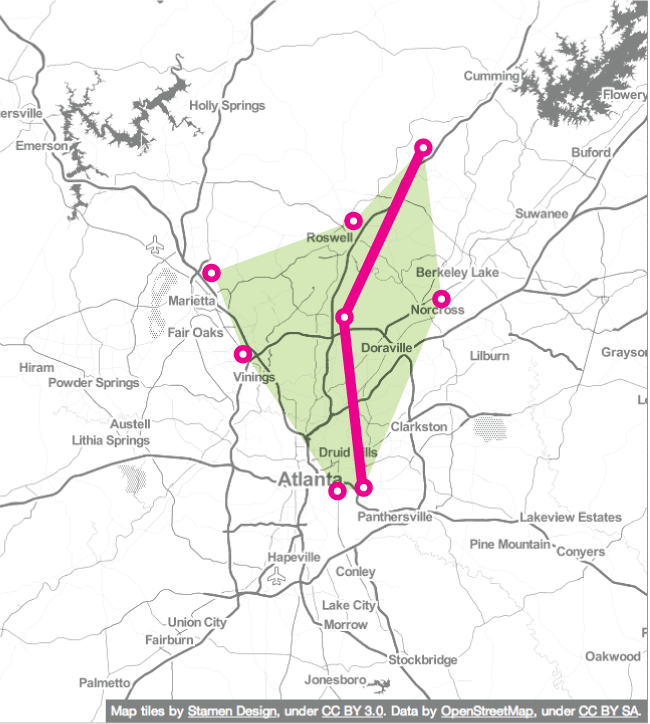
Which come together...
Let's make this map!
What you'll need
- Text editor (Sublime, Notepad++, Komodo, etc)
- Something to run a local web server
- Python's SimpleHTTPServer
- Starter files
- github.com/maptimelex/spreadsheet-sorcery
- Download .zip
- Extract
- Copy & Paste starter folder somewhere you'll remember
Backend
Map
Interaction
Backend
Map
Interaction
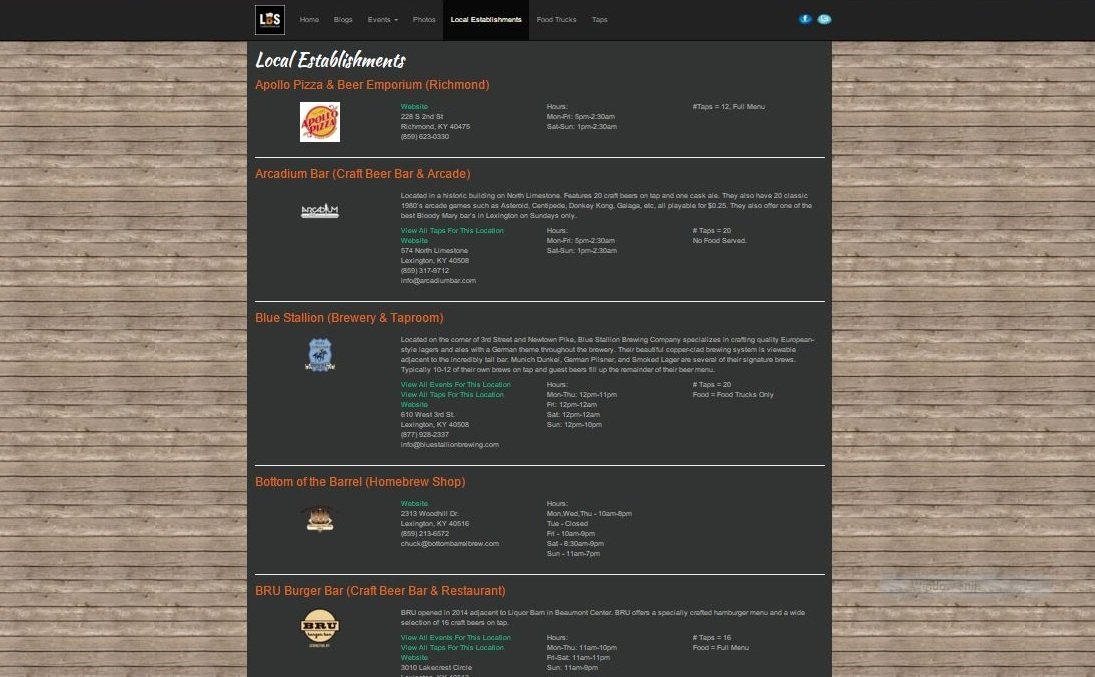
Data Source: LexBeerScene.com/localestablishments
Data
Geocode Addresses
function geocodeSelectedCells() {
  var sheet = SpreadsheetApp.getActiveSheet();
  var cells = sheet.getActiveRange();

  // Must have selected 3 columns (Location, Lat, Lng).
  // Must have selected at least 1 row.

  if (cells.getNumColumns() != 3) {
    Logger.log("Must select the Location, Lat, Lng columns.");
    return;
  }

  var addressColumn = 1;
  var addressRow;

  var latColumn = addressColumn + 1;
  var lngColumn = addressColumn + 2;

  var geocoder = Maps.newGeocoder();
  var location;

  for (addressRow = 1; addressRow <= cells.getNumRows(); ++addressRow) {
    address = cells.getCell(addressRow, addressColumn).getValue();

    // Geocode the address and plug the lat, lng pair into the
    // 2nd and 3rd elements of the current range row.
    location = geocoder.geocode(address);

    // Only change cells if geocoder seems to have gotten a
    // valid response.
    if (location.status == 'OK') {
      lat = location["results"][0]["geometry"]["location"]["lat"];
      lng = location["results"][0]["geometry"]["location"]["lng"];

      cells.getCell(addressRow, latColumn).setValue(lat);
      cells.getCell(addressRow, lngColumn).setValue(lng);
    }
  }
};

/**
* Adds a custom menu to the active spreadsheet, containing a single menu item.
*
* The onOpen() function, when defined, is automatically invoked whenever the
* spreadsheet is opened.
*
* For more information on using the Spreadsheet API, see
* https://developers.google.com/apps-script/service_spreadsheet
*/
function onOpen() {
  var sheet = SpreadsheetApp.getActiveSpreadsheet();
  var entries = [{
    name: "Geocode Selected Cells Worldwide",
    functionName: "geocodeSelectedCells"
  }];
  sheet.addMenu("Macros", entries);
};Geocoded data!
python -m SimpleHTTPServer
Start local web server
- Open Terminal (OSX/Linux) or Command Prompt (Windows)
- Navigate to directory you'll be working in
- In the browser
- That's where you'll be able to access your map locally!
http://localhost:8000/
Backend
Map
Interaction
What's in the starter folder?
- /js
- sheetsee.js
- tabletop1.3.4.js
- jquery.js (optional)
- /css
- site.css
- /img
- beer.png
- beer.svg
- index.html
<html>
<head>
<!-- Meta -->
<title>Lexington Beer Establishments</title>
<meta charset='utf-8'>
<meta name="viewport" content="width=device-width, initial-scale=1.0"/>
</head>
<body>
<!-- Main HTML structure -->
<div id="wrapper">
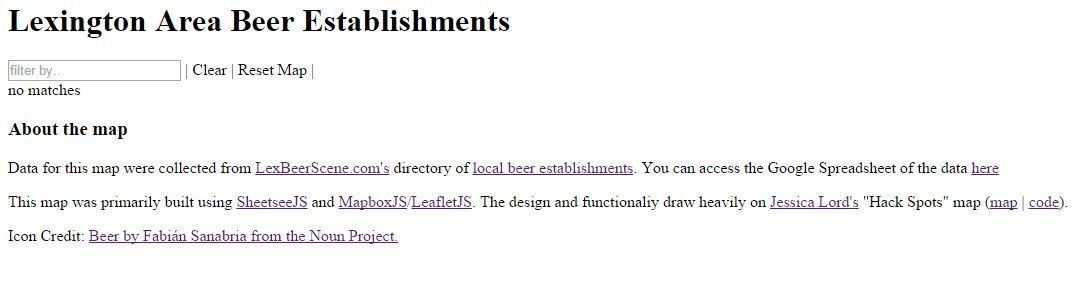
<h1>Lexington Area Beer Establishments</h1>
<div class="container">
<div id="infoPane">
<div id="selectedBeer"></div>
</div>
<div id="map"></div>
</div>
<div class="container">
<input id="tableFilter" type="text" placeholder="filter by.."></input>
| <span class="clear">Clear</span> | <span class="resetMap">Reset Map</span> |
<br>
<span class="noMatches">no matches</span>
<div id="beerTable"></div>
</div>
<div id="info" class="container">
<h3>About the map</h3>
<p>Data for this map were collected from <a href="http://www.lexbeerscene.com/" target="_blank">LexBeerScene.com's</a> directory of <a href="http://www.lexbeerscene.com/localestablishments" target="_blank">local beer establishments</a>. You can access the Google Spreadsheet of the data <a href="https://docs.google.com/spreadsheets/d/13Xd93PIiGvGh2JQ6uygnsUTTLAlJu7F7TE-doTy-5OY/edit#gid=1993162178" target="_blank">here</a></p>
<p>This map was primarily built using <a href="http://jlord.us/sheetsee.js/" target="_blank">SheetseeJS</a> and <a href="https://www.mapbox.com/mapbox.js/api/v2.2.3/" target="_blank">MapboxJS</a>/<a href="http://leafletjs.com/" target="_blank">LeafletJS</a>. The design and functionaliy draw heavily on <a href="https://twitter.com/jllord" target="_blank">Jessica Lord's</a> "Hack Spots" map (<a href="http://jlord.us/hack-spots/" target="_blank">map</a> | <a href="https://github.com/jlord/hack-spots" target="_blank">code</a>).</p>
<p>Icon Credit: <a href="https://thenounproject.com/search/?q=beer&i=124636" target="_blank">Beer by Fabián Sanabria from the Noun Project.</a></p>
</div>
</div><!-- end wrapper -->
</body>
</html>
index.html
index.html
Add stylesheets
<head>
<!-- Meta -->
<title>Lexington Beer Establishments</title>
<meta charset='utf-8'>
<meta name="viewport" content="width=device-width, initial-scale=1.0"/>
<!-- Add before closing head tag (</head>)-->
<link href='https://api.tiles.mapbox.com/mapbox.js/v1.4.0/mapbox.css' rel='stylesheet' />
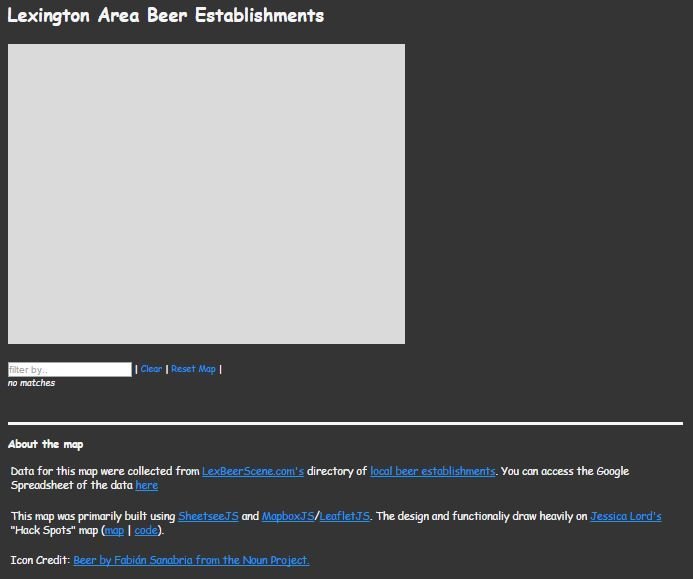
<link media="screen" rel="stylesheet" type="text/css" href="css/site.css">
</head>site.css added!
Add JS Libraries
<body>
<!--Site HTML-->
<!-- Add JS libraries just before the closing body tag (</body> -->
    <script src="https://ajax.googleapis.com/ajax/libs/jquery/2.1.4/jquery.min.js"></script>
    <script type="text/javascript" src='js/tabletop1.3.4.js'></script>
    <script type="text/javascript" src='js/sheetsee.js'></script>
</body>
Create app.js
in /js
app.js
document.addEventListener('DOMContentLoaded', function() {
    var gData
    // Spreadsheet ID
    var URL = "13Xd93PIiGvGh2JQ6uygnsUTTLAlJu7F7TE-doTy-5OY"
    Tabletop.init({
        key: URL,
        callback: showInfo,
        simpleSheet: true
    })
})

function showInfo(gData) {
    // We'll fill this function with our map and interactivity
}
Create map
- in app.js
- basemap only
 // Setup map, specifying the id of the div where the map will be located
var map = Sheetsee.loadMap("map")
// Add a basemap. We can set that with plain Leaflet
var stamenToner = L.tileLayer('http://stamen-tiles-{s}.a.ssl.fastly.net/toner/{z}/{x}/{y}.png', {
    attribution: 'Map tiles by <a href="http://stamen.com">Stamen Design</a>, <a href="http://creativecommons.org/licenses/by/3.0">CC BY 3.0</a> — Map data © <a href="http://www.openstreetmap.org/copyright">OpenStreetMap</a>'
}).addTo(map);