D3 Layouts
{warm-up // color-scales}
Ordinal color scales
Define your scale
Has a pre-defined range
Dynamically sets domain
var colorScale = d3.scale.category10()colorScale('item 1') // returns first color #1f77b4
colorScale('item 2') // returns second color #ff7f0e
{d3-layouts}
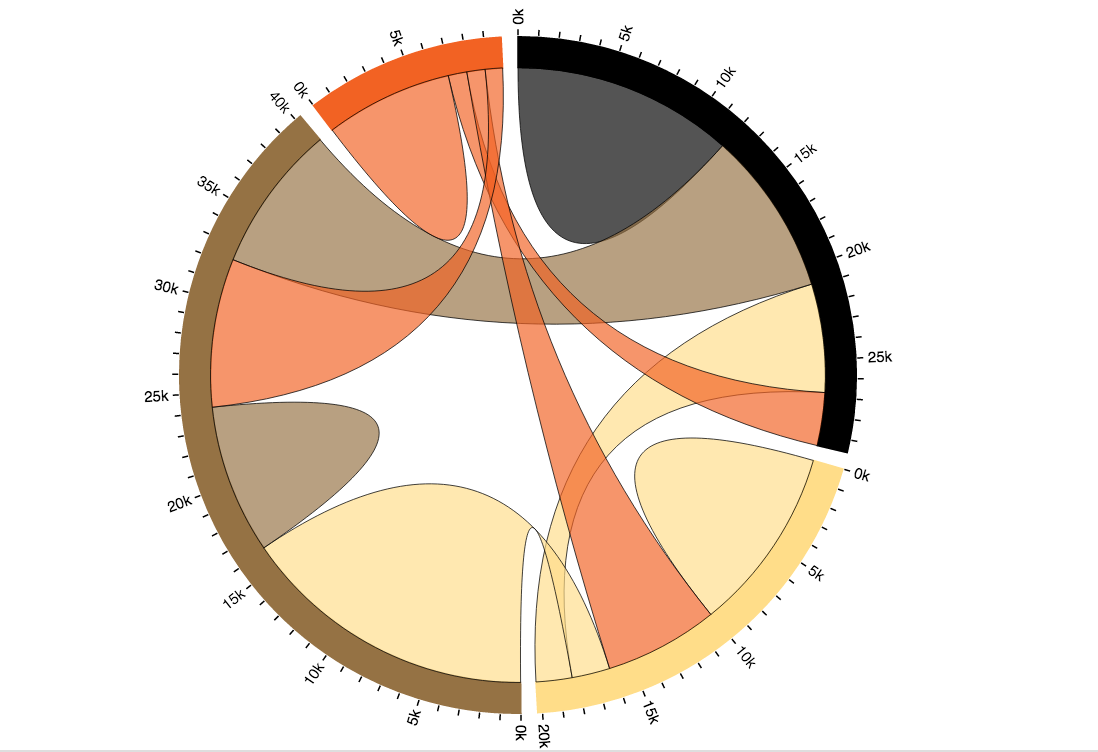
All these do is change your data
// initial data
[
{le_1960:45, le_2013:65},
{le_1960:55}, le_2013:75}
]
/* Do some layout stuff */
// Data after layout
[
{le_1960:45, le_2013:65, x:0, y:0, width:100, height:200},
{le_1960:55}, le_2013:75, x:10, y:0, width:200, height:300}
]
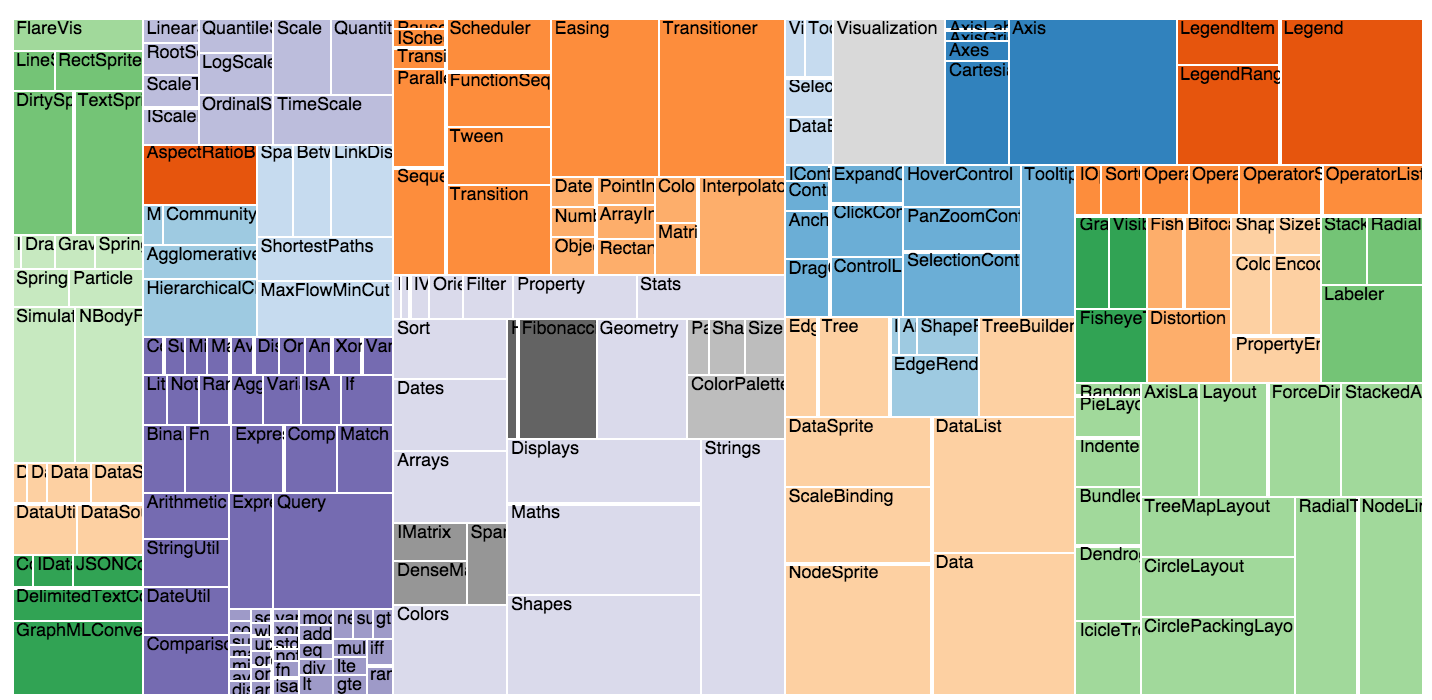
/* Do whatever you want with the changed data */{circle-packing}
The data
// Nested data
var data = {
    name:'all',
    children:[
        {
            name:'group 1', children: [
                {name:'obs 1', size:1000},
                {name:'obs 2', size:2000}
            ]
        }
        {
            name:'group 2', children: [
                {name:'obs 1', size:3000},
                {name:'obs 2', size:4000}
            ]
        }
    ],
}
The Layout Function
// Simpler data
var data = {
    children:[
        {name:'obs 1', size:1000},
        {name:'obs 2', size:2000},
        {name:'obs 3', size:500},
    ]
}
// Layout function
var layout = d3.layout.pack()
     .size([500, 500]) // size of space
     .value(function(d){return d.size}) // choose property


// This will manipulate your data, and return the array you want
layout.nodes(data)
Today's challenge
Today's challenge
Getting started
Fork my repo
Clone in desktop
Start local server
cd "Desktop/firebase-demo"
python -m SimpleHTTPServer 8080
If you've cloned firebase-demo
If you haven't
# Clone YOUR repo
git clone github.com/USERNAME/firebase-demo

# Set an upstream remote (where it came from)
git remote add upstream github.com/mkfreeman/firebase-demo.git

# Get any upstream changes
git fetch upstream

# Make sure you're on master branch
git checkout master

# Reset your branch to the upstream: discards uncommitted changes
git reset --hard upstream/master
Change reference to your firebase
main.js
// Create a variable 'ref' to reference your firebase storage
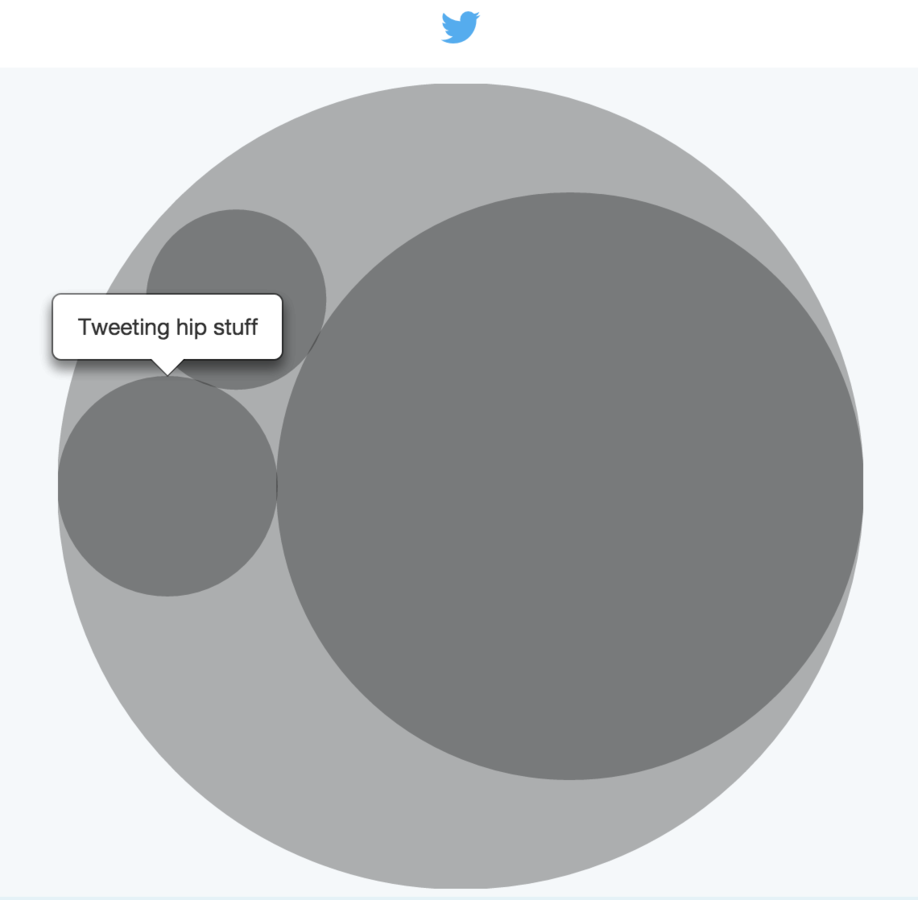
var ref = new Firebase('https://twitter-demo.firebaseio.com/');Add your bubble chart!
Create a directive in JavaScript
Bind the directive in HTML
Pass in your tweets as data
Build your re-usable draw() function
Hints
Check out our last d3 + angular activity
Watch your $firebaseArray directly
Pass a copy of your data to your layout function
/* Inside your directive */
// Use scope.data.$watch to watch for firebase array changes
scope.data.$watch(function(d) {
    // re-draw your graph!
})
// Create data to bind to your selection of circles
scope.bubbleData = bubble.nodes({children:angular.copy(scope.data)});Advanced
Define <pattern> tags for your image fill (example)
 <defs>
    <!-- pattern1 -->
    <pattern id="pattern1" height="100%" width="100%" patternContentUnits="objectBoundingBox">
        <image height="1" width="1" preserveAspectRatio="none" xlink:href="url/to/img.pns" />
    </pattern>
 </defs>
You can do this dynamically in D3 (in your draw function)
You'll need to pass in some more data to your directive...
// Track when tweets are actually loaded in your controller
$scope.tweets.$loaded(function(d){
   $scope.loaded += 1;
})