Using QGIS to create Shapes for Tableau
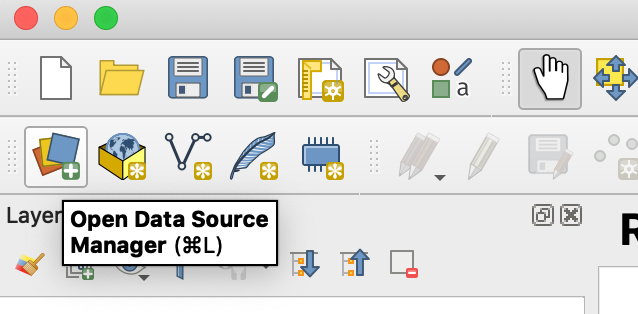
To add a background map to QGIS, select the "Open Data Source Manager"
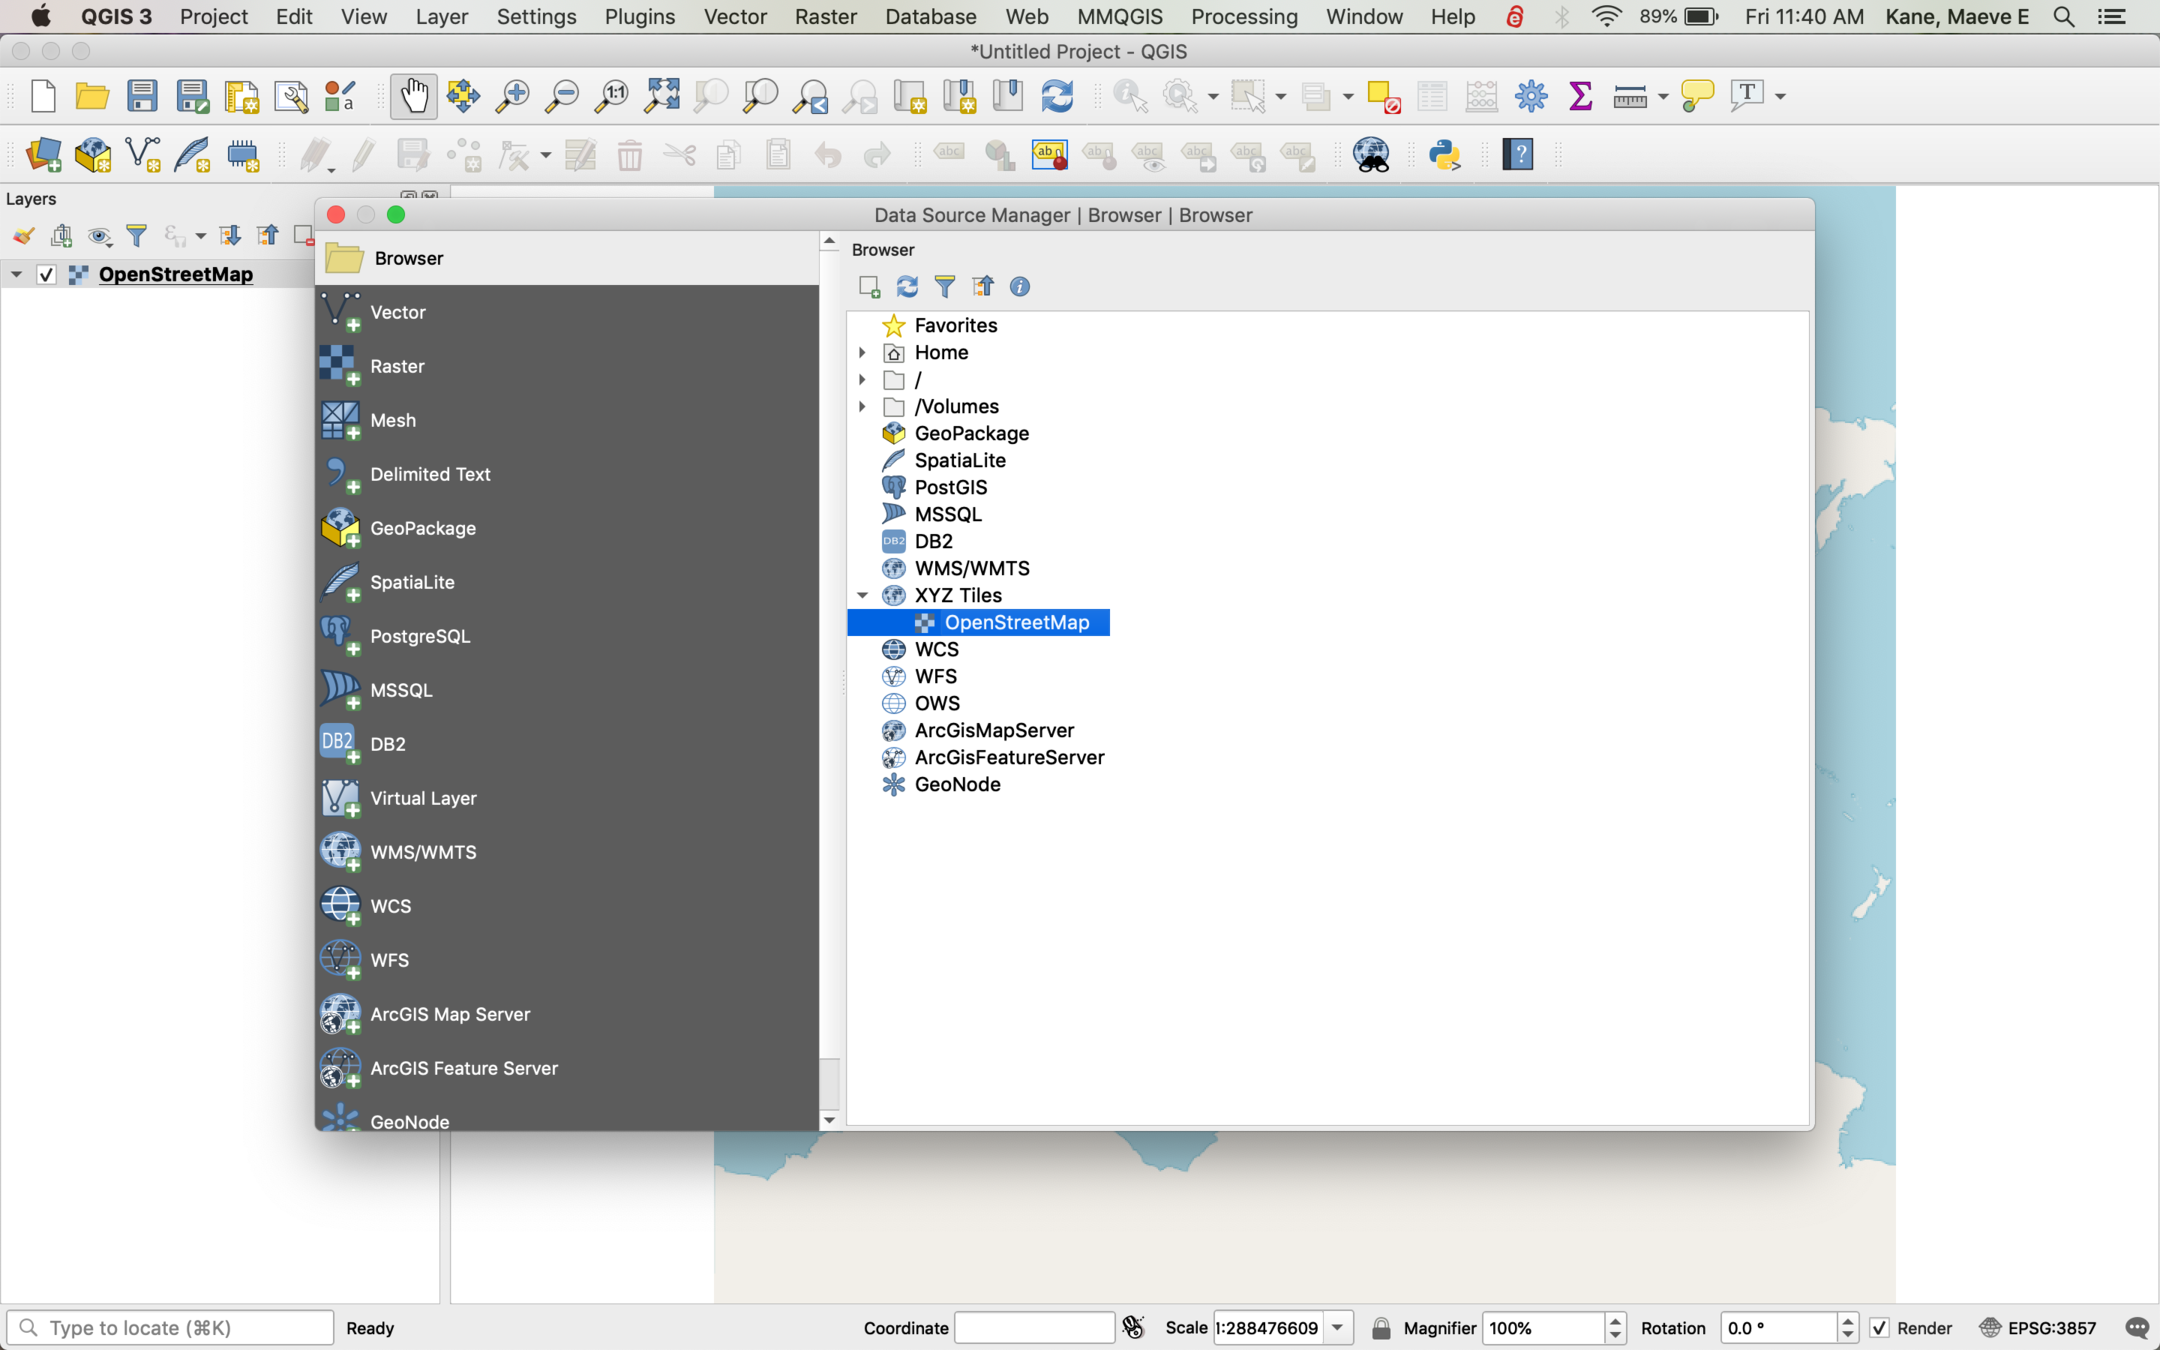
Expand XYZ Tiles and select OpenStreetMap
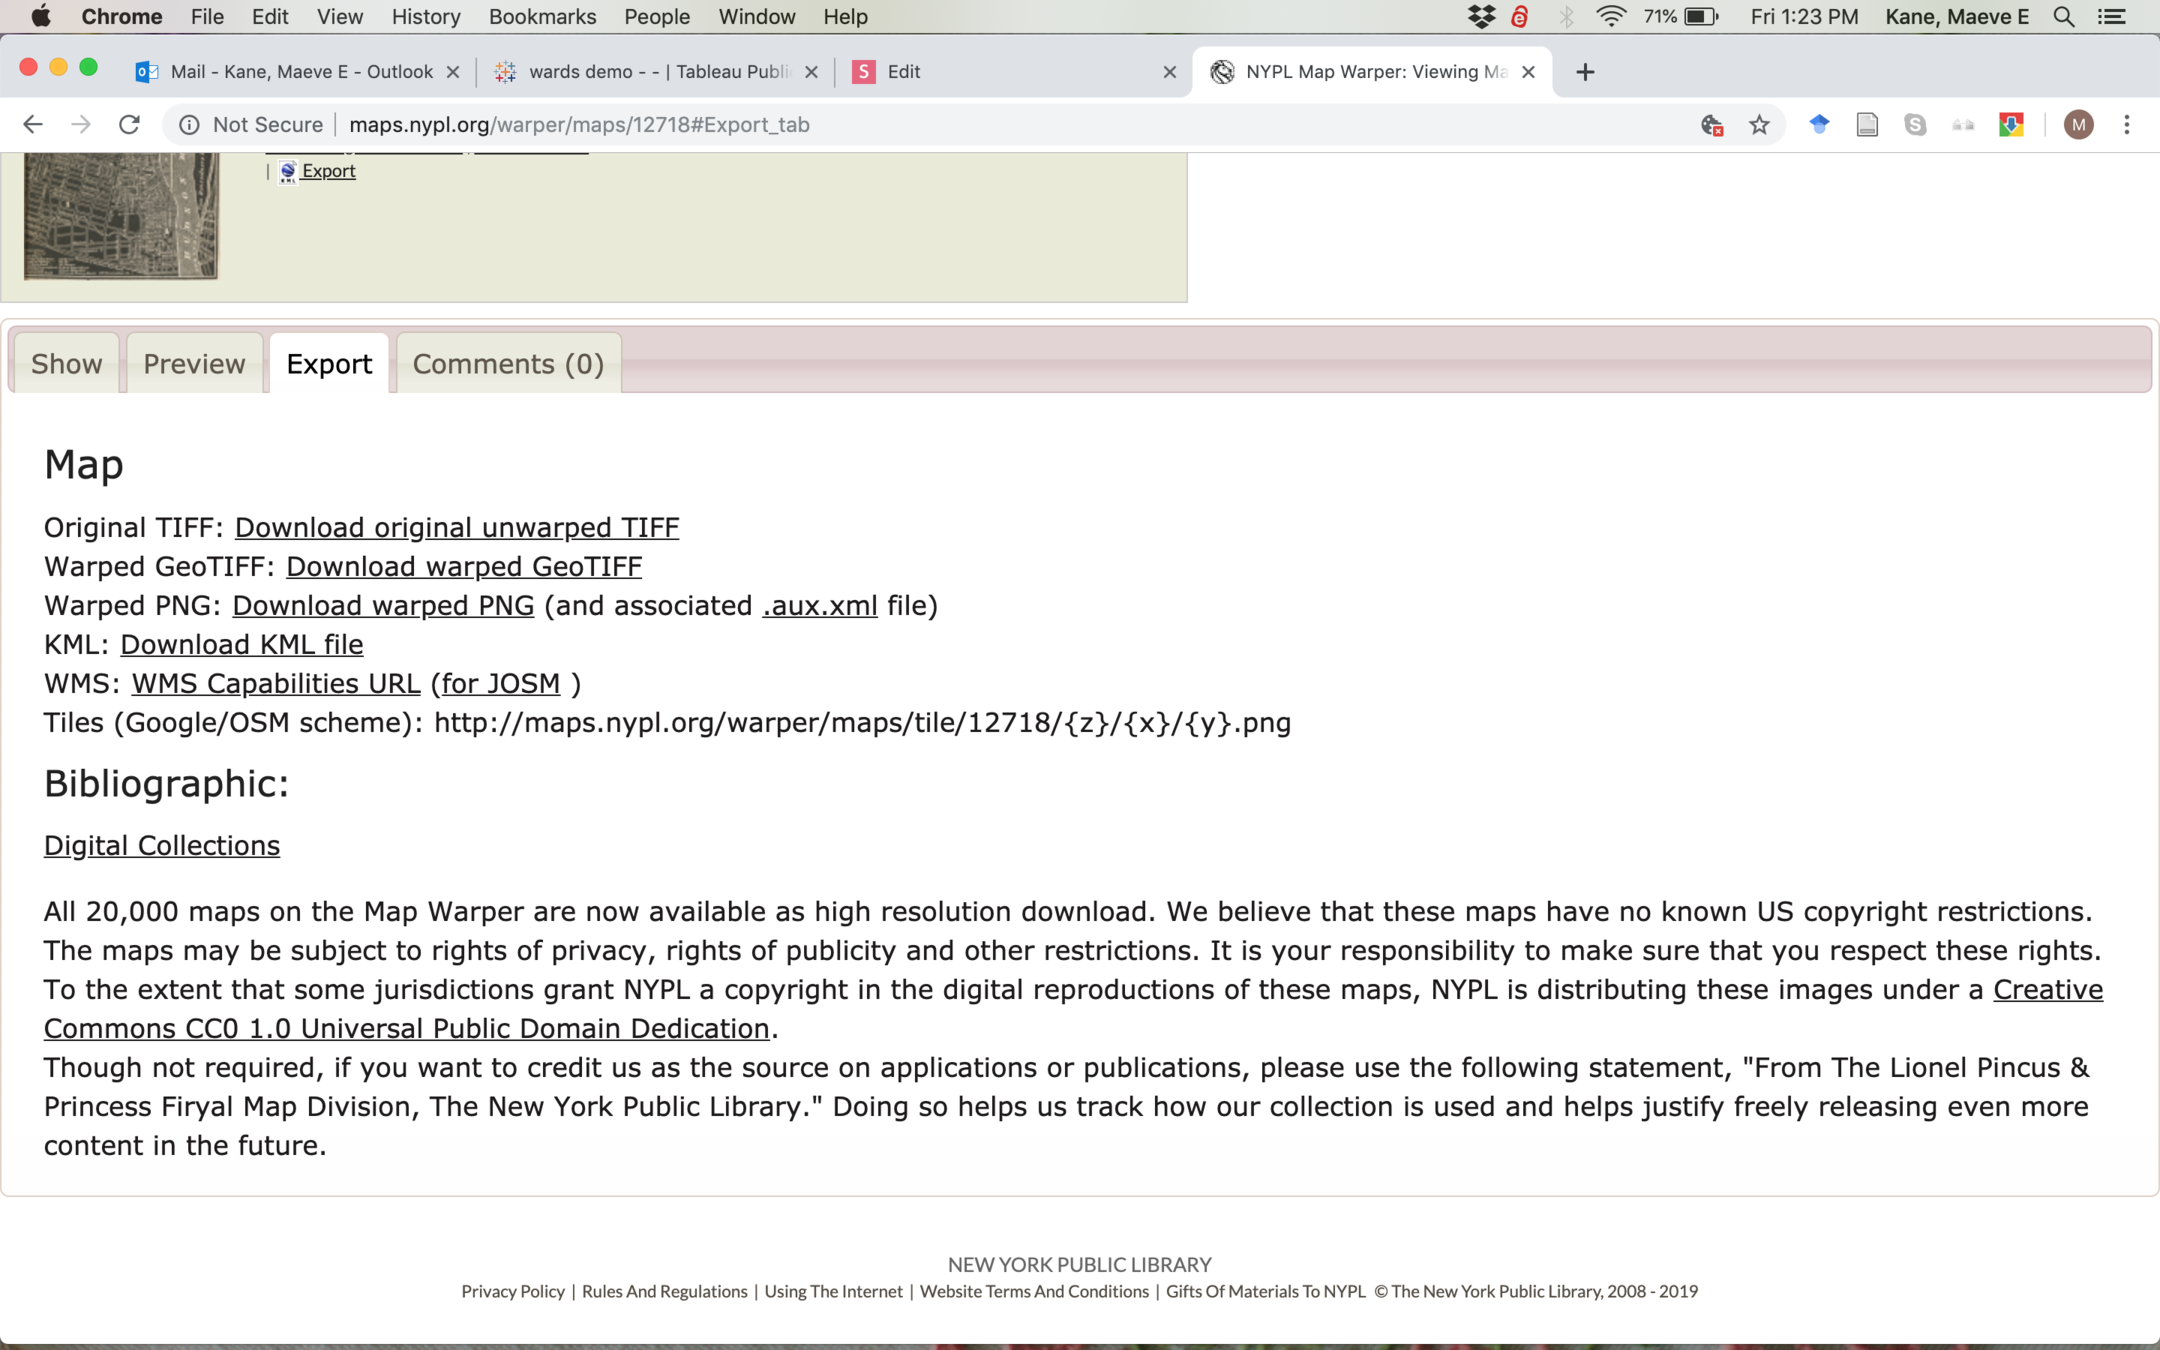
To add a rectified map from MapWarper, select the Export tab and Download warped GeoTIFF, which is an image file warped to the correct geographic dimensions
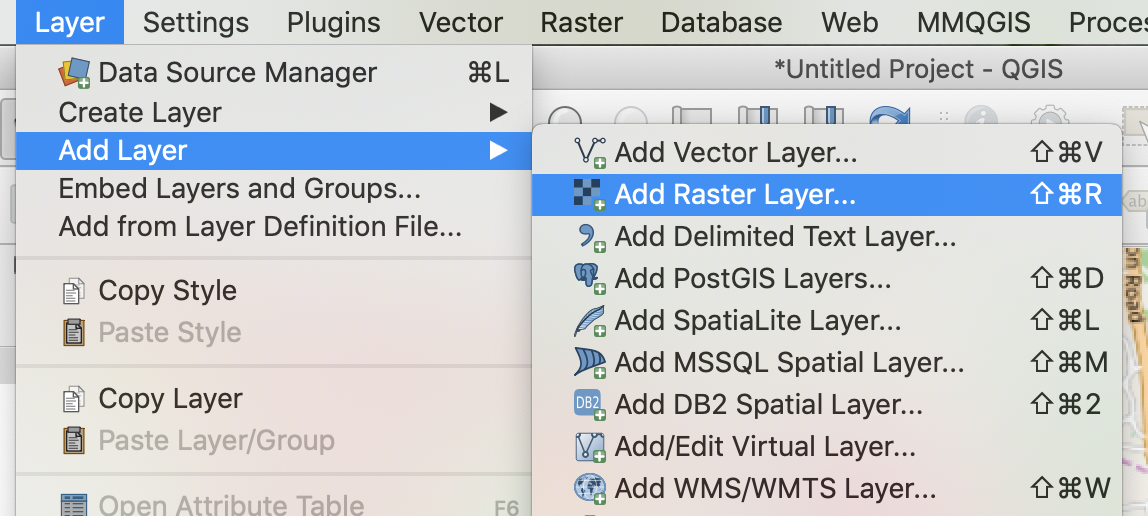
Add this image to QGIS by selecting Layer > Add Layer > Add Raster Layer
A raster layer is an image-file format layer. A vector layer is a mathematical format, and delimited text is a text file like a csv
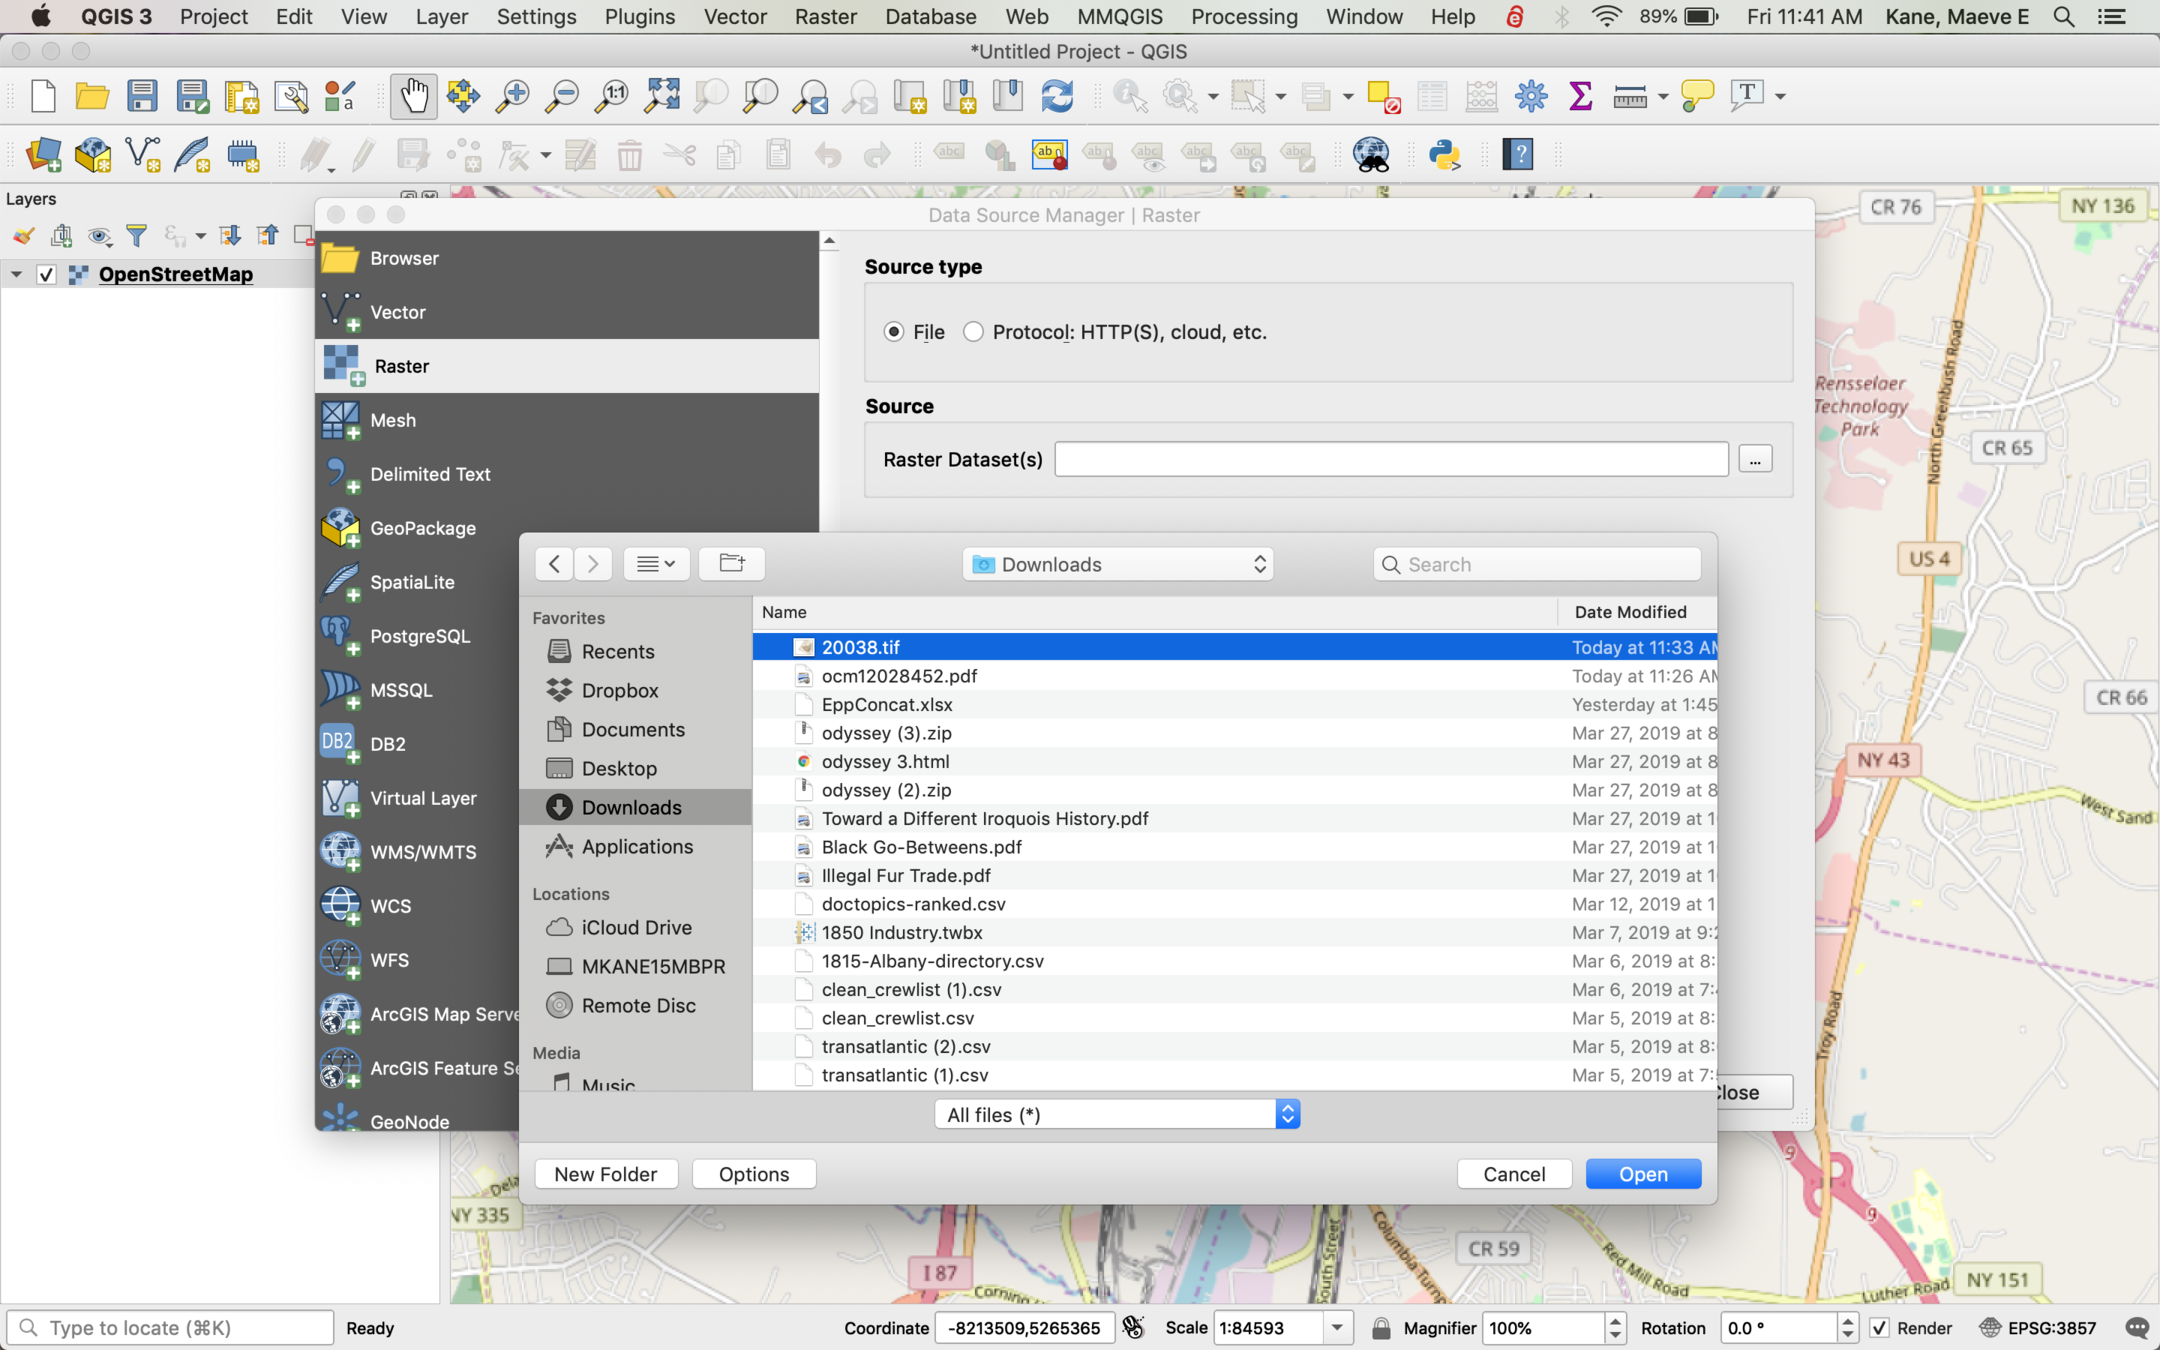
In the browser popup, select the file you just downloaded from MapWarper
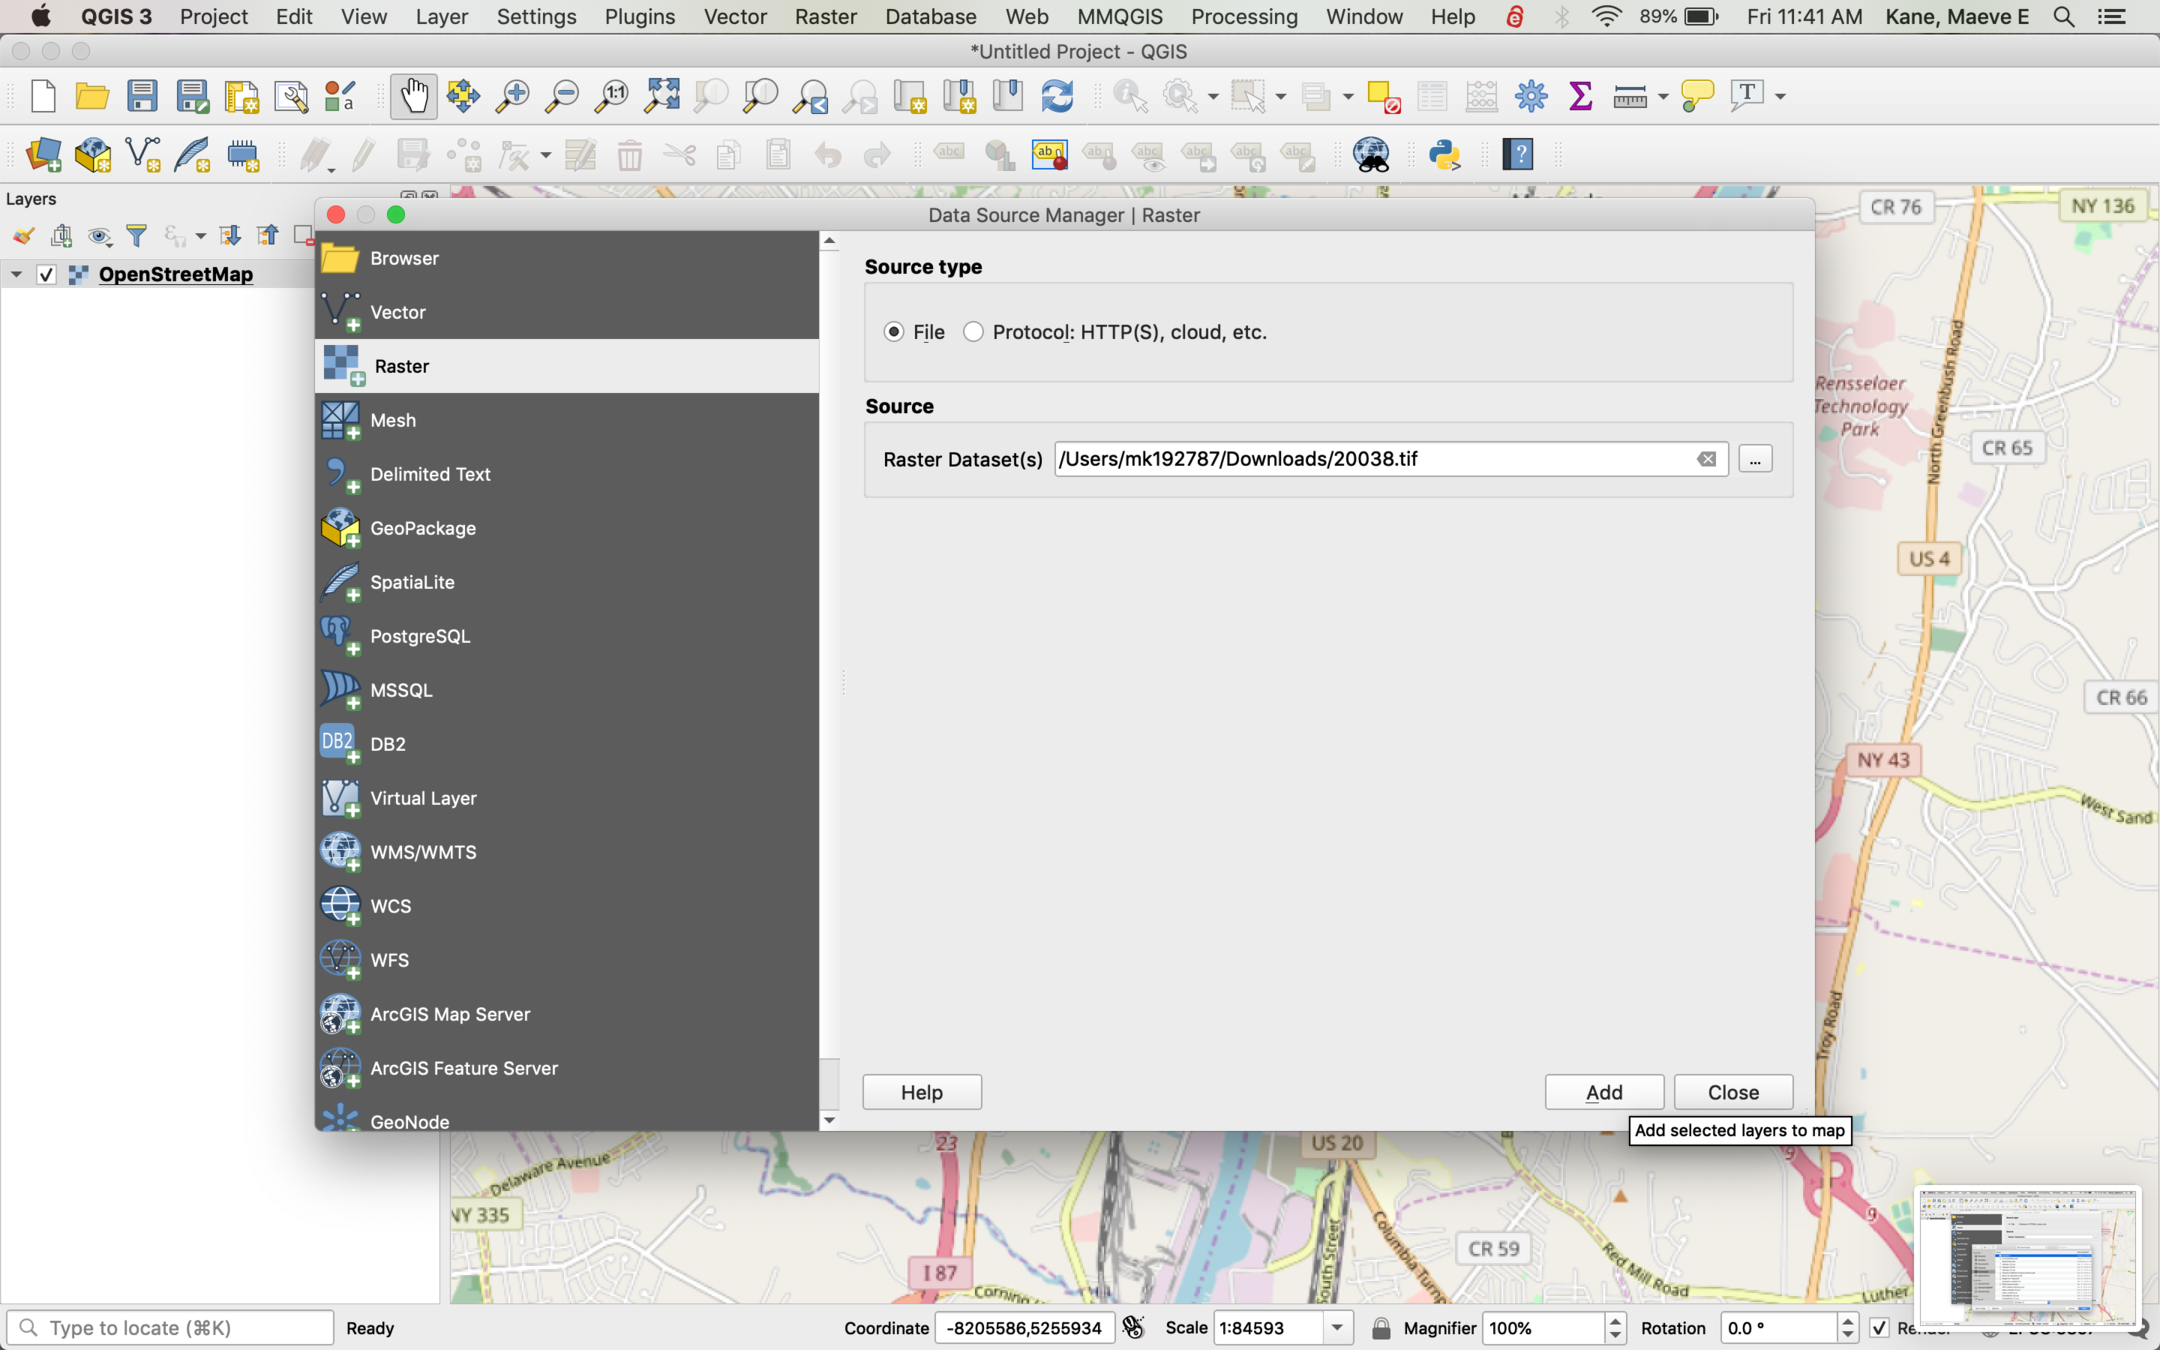
Click Add once! The box will not close on its own, and clicking more than once will add the map multiple times!
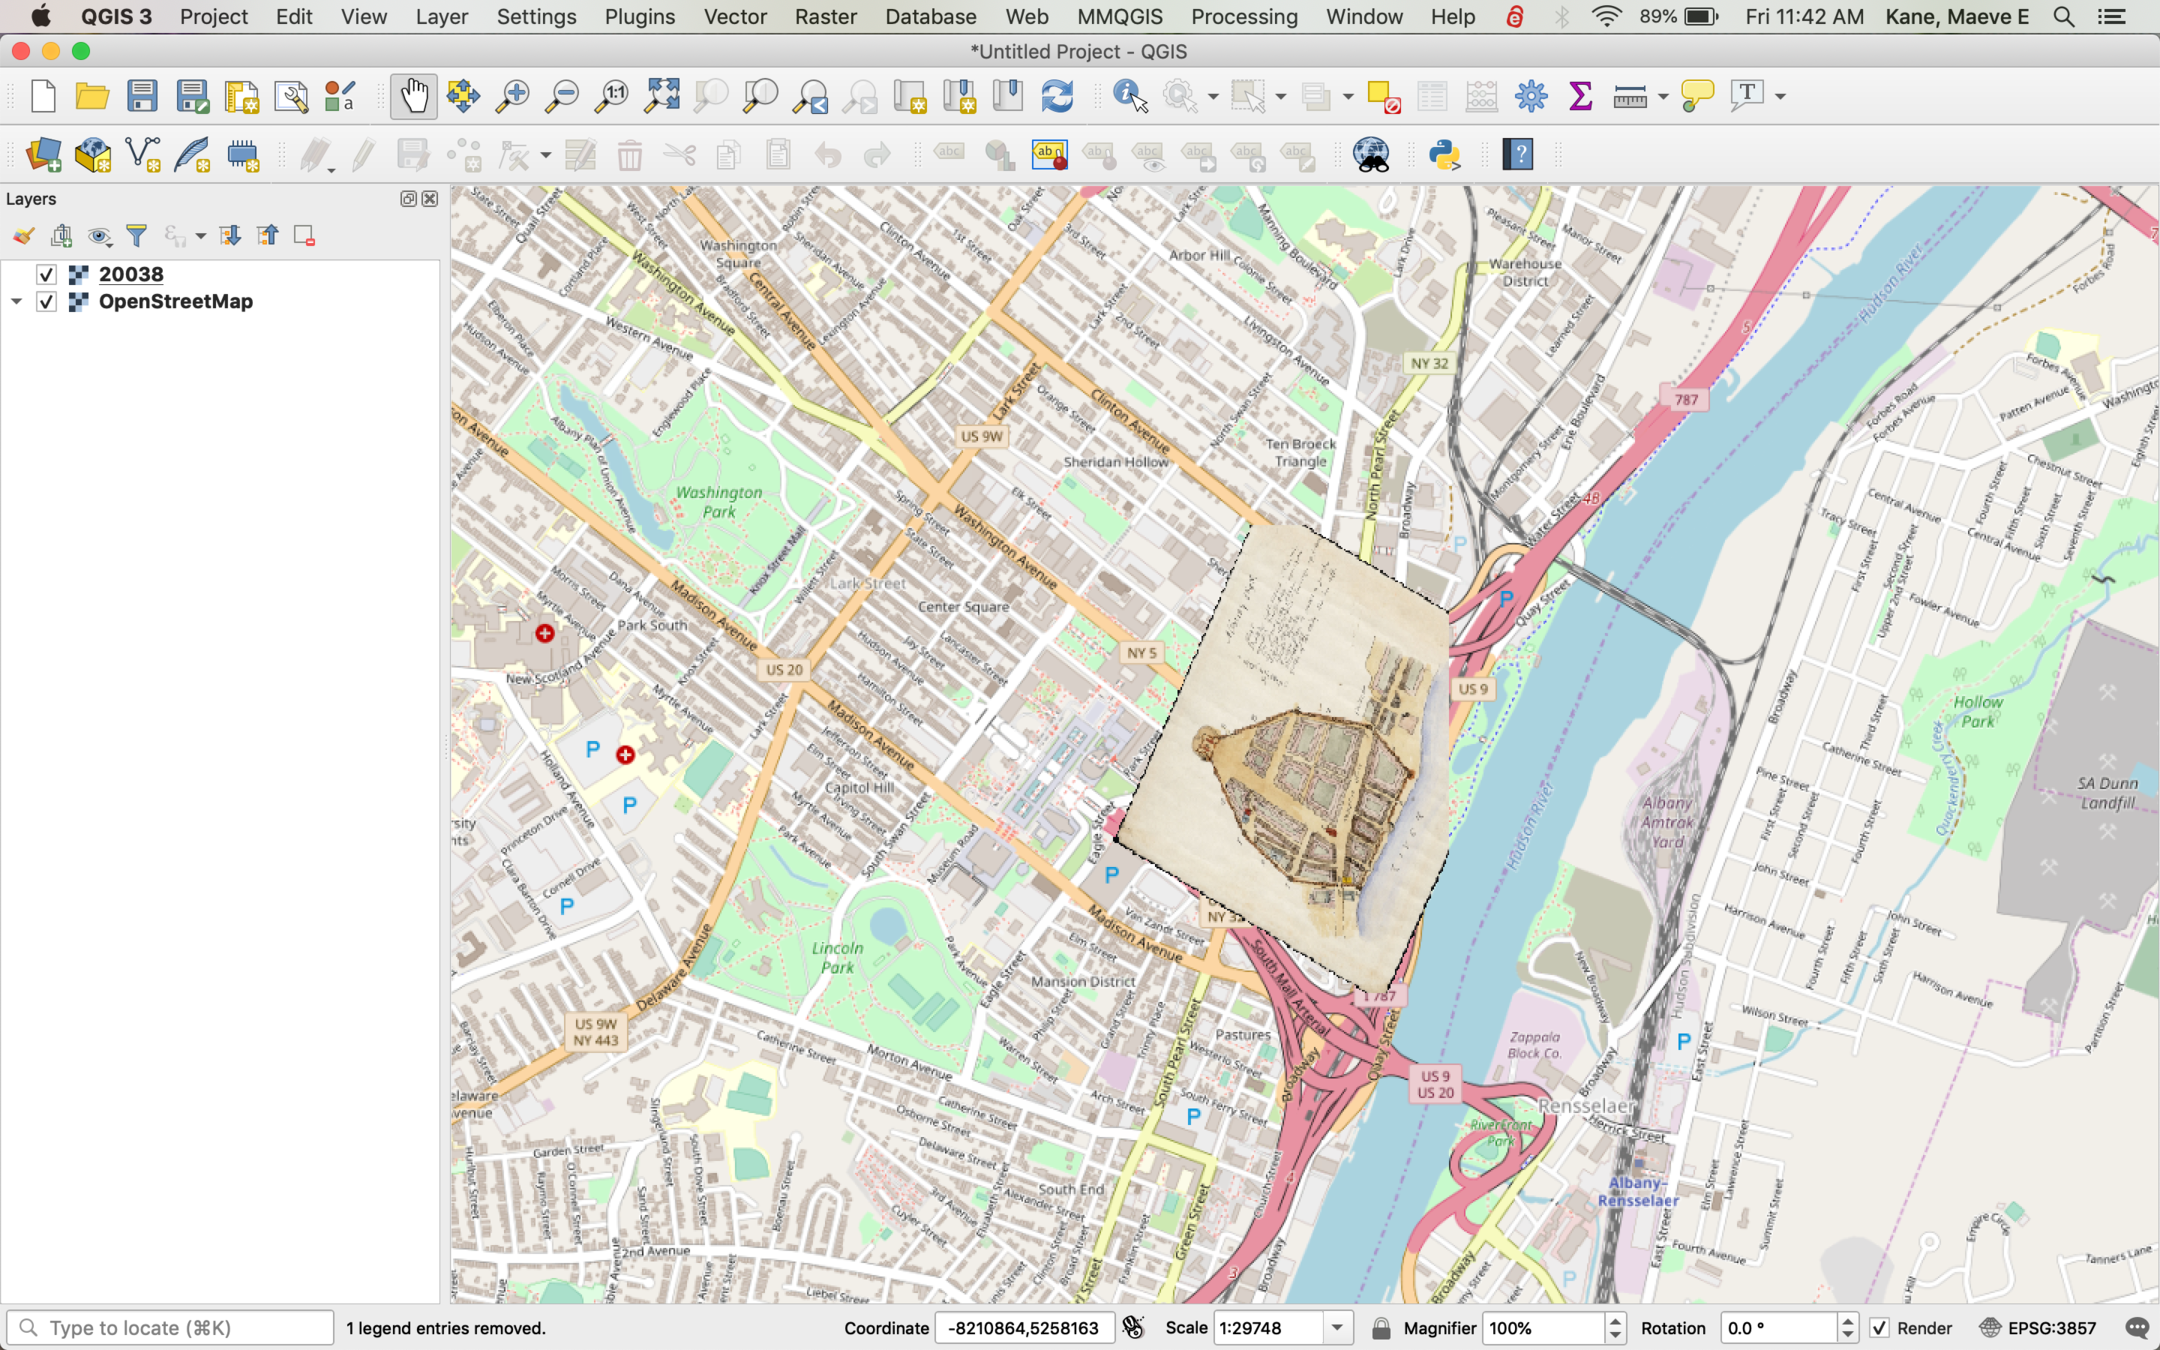
The rectified map should now appear as an overlay on top of your base map. By right-clicking the map in the layers pane to the left, you can rename it or zoom to layer if you lose it.
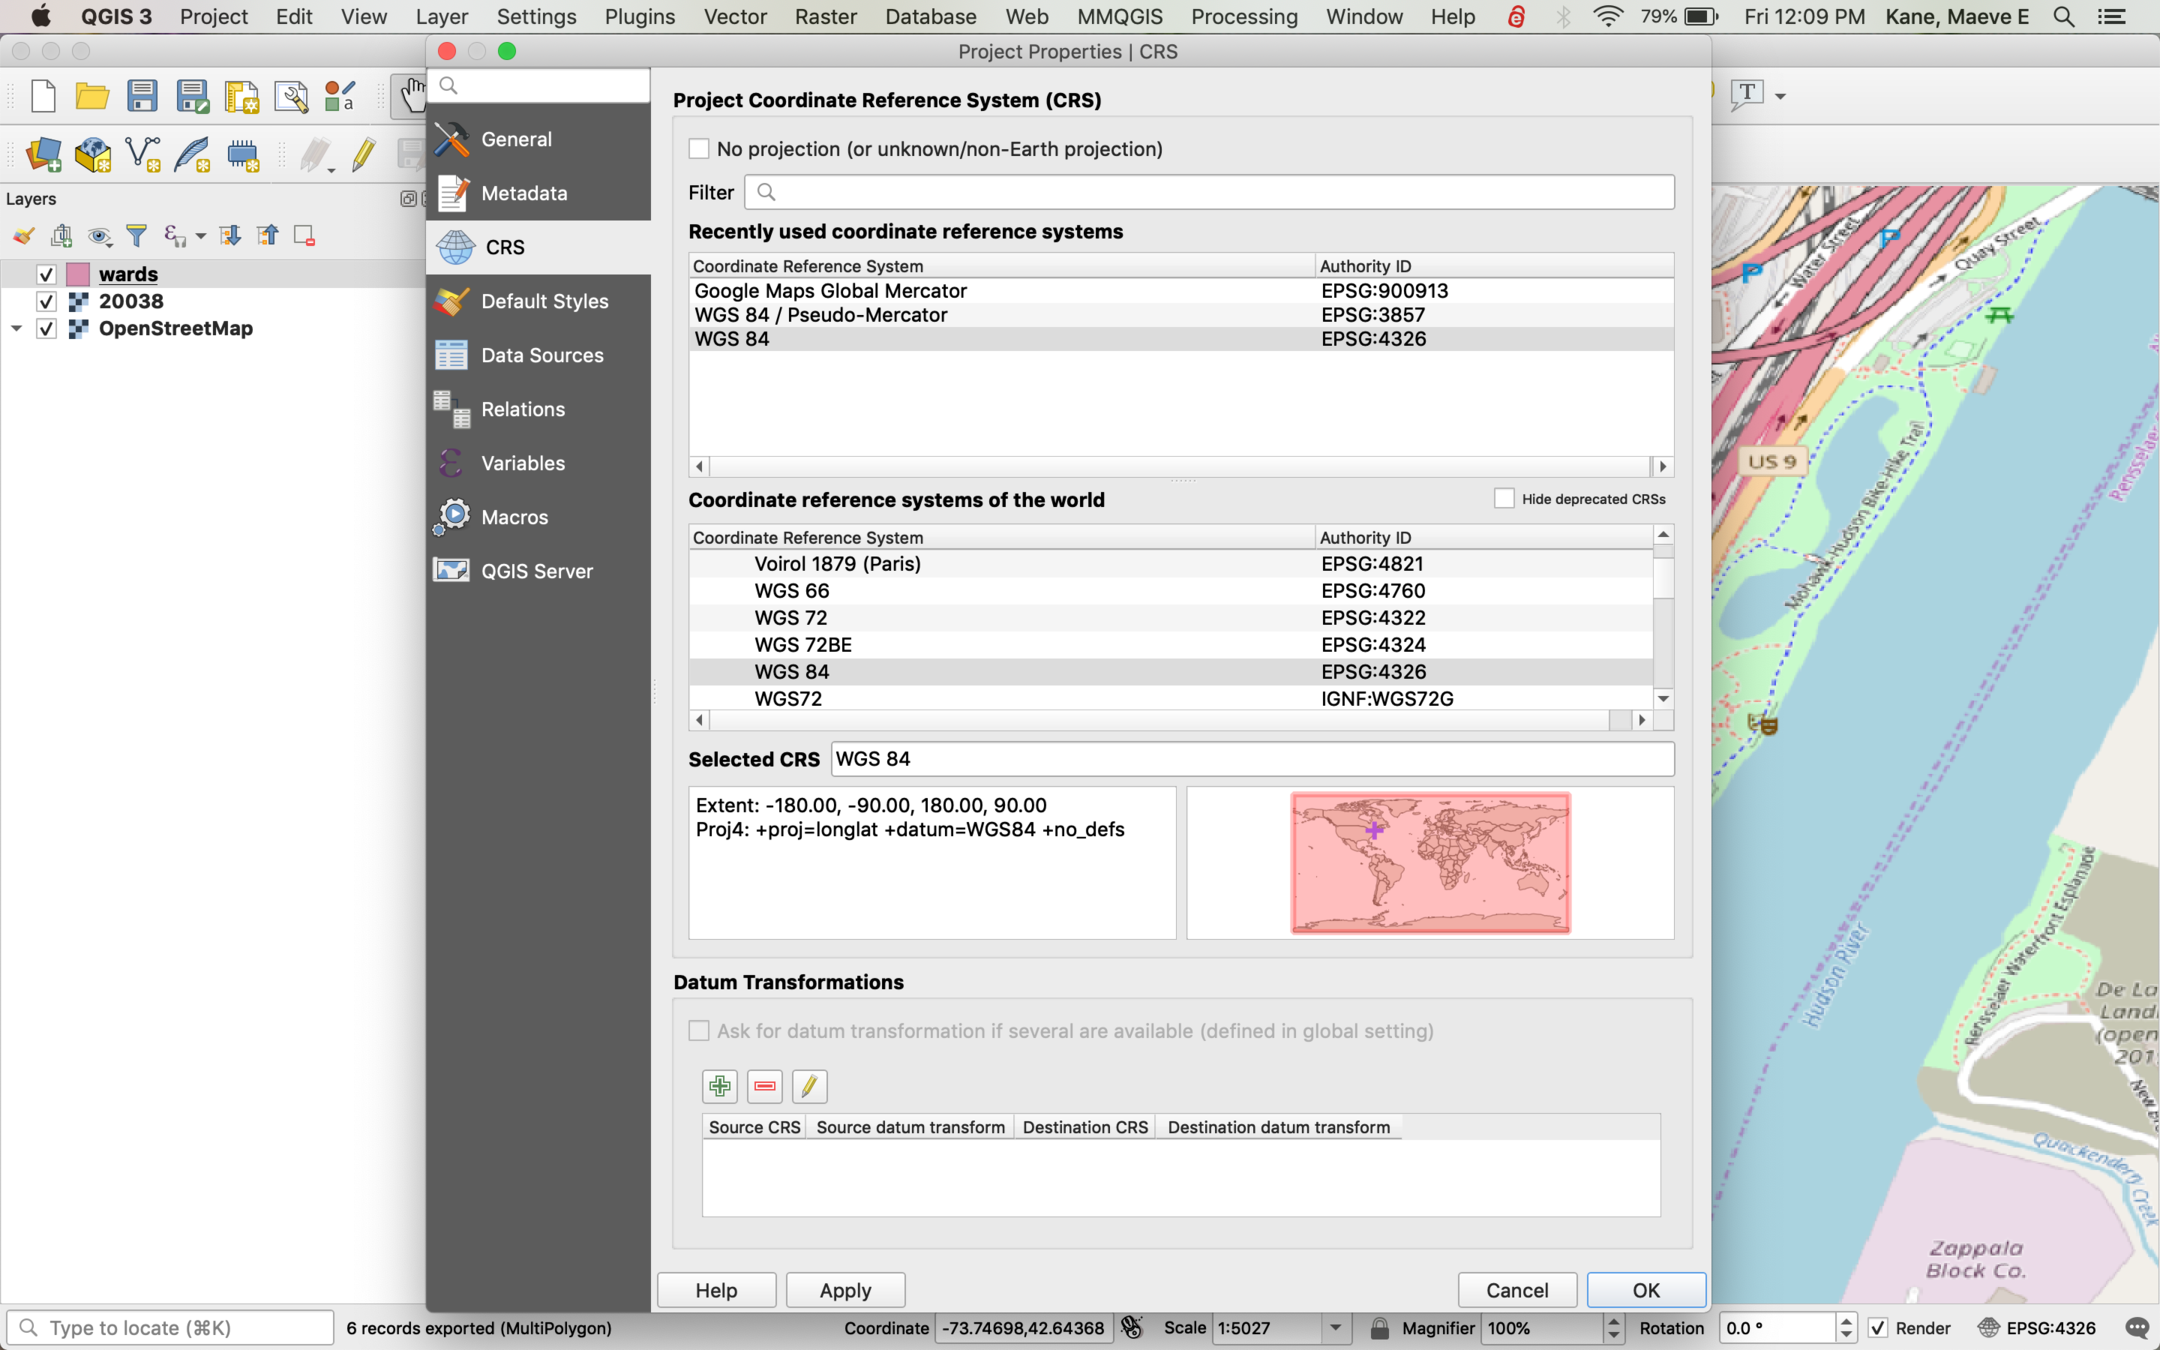
To make sure that your coordinates are exported in lat/lon format (by default QGIS uses an internal coordinate system), select the CRS button in the bottom right and select EPSG:4326. You can type this into filter if it doesn't appear immediately.
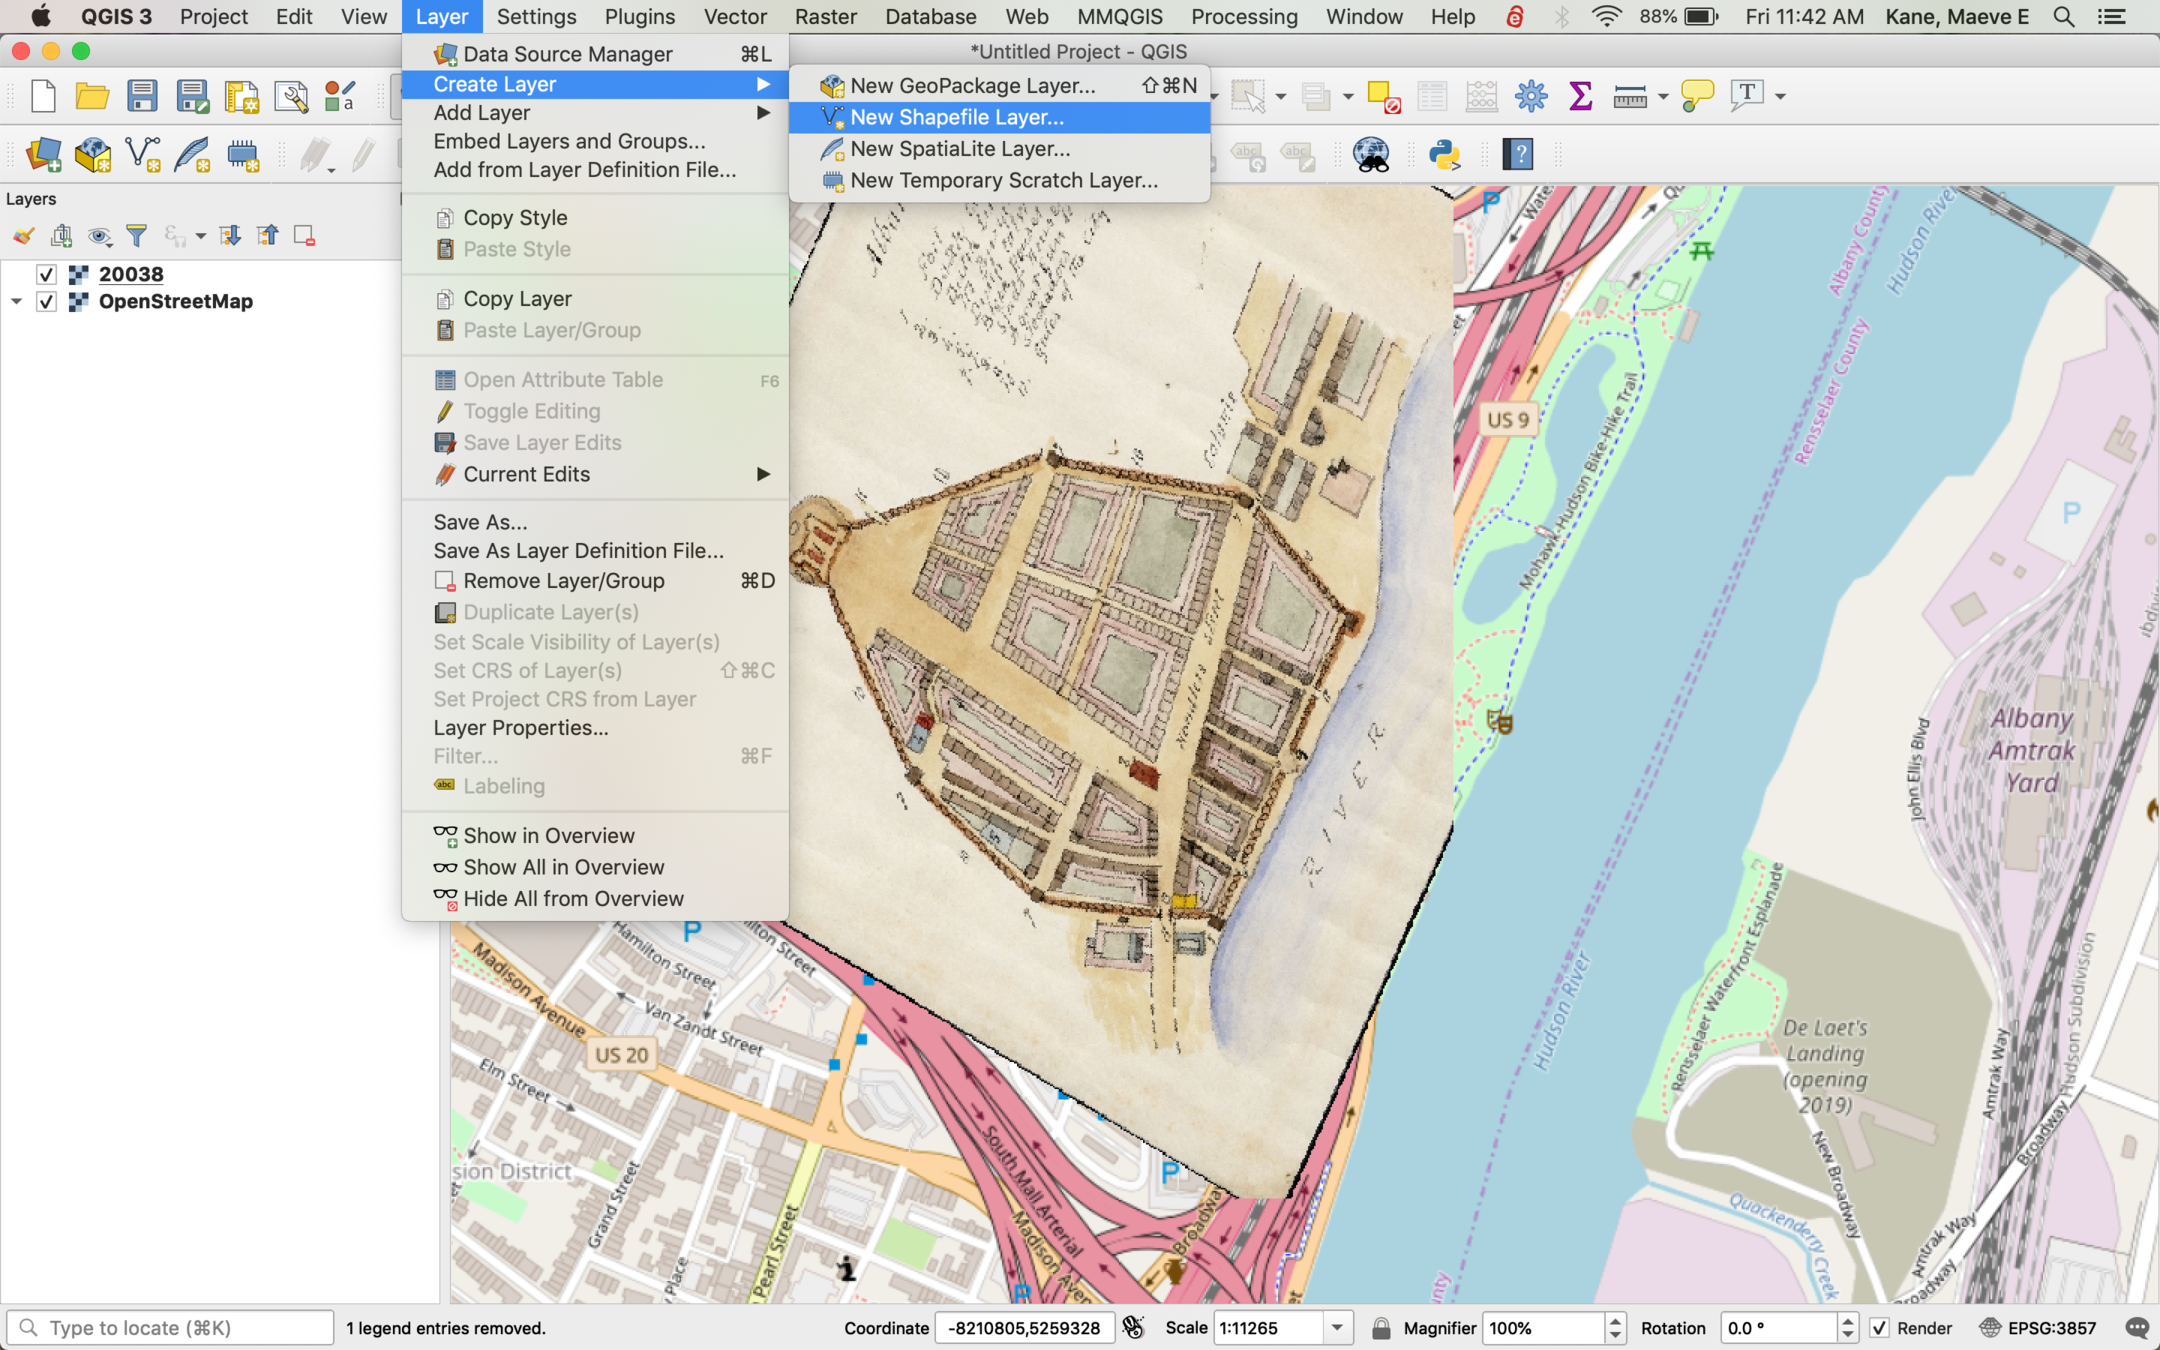
To begin drawing the ward shapes, we'll make a new layer with Layer > Create Layer > New Shapefile Layer
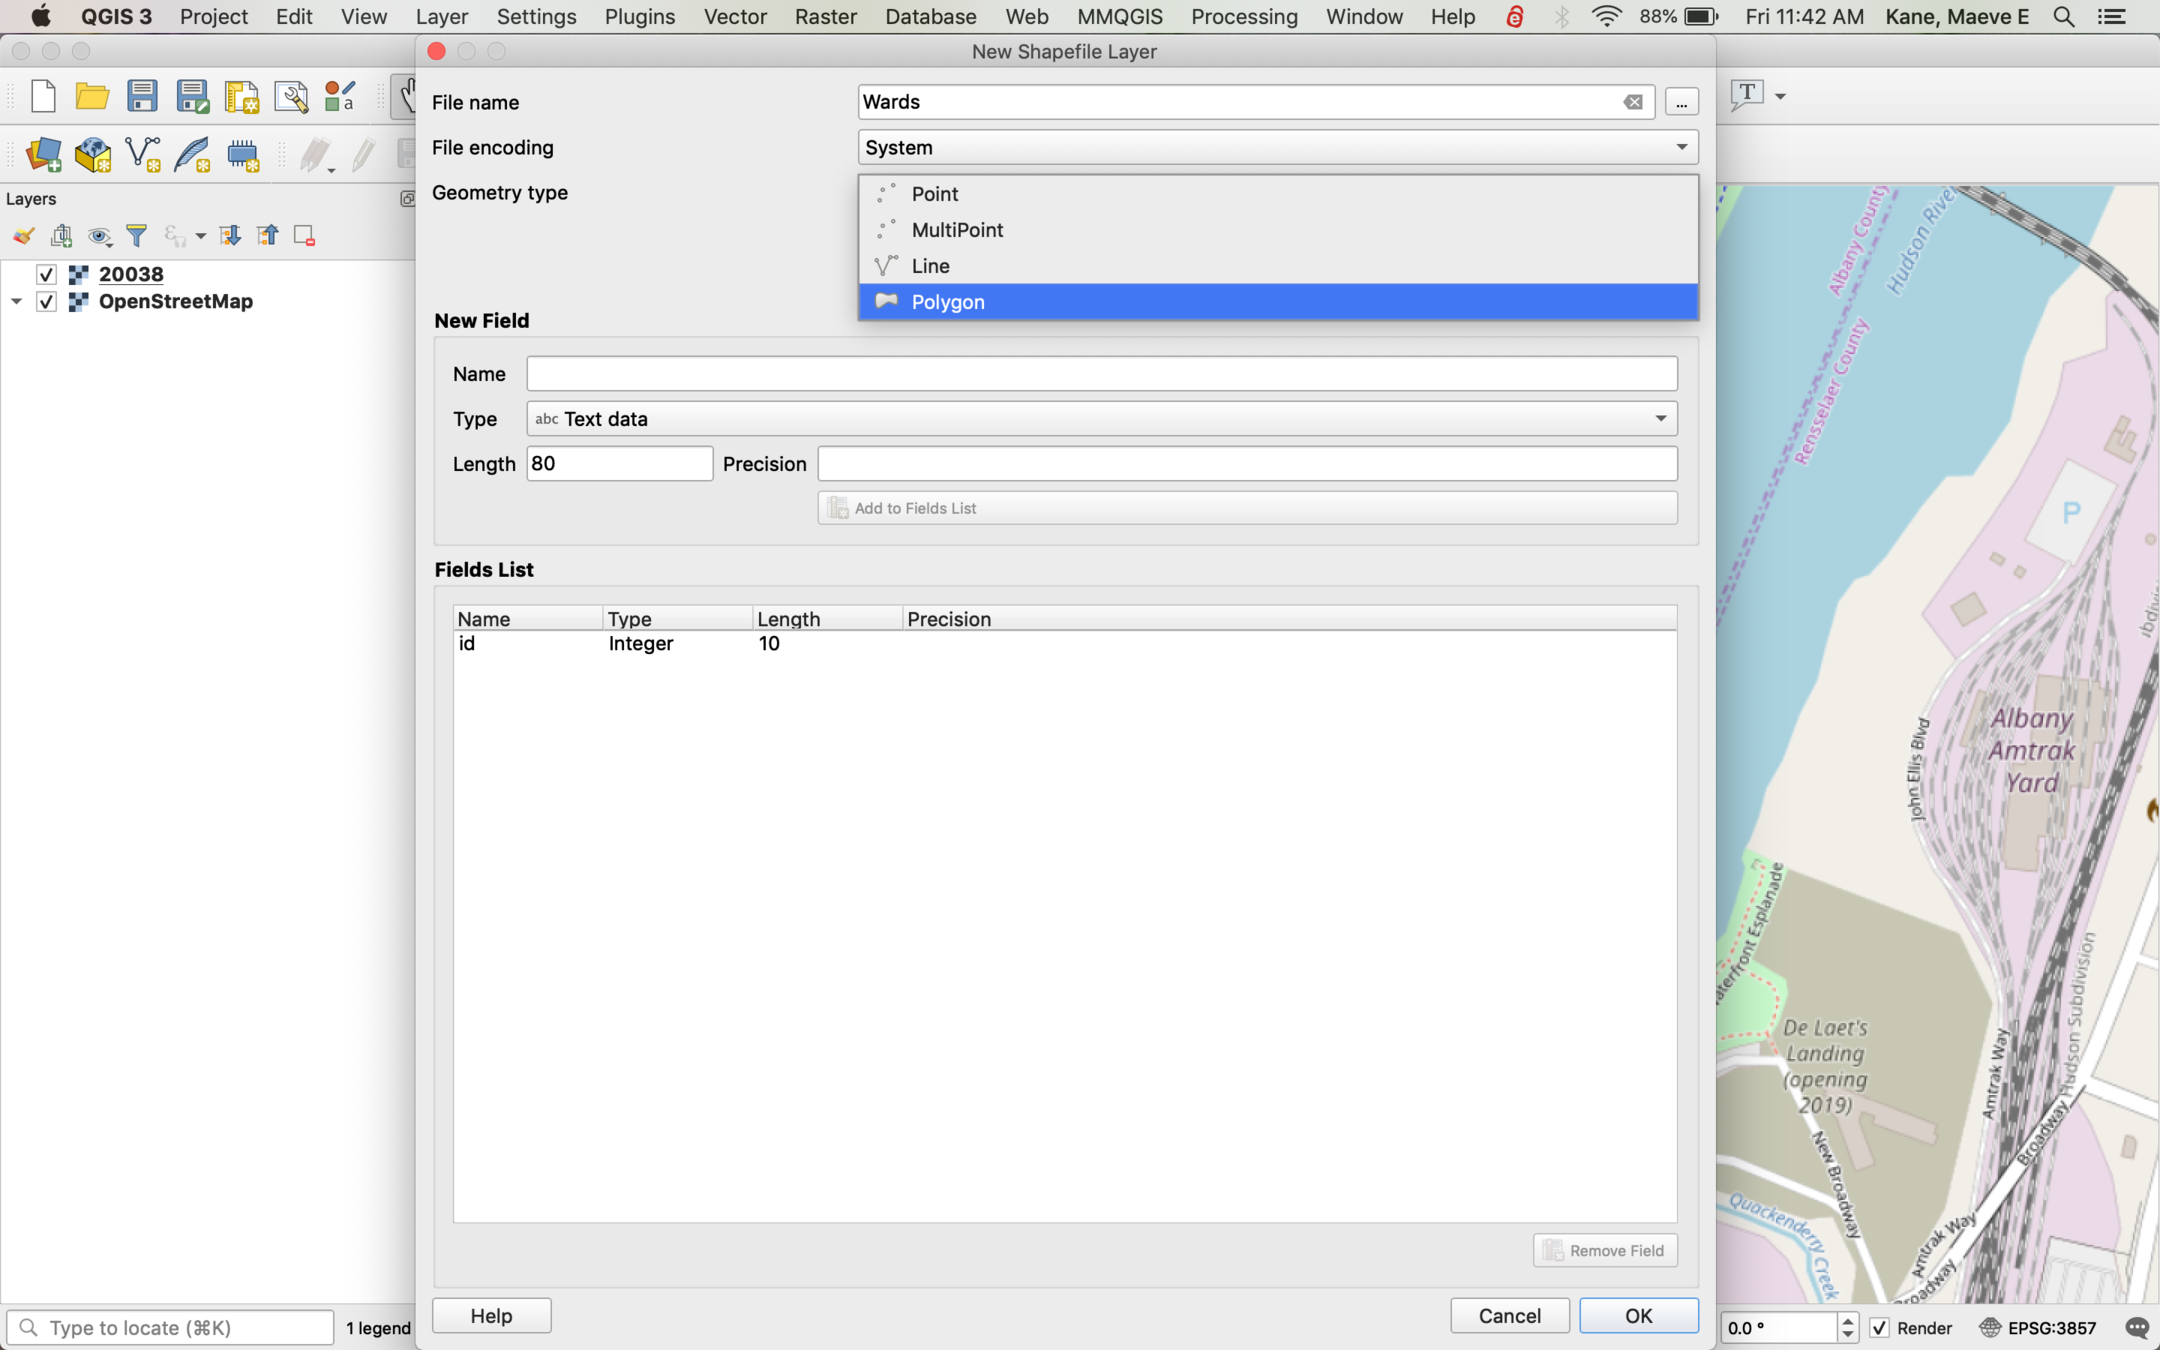
When you enter a file name, be sure to hit the three dots icon and save the file somewhere you have access! Otherwise QGIS tries to save at root, and will tell you it doesn't have permission to save.
Also make sure to change your geometry type to Polygon--if you leave it as point or line, your shapes won't be connected, they'll just be dots!
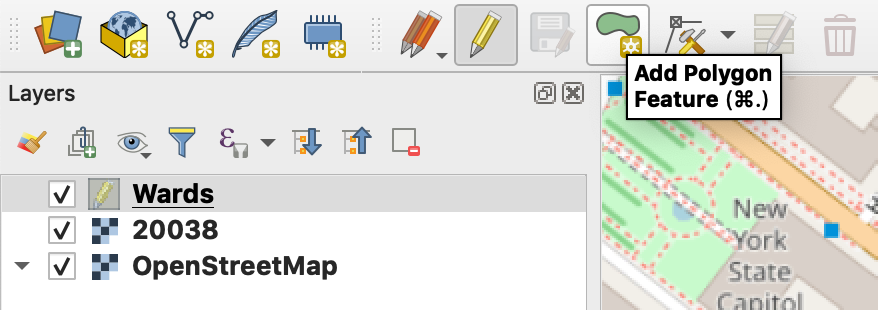
You should now have a layer with your selected name in the Layers pane. By default, QGIS doesn't let you edit the layers to keep you from accidentally messing things up. Toggle editing for a specific layer with the pencil icon and then select Add Polygon Feature.
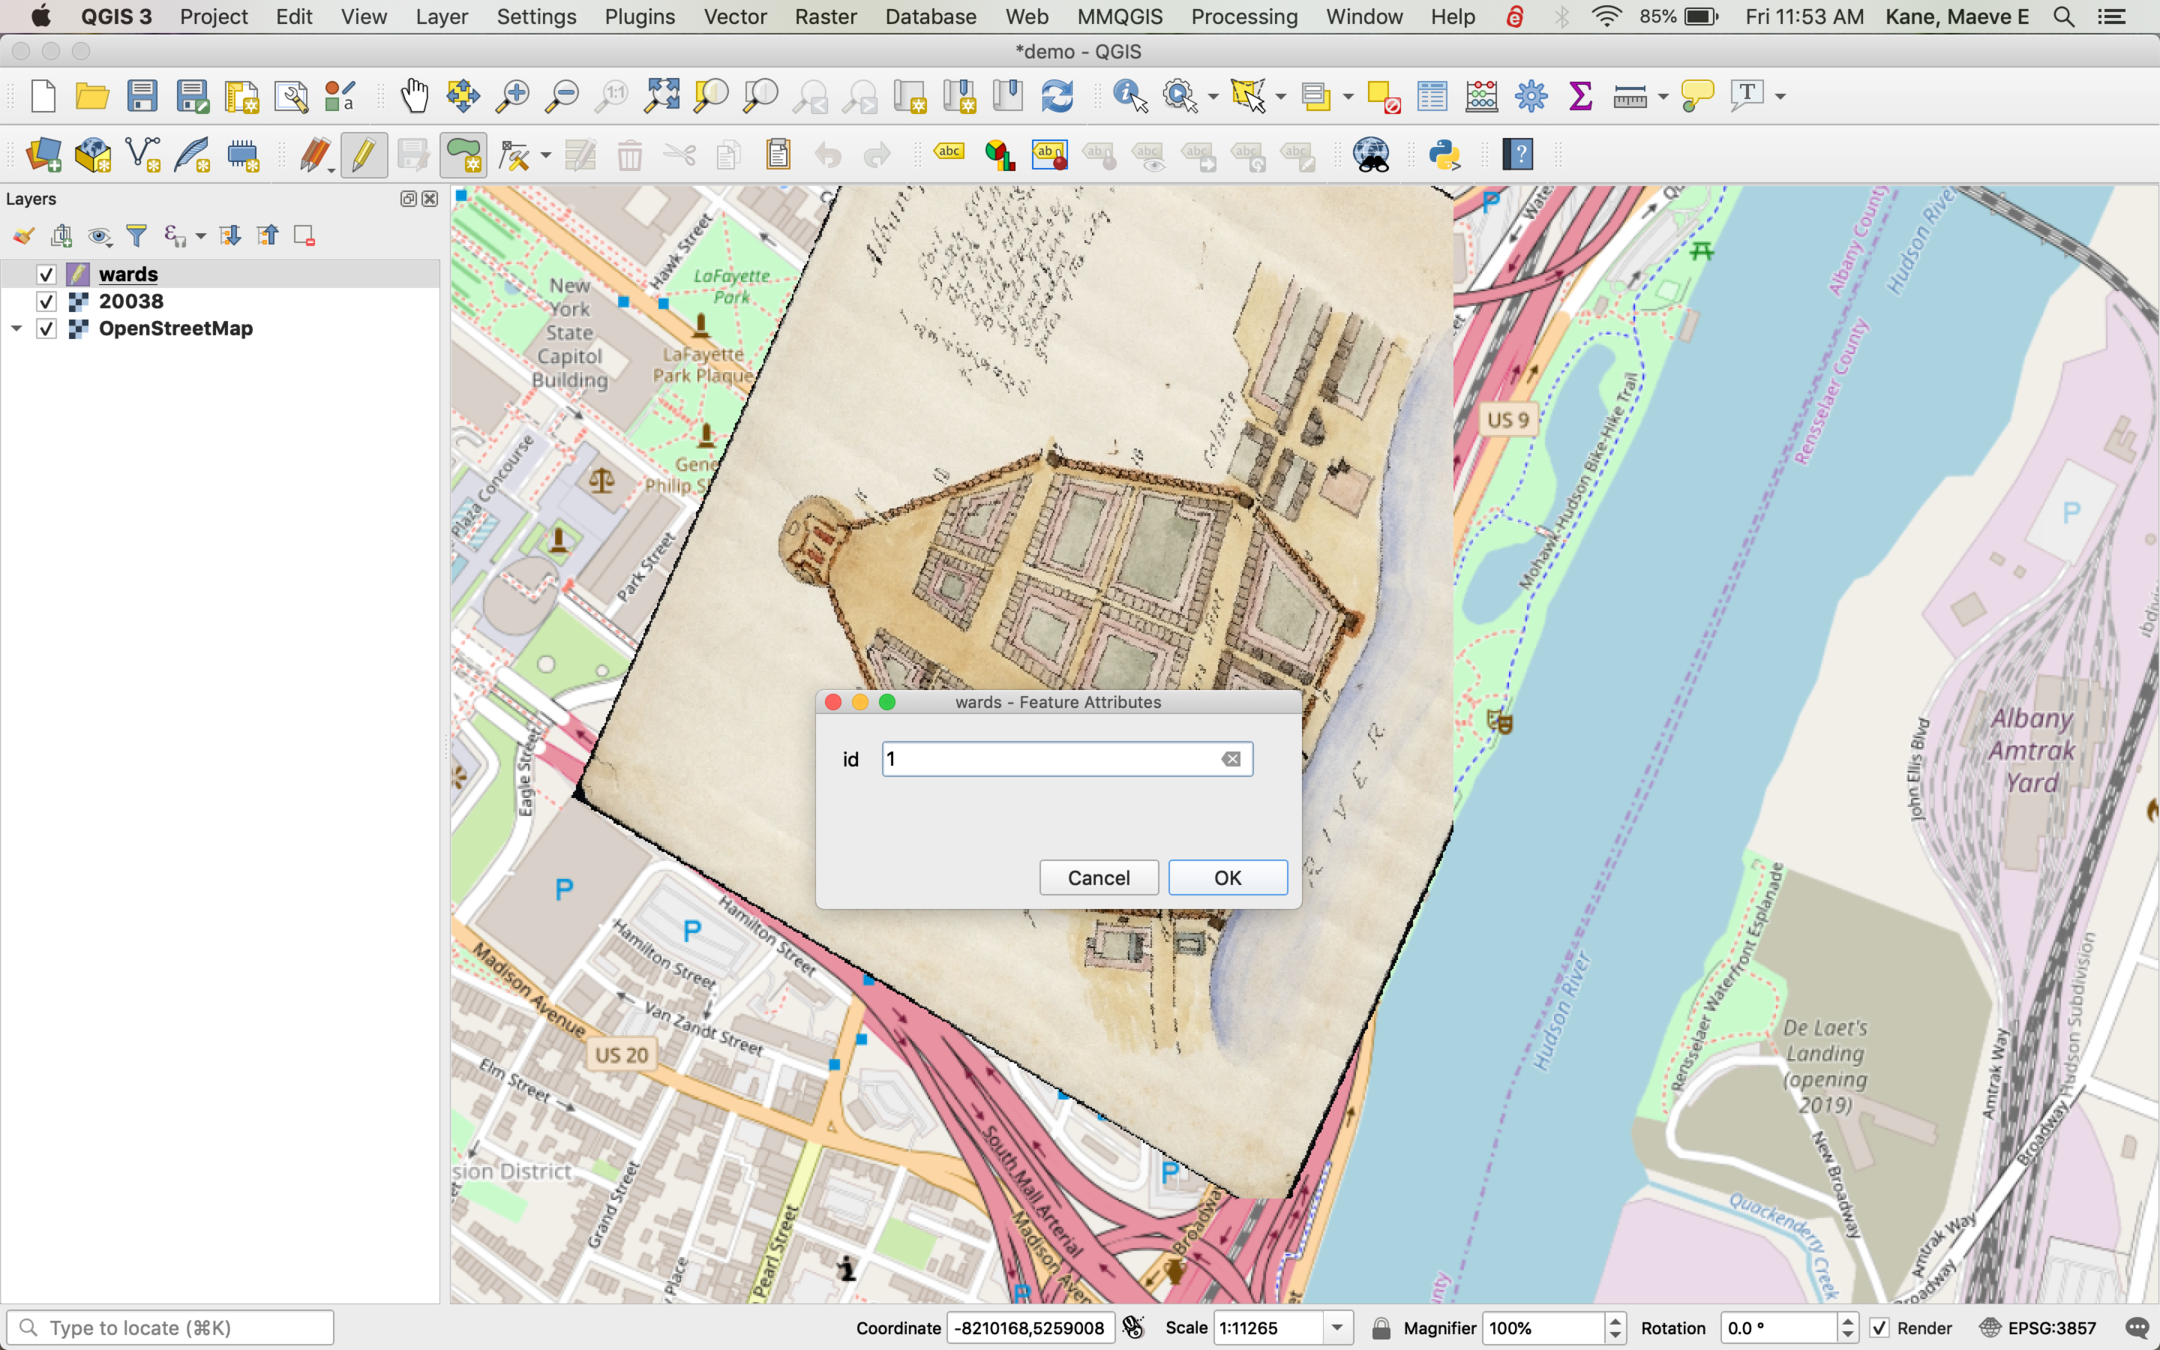
Click the corner boundaries of your shape, then right-click (try ctrl-click if right-click doesn't work) outside of the shape to finish it. After right-clicking, QGIS will ask you to give the shape an ID.
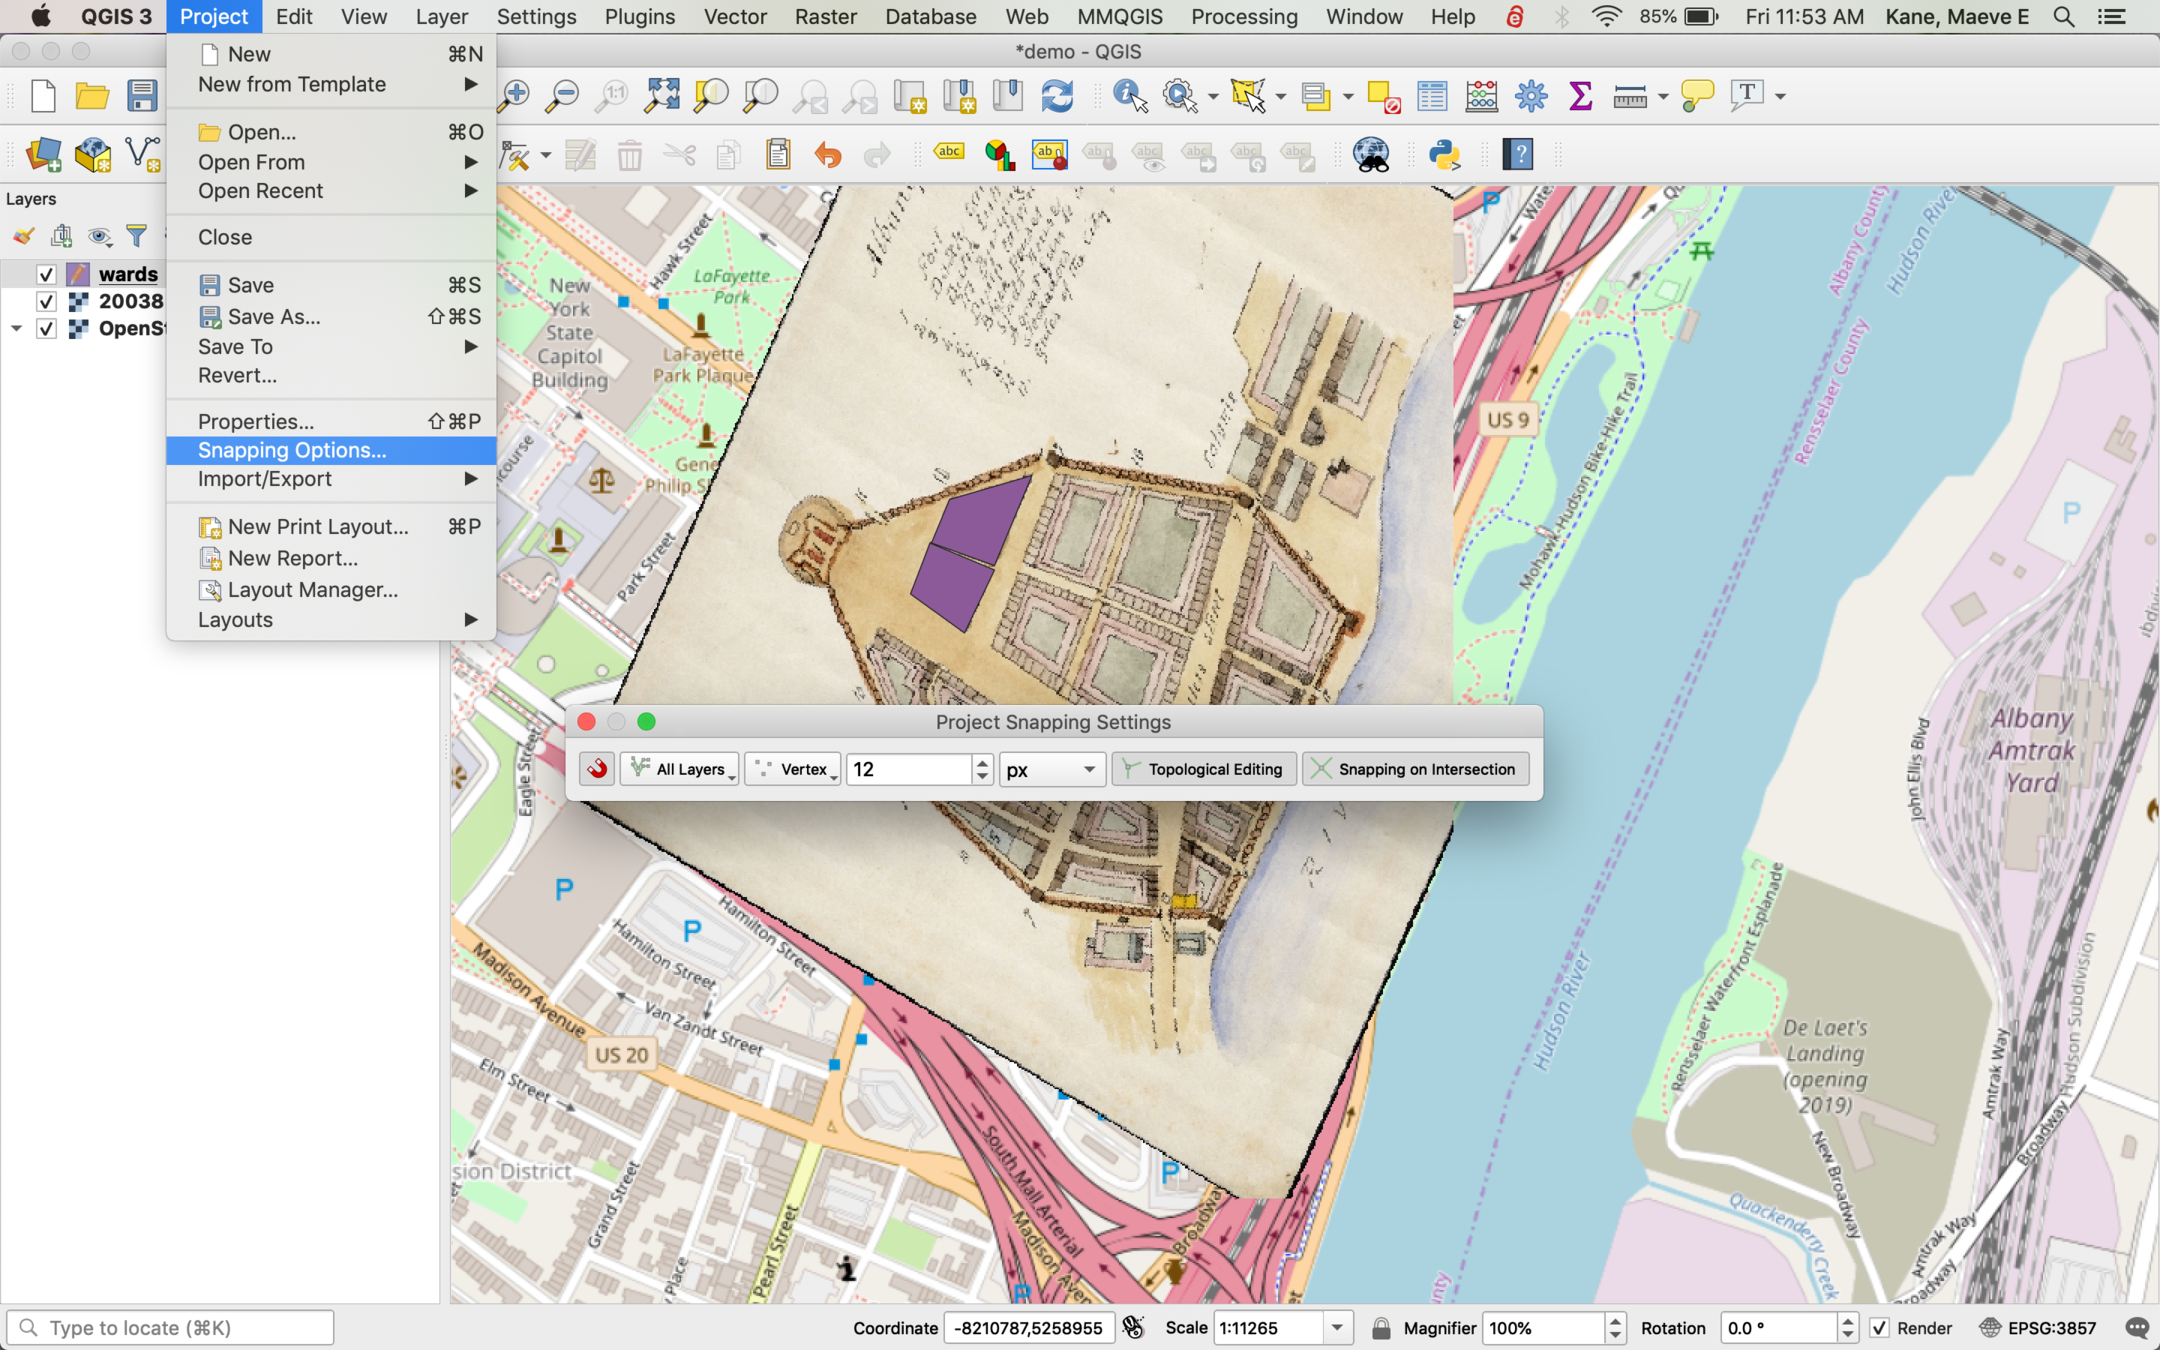
By default, QGIS lets you place shape boundaries anywhere, but if you want to "snap" edges together, select Project > Snapping Options and the magnet icon to snap your new points to your old points if they're within a certain distance.
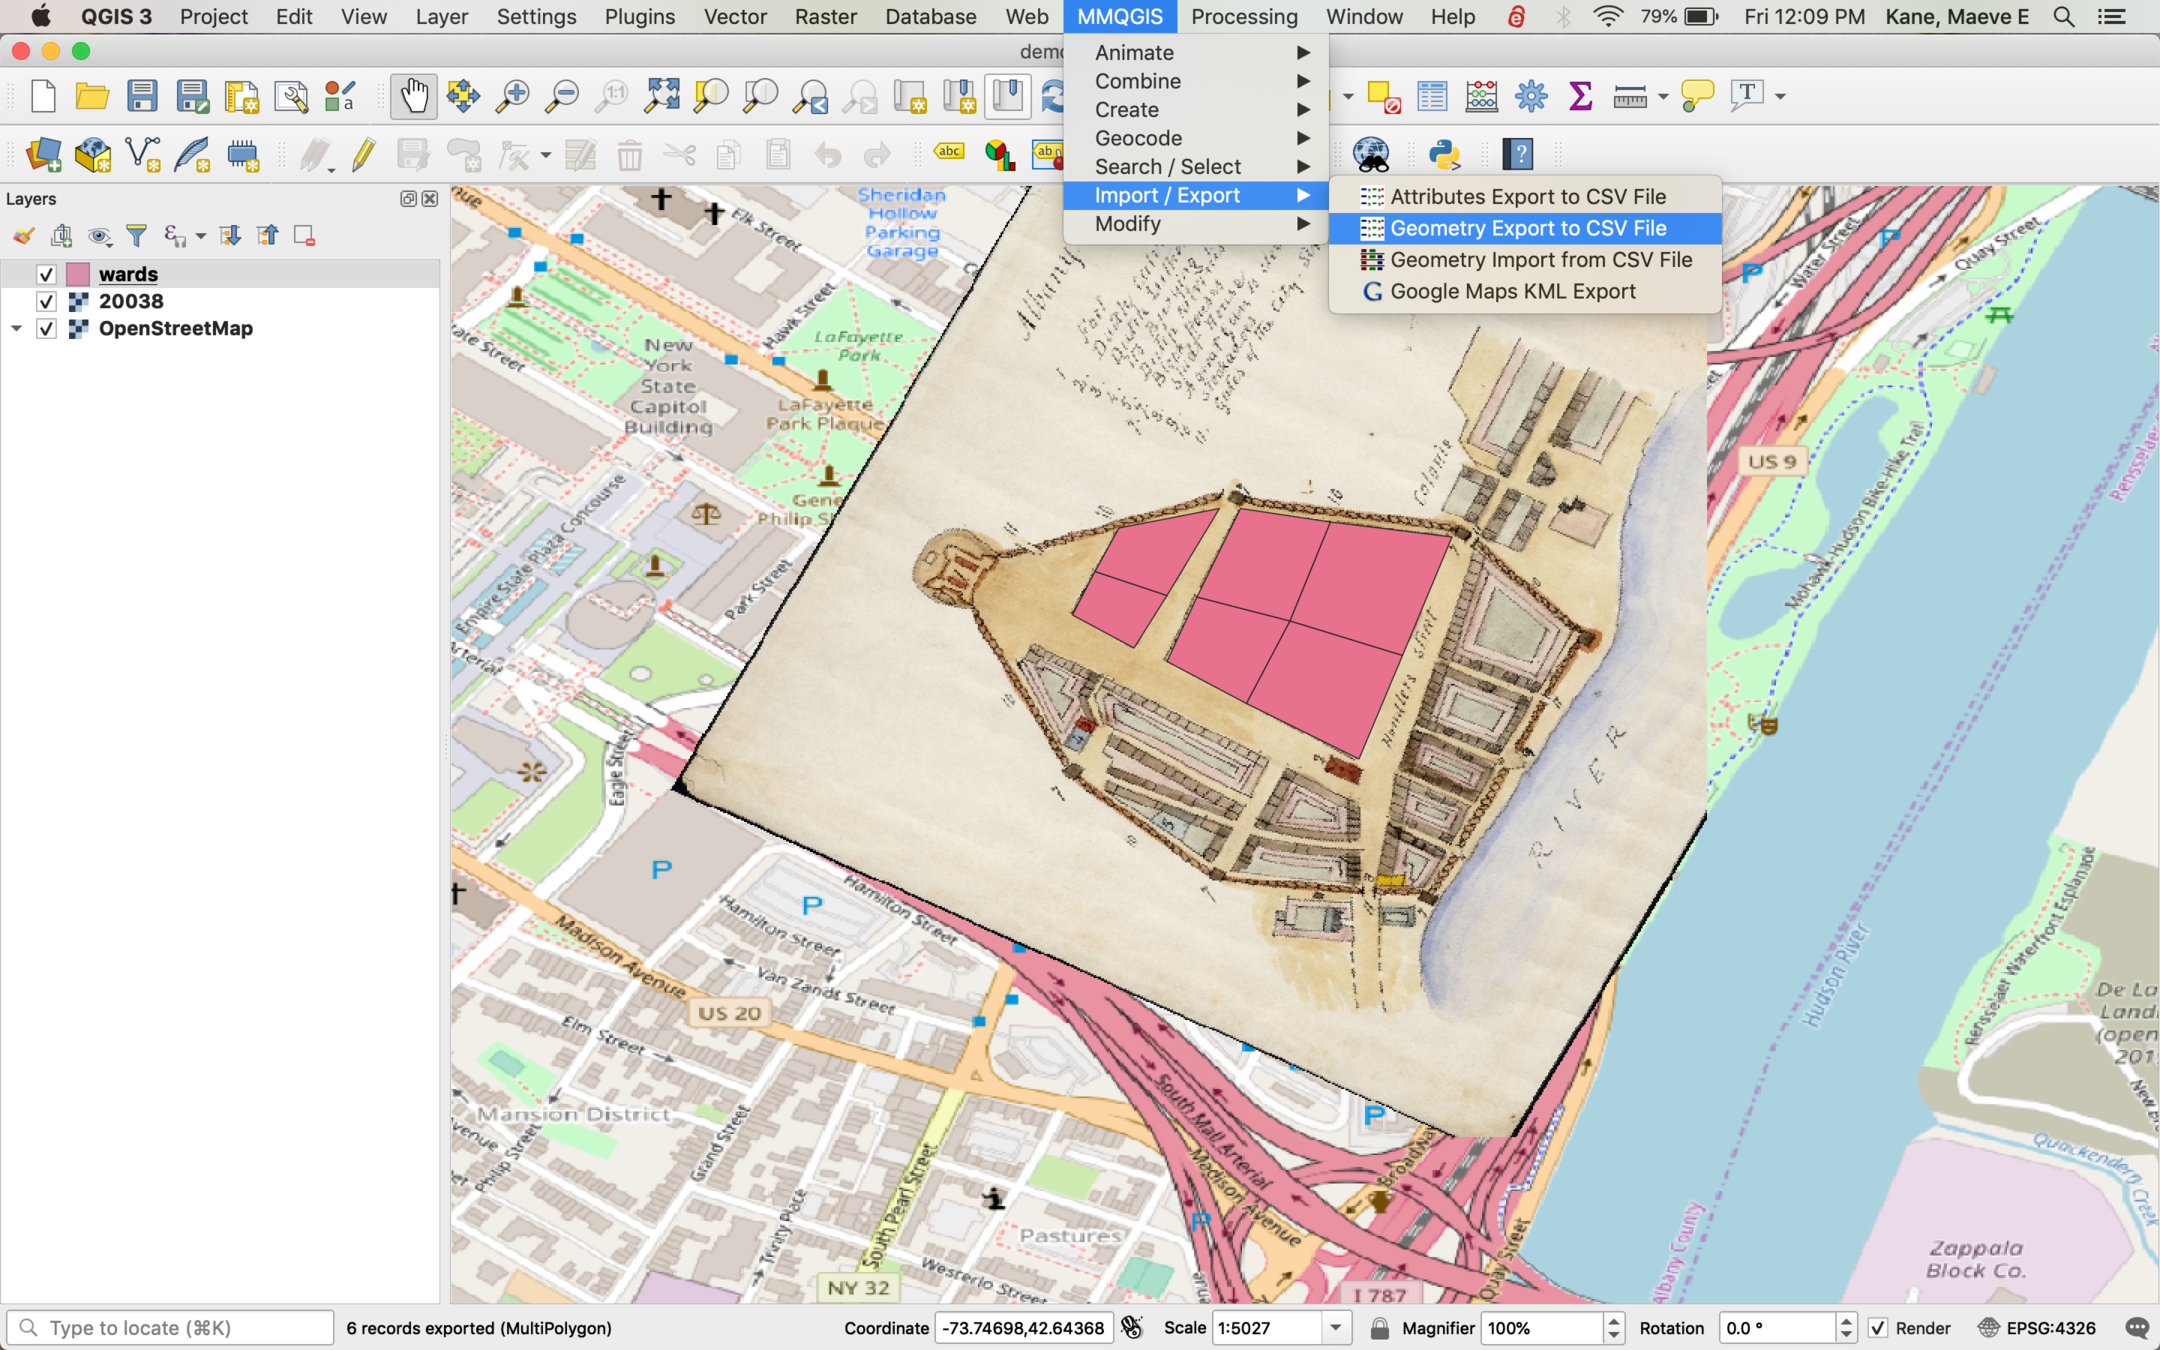
When you've finished drawing all of your shapes, use the MMQGIS plugin (install under Plugins > Manage and search for MMQGIS). MMQGIS > Import/Export > Geometry Export will create a csv of your shapes.
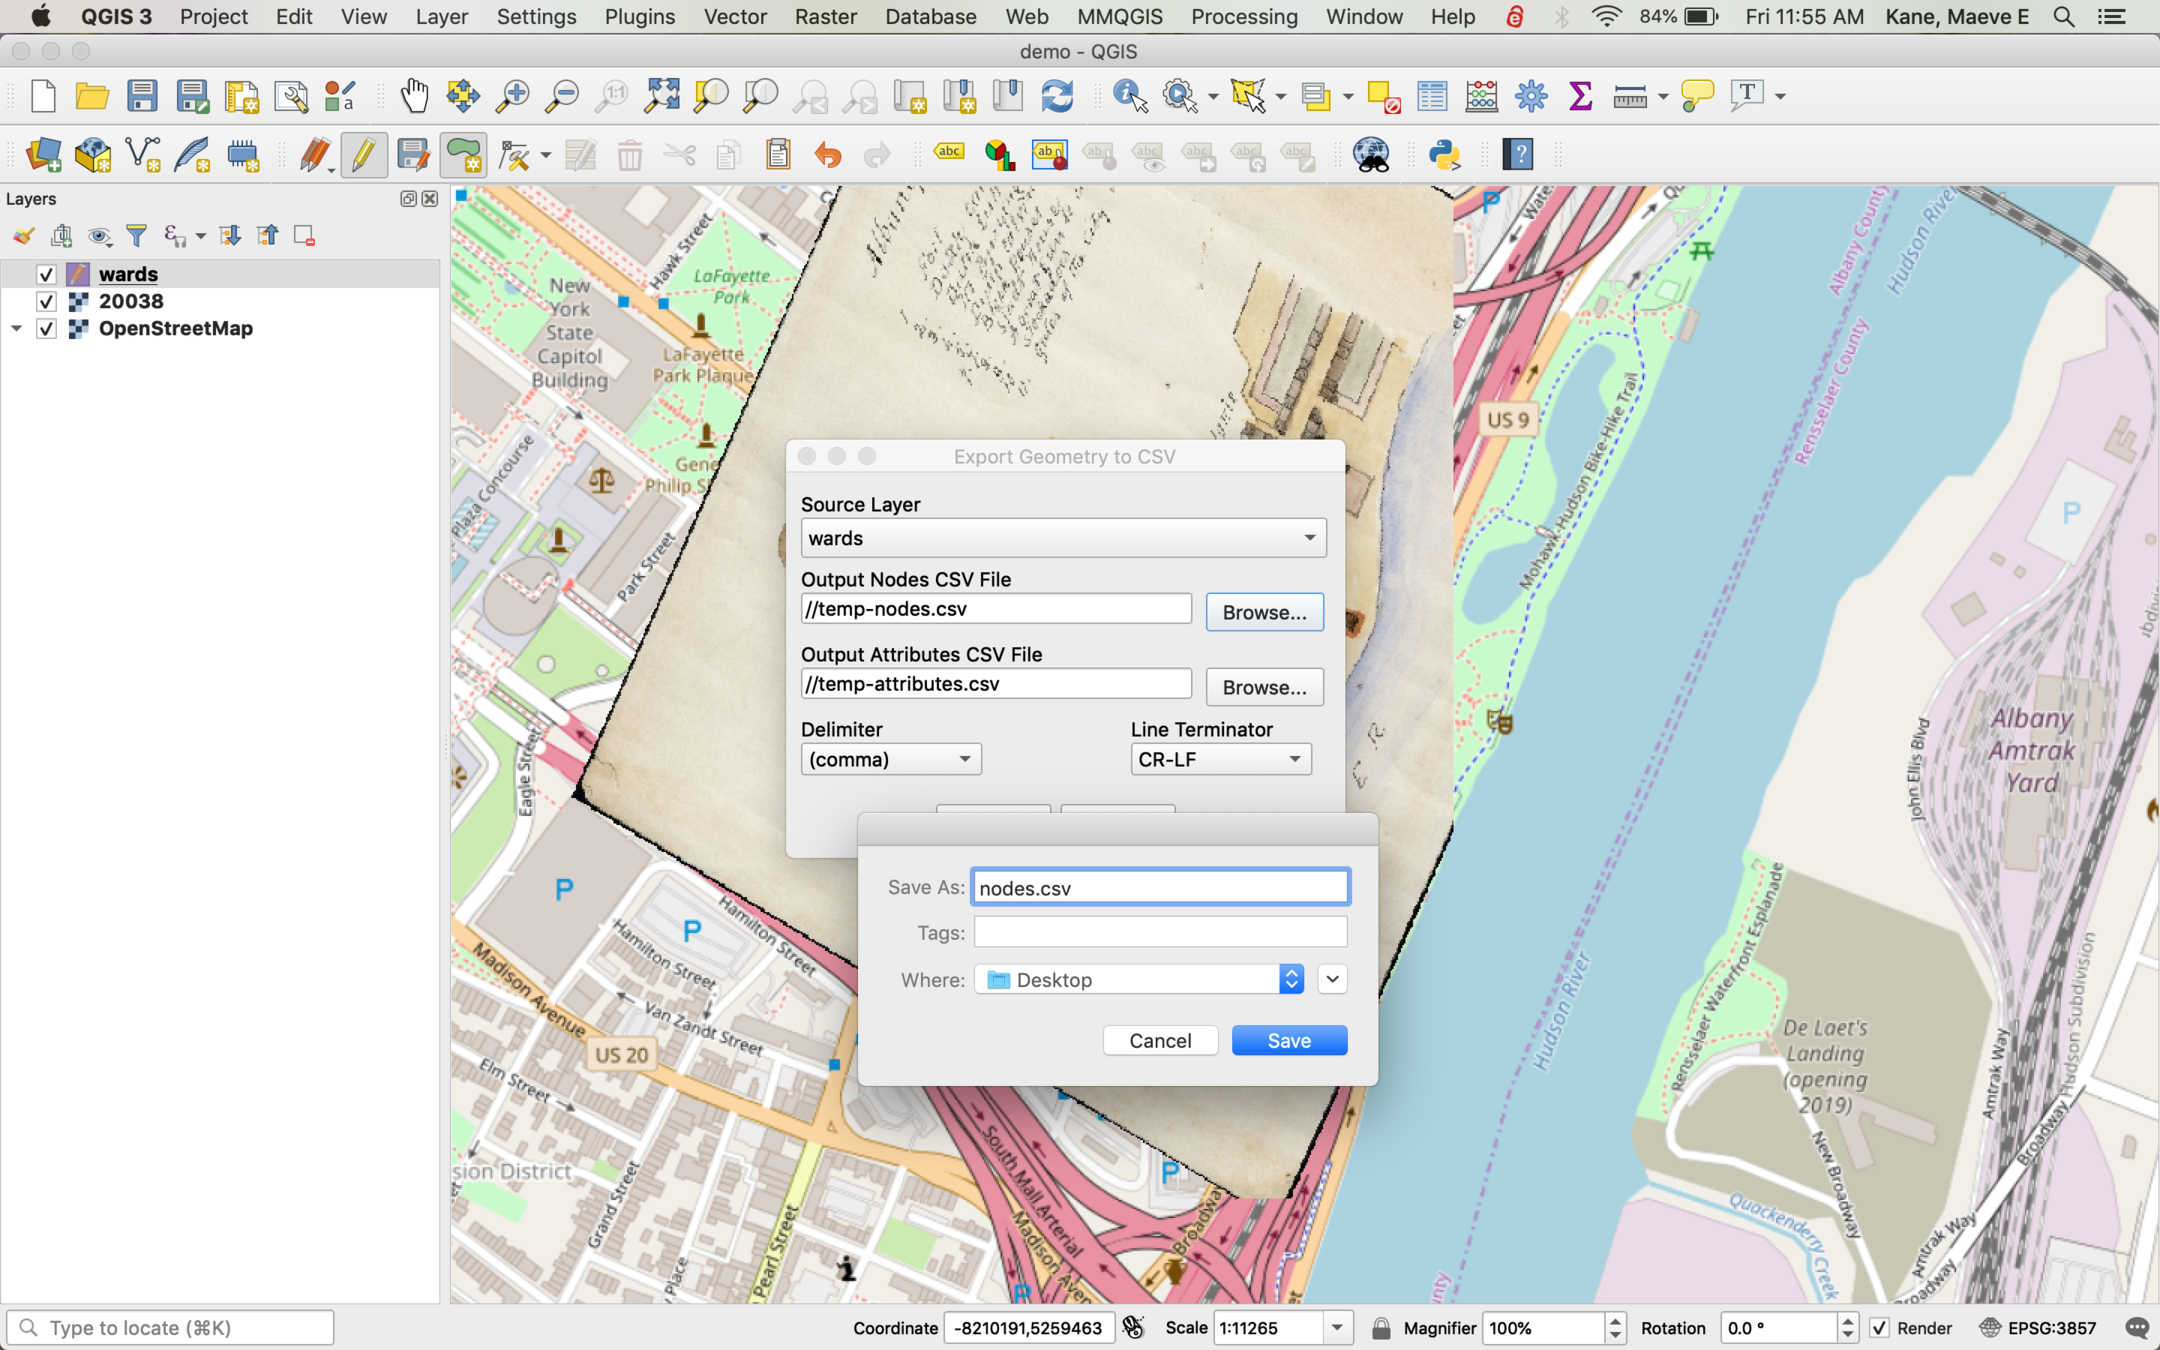
Make sure to save these files somewhere you will have easy access to them and give them unique names. You will be using the Nodes csv file but not the Attributes file.
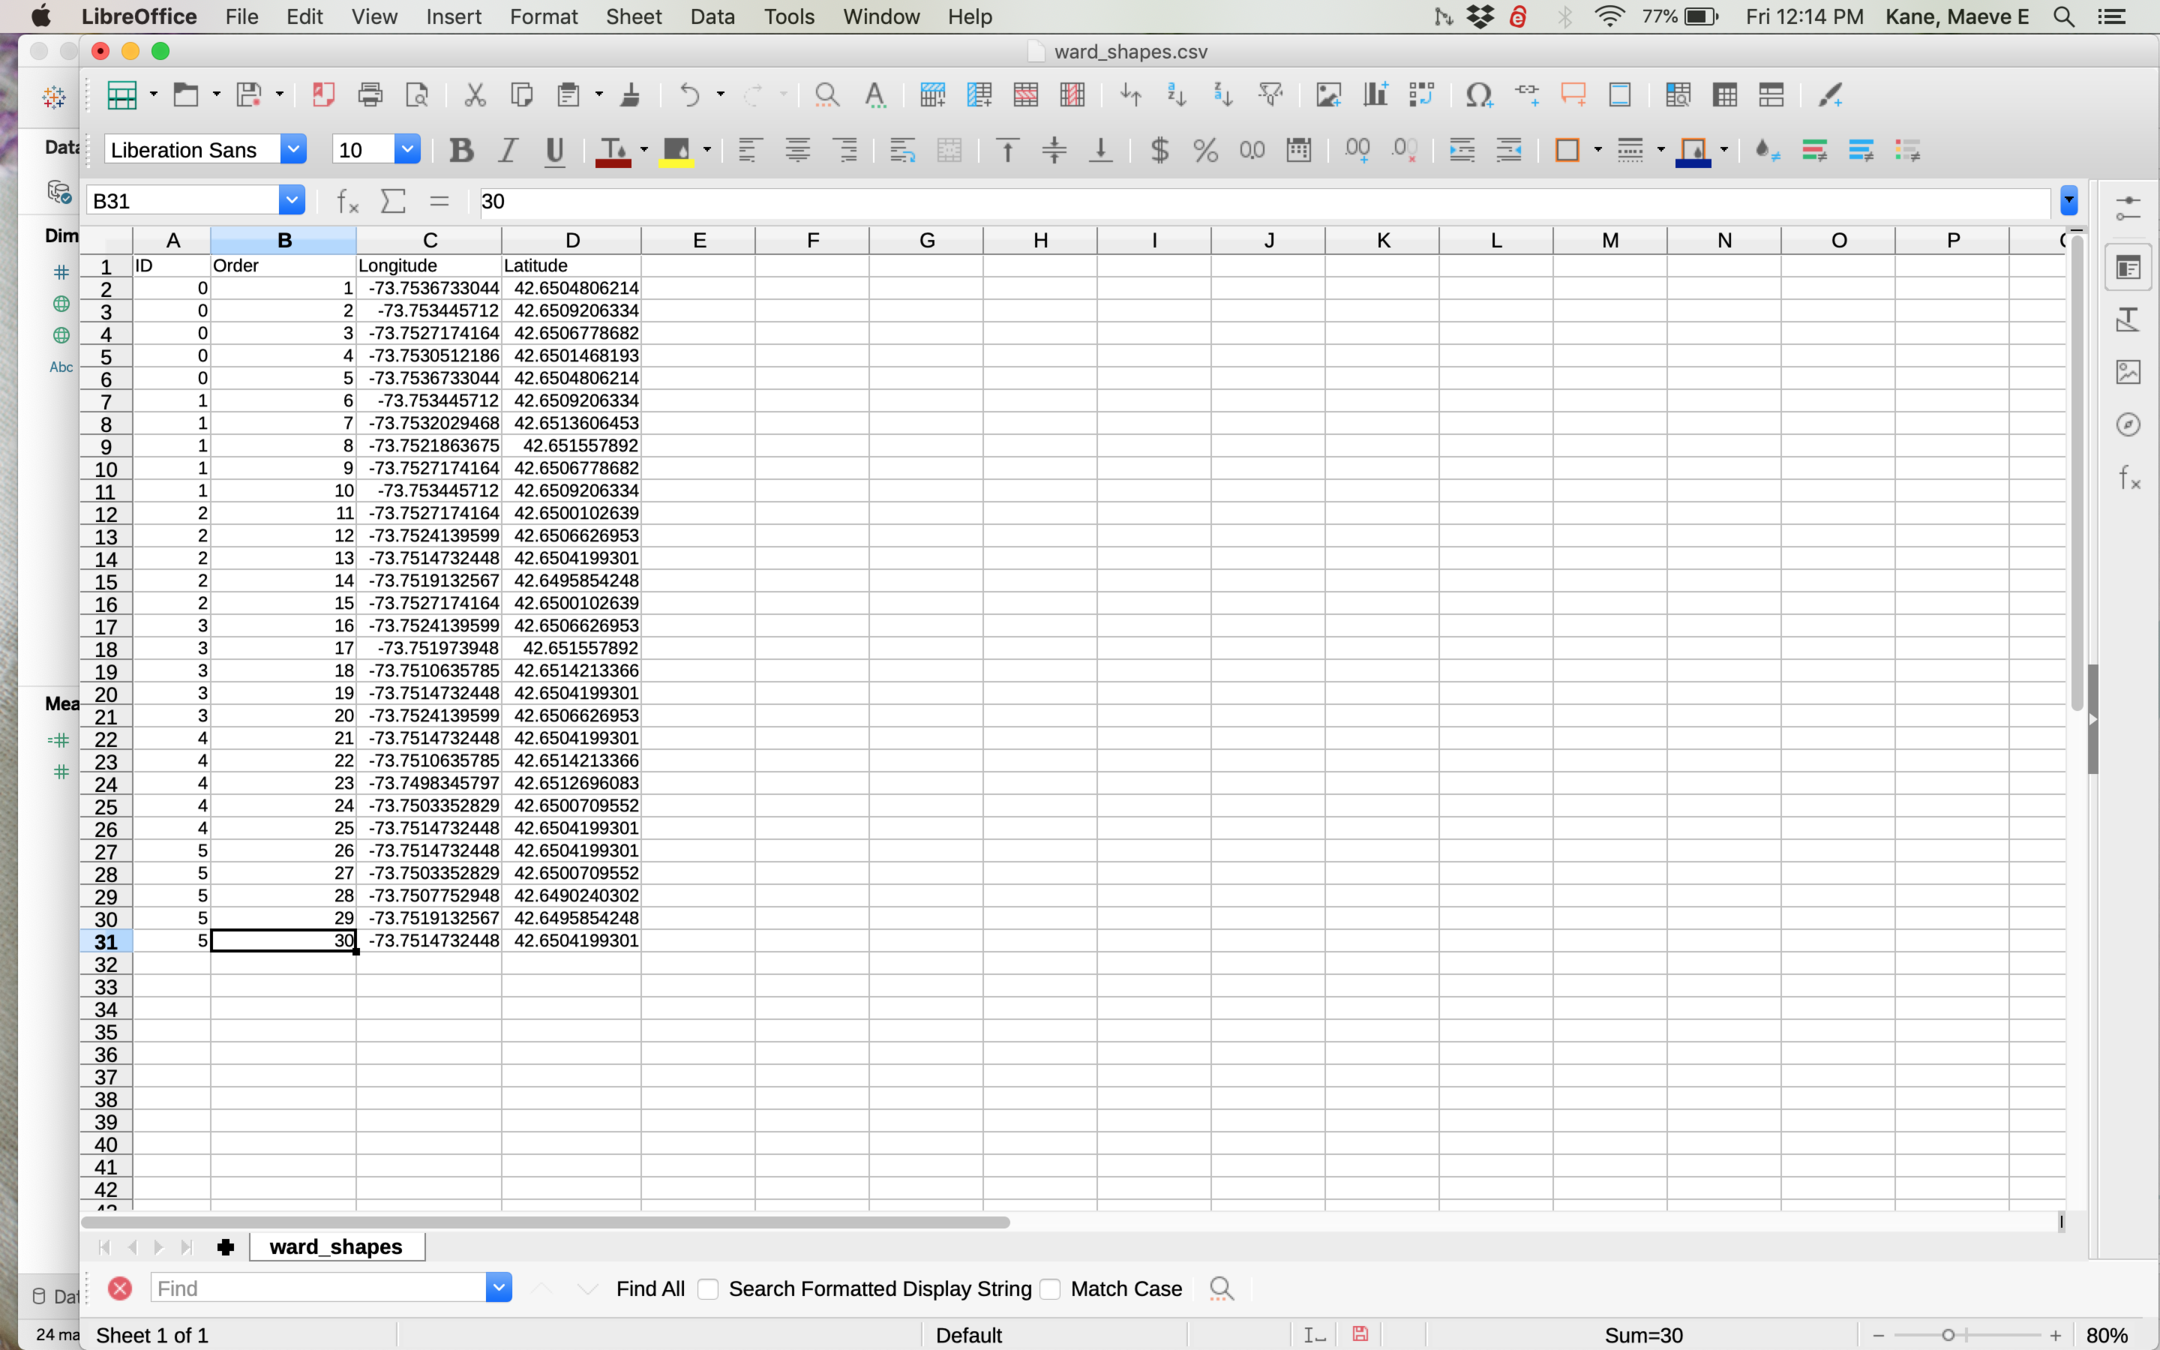
Open the Nodes csv (it doesn't matter what you named it), and rename X to Longitude, Y to Latitude, shapeid to ID, and add a column named Order. The Order column will tell Tableau how to draw your shapes.
If you have wards or other shapes for multiple years, combine these into one file and add a column with the year.
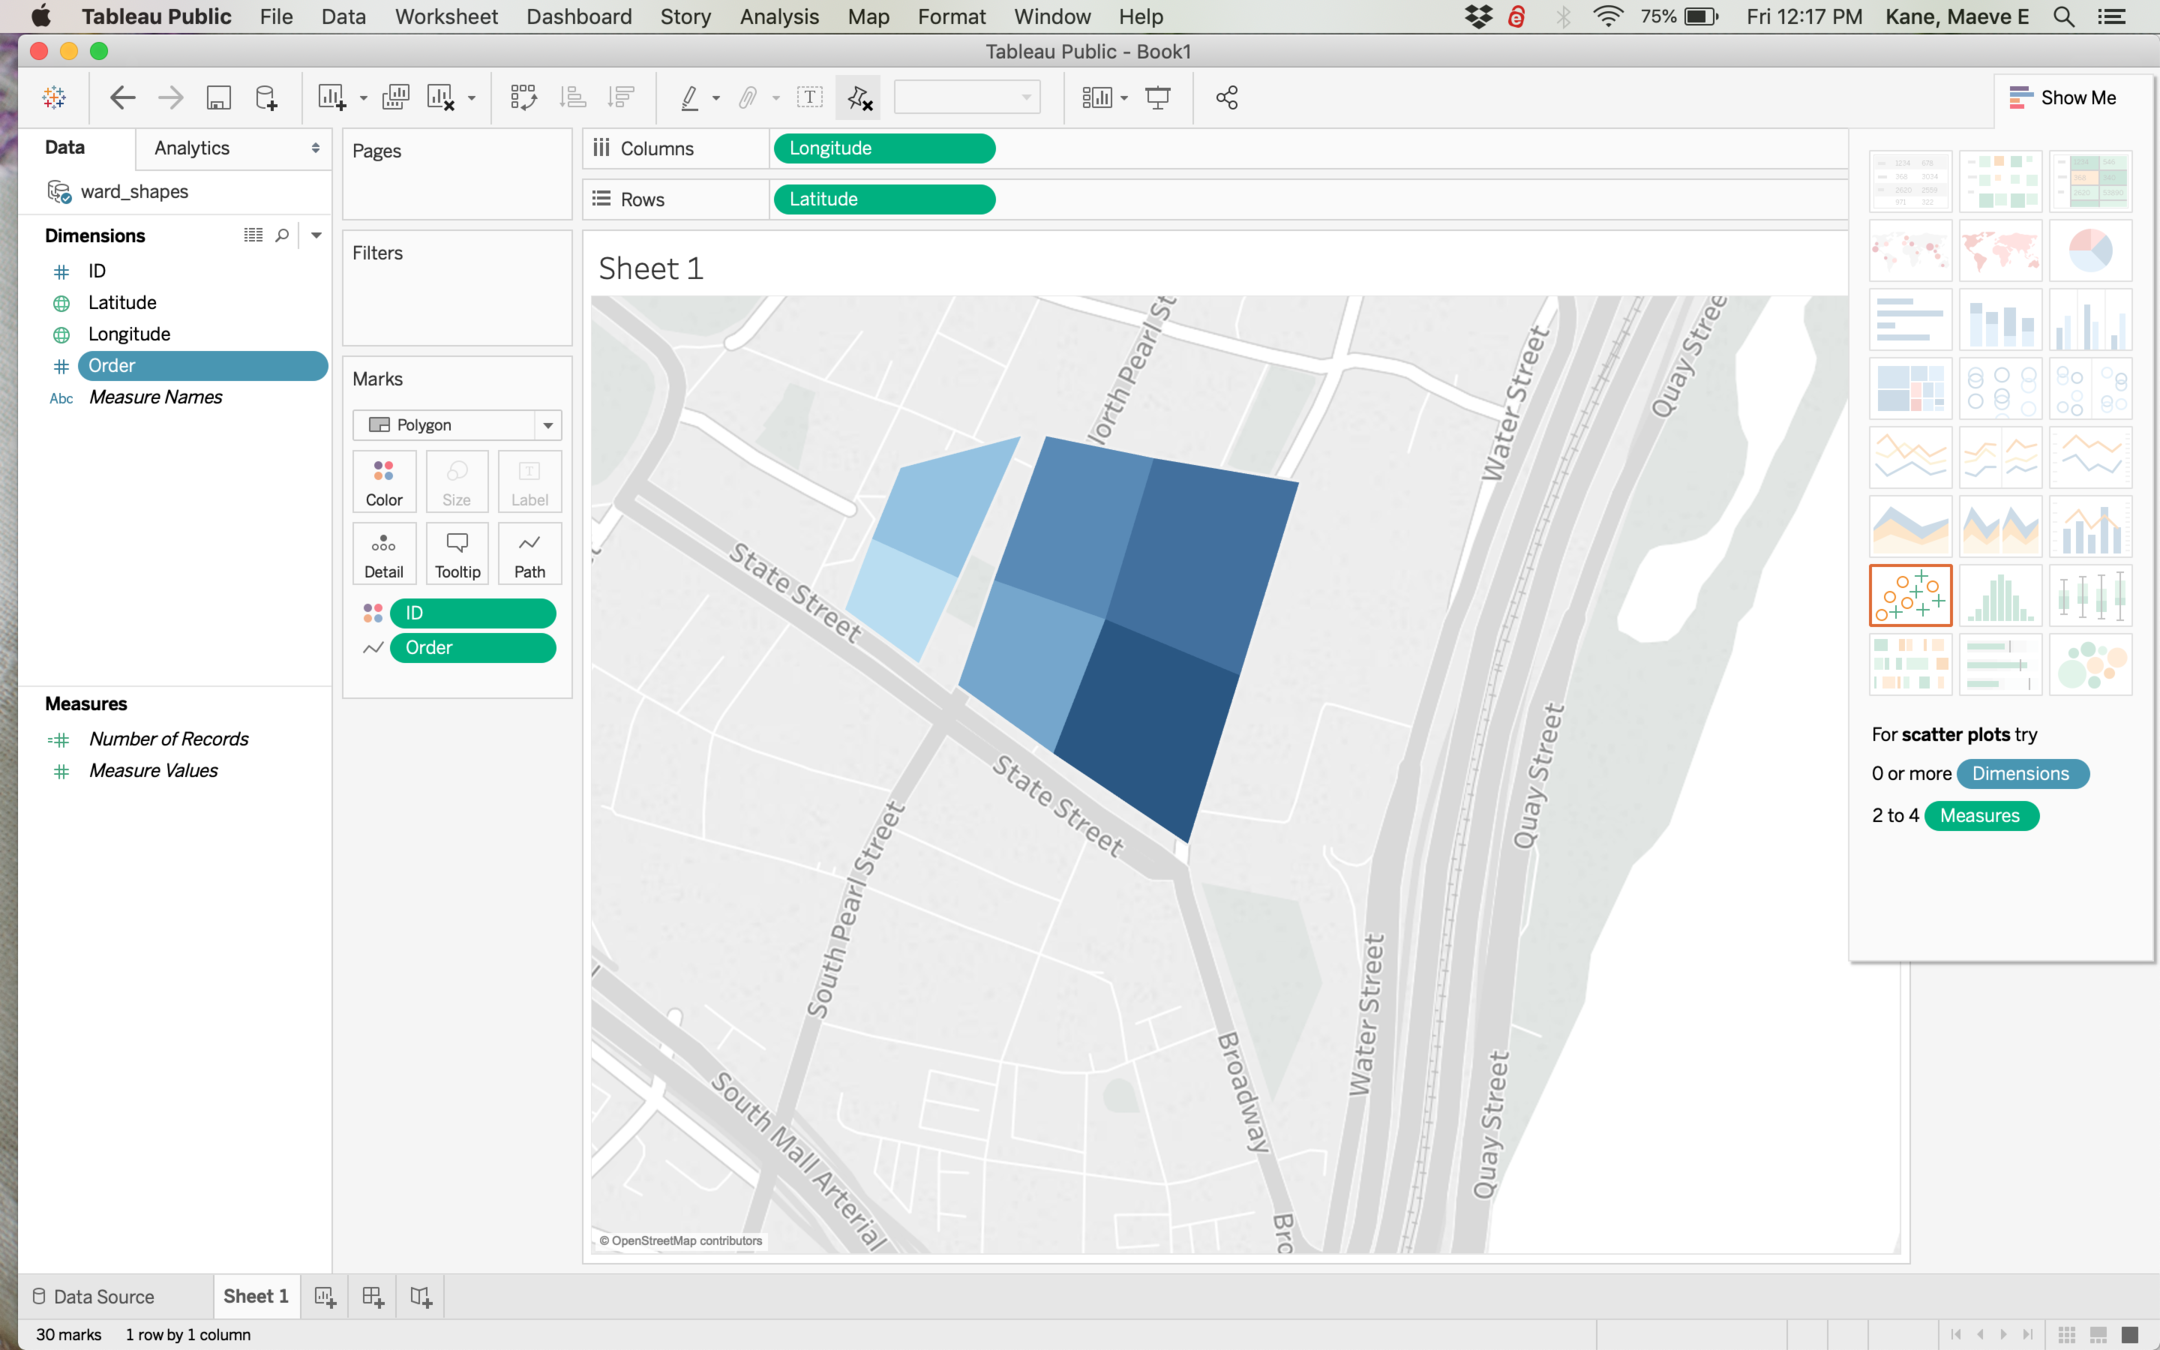
In Tableau, import this csv as usual. You will need to convert ID, Order, Latitude, Longitude, and Year to Dimension if they are not already. Drag each of these items as shown below (order goes to Path), and select Polygon as the mark type.
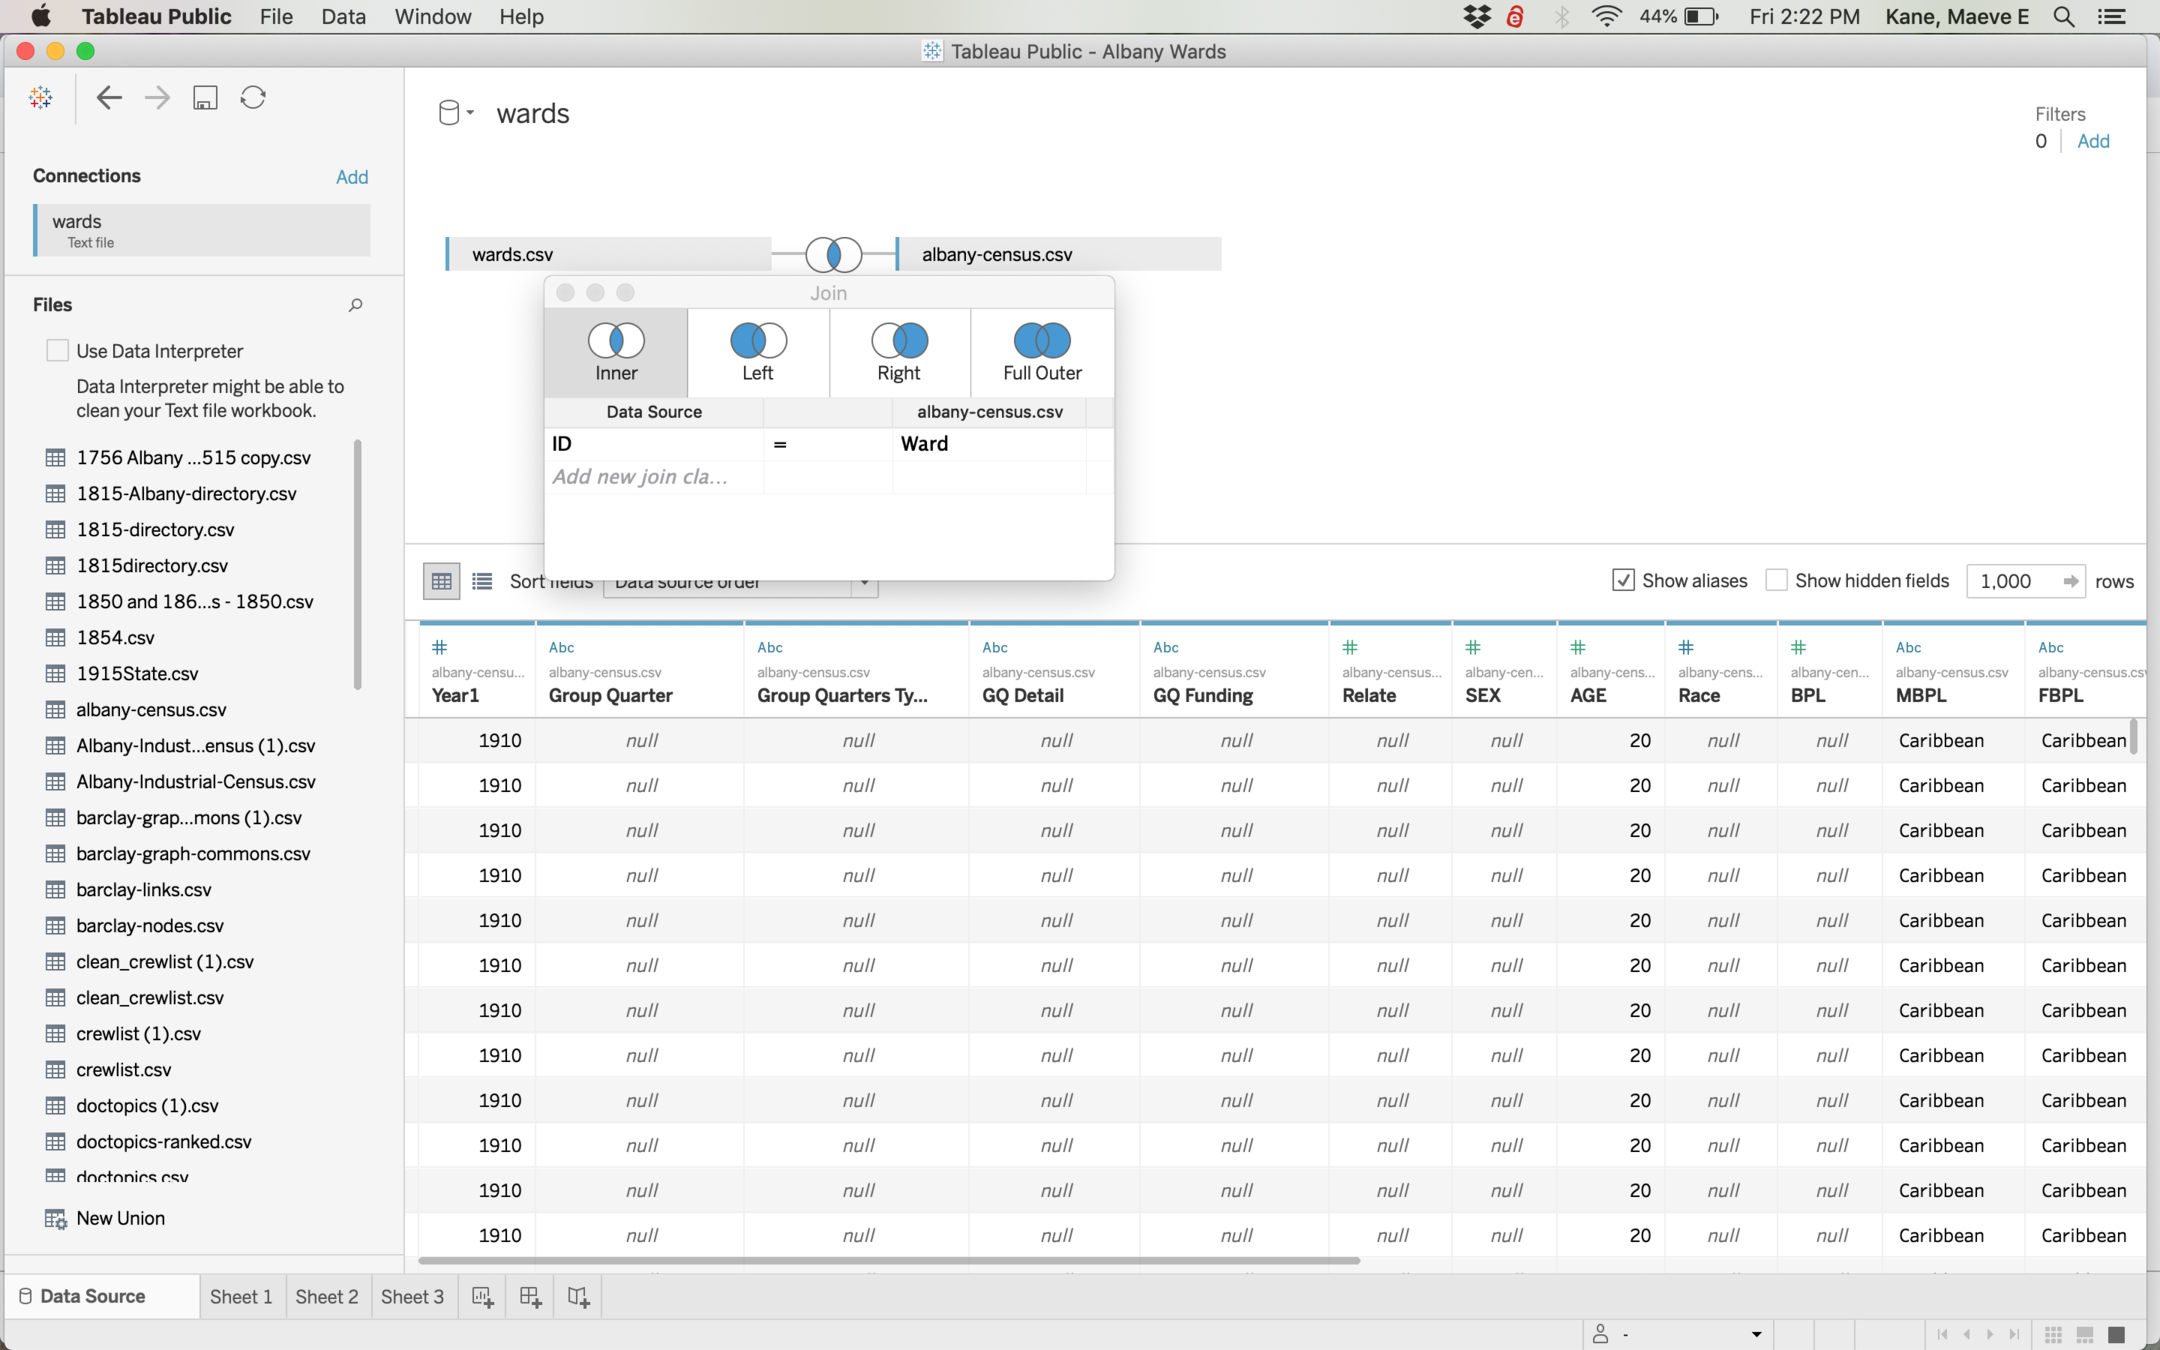
To connect your ward shapes to another dataset, you'll need to add the new dataset with Data > New Data Source. Then tell Tableau how the two files are related by clicking the Join icon and telling Tableau which columns contain the same information (Ward ID and Ward in the census file here)