D3js
The JQuery of SVG
Hi, I'm Michael Mann

Software Engineer at NLP Logix
Who is this guy and why is he talking about D3
- I am available and willing
- Katie asked me to
- D3 is a useful abstraction to SVG (Scalable Vector Graphics)
- I have used D3 to produce some useful prototypes, so I thought I would share what I've learned with people I've never met
To first understand D3 we must first understand SVG
Scalable Vector Graphics (SVG) is an XML-based vector image format for two-dimensional graphics with support for interactivity and animation. The SVG specification is an open standard developed by the World Wide Web Consortium (W3C) since 1999.
In other words
SVG is a declarative way to draw, style, and animate shapes and text in the browser
Why is SVG Useful
- A W3C Standard
- Resolution Independence
- Save an HTTP request for a resource if created client side
- SVG's can be compressed, styled, scripted, animated, and transformed
- Can be generated both client and server side
- You can build data-visualizations which are all the rage
What can I draw
Wow a rotating Elipse
<svg xmlns="http://www.w3.org/2000/svg"
     xmlns:xlink="http://www.w3.org/1999/xlink">

   <ellipse cx="150" cy="75" rx="10" ry="40" fill="blue">
      <animate attributeName="rx" begin="G.click" end="R.click" dur="4s" values="10;110;10"
               repeatCount="indefinite"/>
   </ellipse>
   <g id="G">
      <rect x="85" y="130" height="20" width="60" fill="green"/>
      <text x="90" y="148" font-size="20" fill="white">GO</text>
   </g>
   <g id="R">
      <rect x="150" y="130" height="20" width="60" fill="red"/>
      <text x="155" y="148" font-size="20" fill="white">STOP</text>
   </g>
</svg>
Ok, so what is D3.js an why should I care
D3.js is a JavaScript library for manipulating documents based on data. D3 helps you bring data to life using HTML, SVG and CSS. D3’s emphasis on web standards gives you the full capabilities of modern browsers without tying yourself to a proprietary framework, combining powerful visualization components and a data-driven approach to Document Object Model (DOM) manipulation.

You can do awesome stuff like this
Elements of D3
- Selection
- Bind data
- Scales, Domain, and Range
- Axes
- Animation
- Layouts
Selection
D3 has a CSS Level 1 selector engine similar to JQuery. D3 Implements a method chaining approach to the API
// Uses the selector engine to find an element with id foo and append a svg node to it
var svg = d3.select("#foo").append("svg");

// returns an empty reference to all rect svg objects which may or may not exist yet
var rects = svg.selectAll("rect");

//example of method chaining
svg.selectAll("text")
   .data(data)
   .transition()
   .duration(2000)
   .ease("linear")
   .text(function(d) {
      return d;
   })
   .attr("x", function(d, i) {
      return xscale(i) + xscale.rangeBand() /2;
   })
   .attr("y", function(d, i) {
      return h - yscale(d) + 24;
   });
Binding Data
This is the heart of d3 where the data drives the visualization
// Uses the selector engine to find an element with id foo and appends a svg element to it
var svg = d3.select("#foo").append("svg")

// returns an empty reference to all rect svg objects that we are binding the data to
svg.selectAll("rect")

      //bind the data to the rect references
      .data(data)

      //enters placeholder nodes for what we are going to append
      .enter()

      // append rect svg objects to the svg element for rendering in the DOM
      .append("rect")
Scales, Domains, and Ranges oh my
Scales are functions that map from an input domain to an output range
Scales, Doman, and Ranges
The input domain are the range of values and the ranges are what we map them to in terms of pixels on the screen; for example if we have a bar chart then the domain for Y would be the {smallest value, largest value}, and the range might be {0, the height of the svg}
//using a linear scale the range of input values is 0-100 and we only want the
//element to render 0-10 pixels tall in the case of a rect
var scale = d3.scale.linear().domain([0,100]).range([0,10]);

//The function below returns the value of 4.2
scale(42)
Axes
//specifies an ordinal scale and the ouput range is from 0 to the width of the svg
//with .1 padding between the bars
var xscale = d3.scale.ordinal().rangeRoundBands([0, width], .1);

//a linear scale with an output range constrained by the coordinates {height, 0},
//SVG 0,0 coordinate starts in the upper left corner
var yscale = d3.scale.linear().range([height, 0]);

var xAxis = d3.svg.axis().scale(xscale).orient("bottom");
var yAxis = d3.svg.axis().scale(yscale).orient("left").ticks(10, "%");

//since x is ordinal the domain is just the letter property
xscale.domain(data.map(function(d) { return d.letter; }));

//the y domain is in the range of {0, max frequency}
yscale.domain([0, d3.max(data, function(d) { return d.frequency; })]);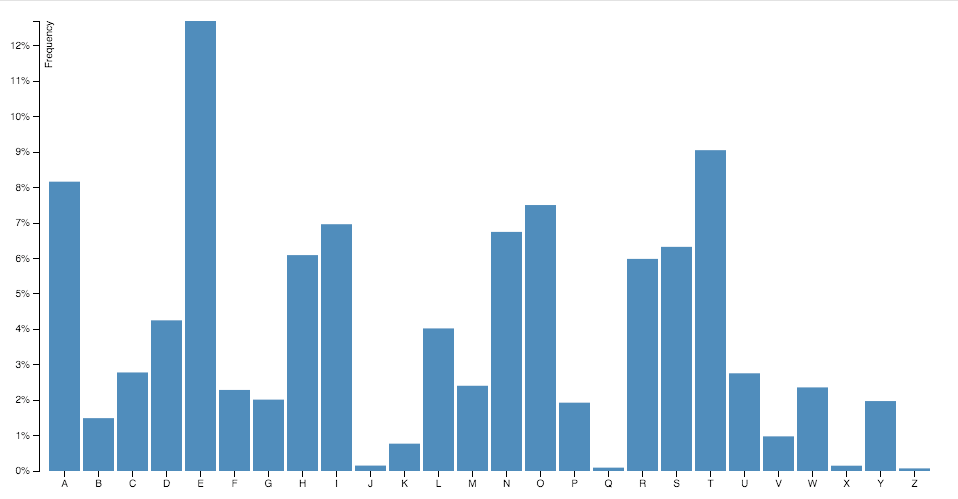
Animation
Animations are performed through a concept called transitions
//select all rect in the SVG
svg.selectAll("rect")
//bind the data
.data(data)
//start the transition
.transition()
//create a staggered delay for each rect
.delay(function(d, i) {
return i / data.length * 1000;
})
// the duration of the animation
.duration(100)
.attr("y", function(d) {
return h - yscale(d);
})
.attr("height", function(d) {
return yscale(d);
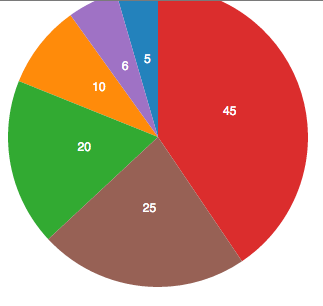
});Layouts

Contrary to what the name implies, D3 layouts do not, in fact, lay anything out for you on the screen. The layout methods have no direct visual output. Rather, D3 layouts take data that you provide and remap or otherwise transform it, thereby generating new data that is more convenient for a specific visual task. It’s still up to you to take that new data and generate visuals from it.
Abbreviated Code Example
var w = 300,
    h = 300,
    dataset = [ 5, 10, 20, 45, 6, 25 ],
    outerRadius = w / 2,
    innerRadius = 0,
    arc = d3.svg.arc()
	    .innerRadius(innerRadius)
	    .outerRadius(outerRadius),
    pie = d3.layout.pie(), // here is out layout
    color = d3.scale.category10(),
    svg = d3.select("body") // create the svg
	    .append("svg")
	    .attr("width", w)
	    .attr("height", h),
    arcs = svg.selectAll("g.arc")
	      .data(pie(dataset)) // here we go, transforming the data
	      .enter()
	      .append("g")
	      .attr("class", "arc")
	      .attr("transform", "translate(" + outerRadius + "," + outerRadius + ")");

//Draw arc paths
arcs.append("path")
    .attr("fill", function(d, i) {
    	return color(i);
    })
    .attr("d", arc);
Result
Demo Time
Thank You
References
- Interactive Data Visualization for the Web
- http://bl.ocks.org/ - D3 hosted examples
- https://github.com/mbostock/d3/wiki - D3 Wiki
- SVG Primer
- Twitter - @StarsUponTharz
- LinkedIn - https://www.linkedin.com/in/mmann2943
- Email - michael.mann@nlplogix.com