Large-scale Graph Visualisations in the Browser
Nicolas JOSEPH
nicolas@linkurio.us


7 May 2015 | London
Goals

- You will know why large scale visualizations are importants
- You will be able to choose wisely between technologies
- You will be able to solve some challenges raised by graph visualization
Presentation
- 4 employees
- Graph visualization software for humans
- Founded 2013
- Full stack JavaScript Engineer
- Worked at the French Departement of Defense
- Worked at Quandora, NY based start up

Why large scale graph visualization in the Browser?
Why Graph Visualization ?
Jean
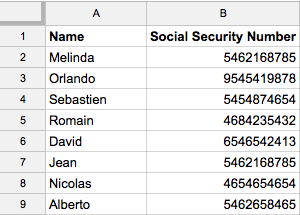
Social Security
Number
Melinda
has_number
has_number
Why in the browser ?
- Cost of deployment and maintenance
- Javascript Engine performance
- Enable collaboration through the Web
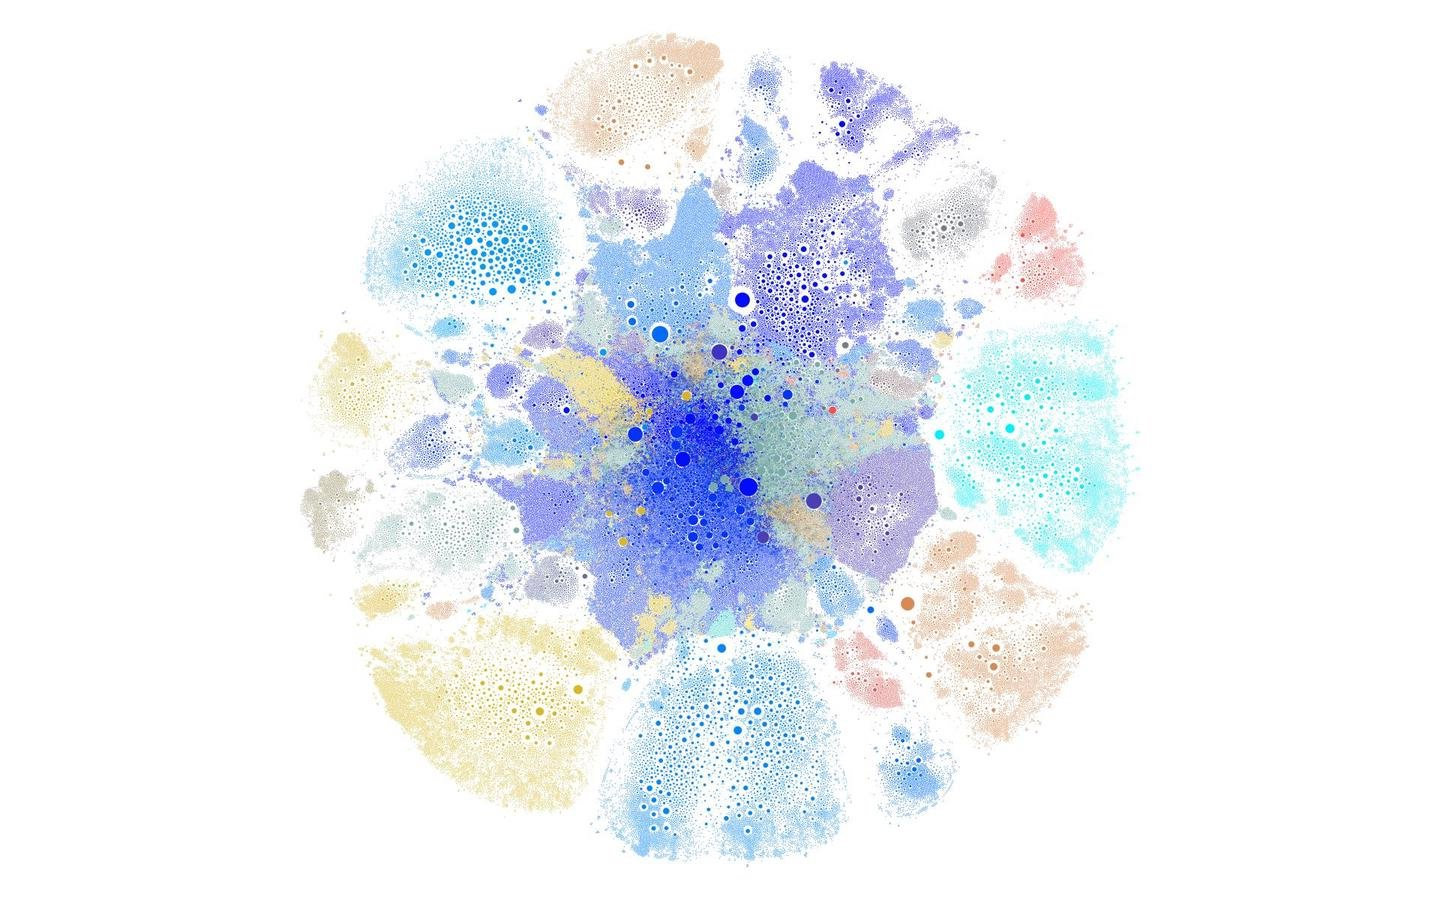
Why large scale ?
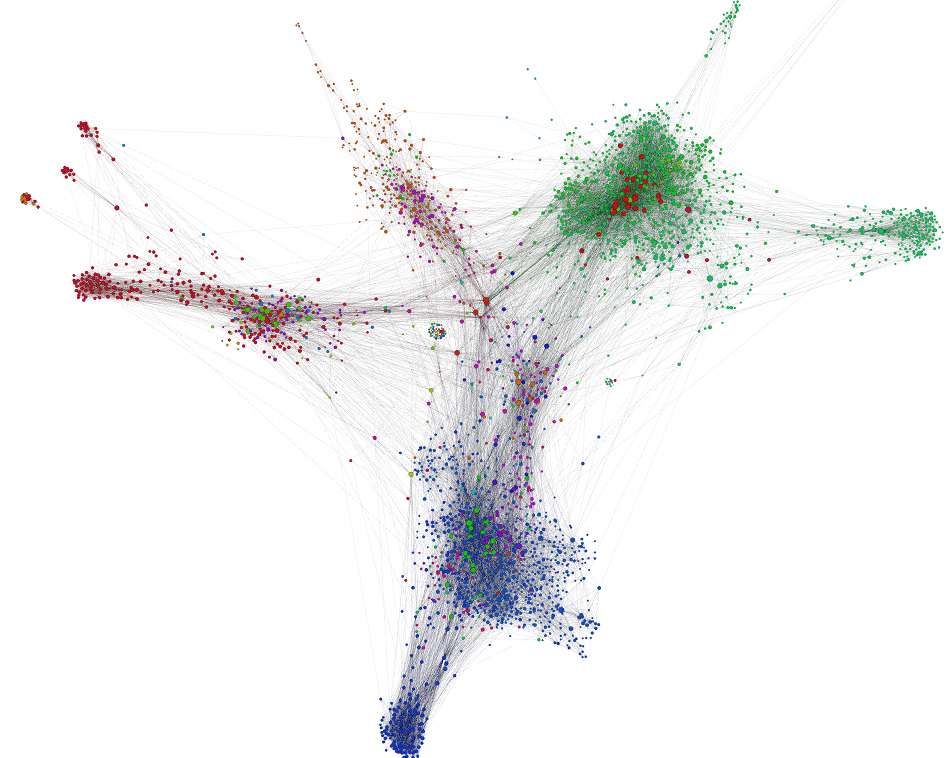
Spot Clusters
What was on the market
- Sigma.js
- Keylines
- Tom Sawyer
- Cytoscape
- Graph Alchemy
- VivaGraphjs
- ...
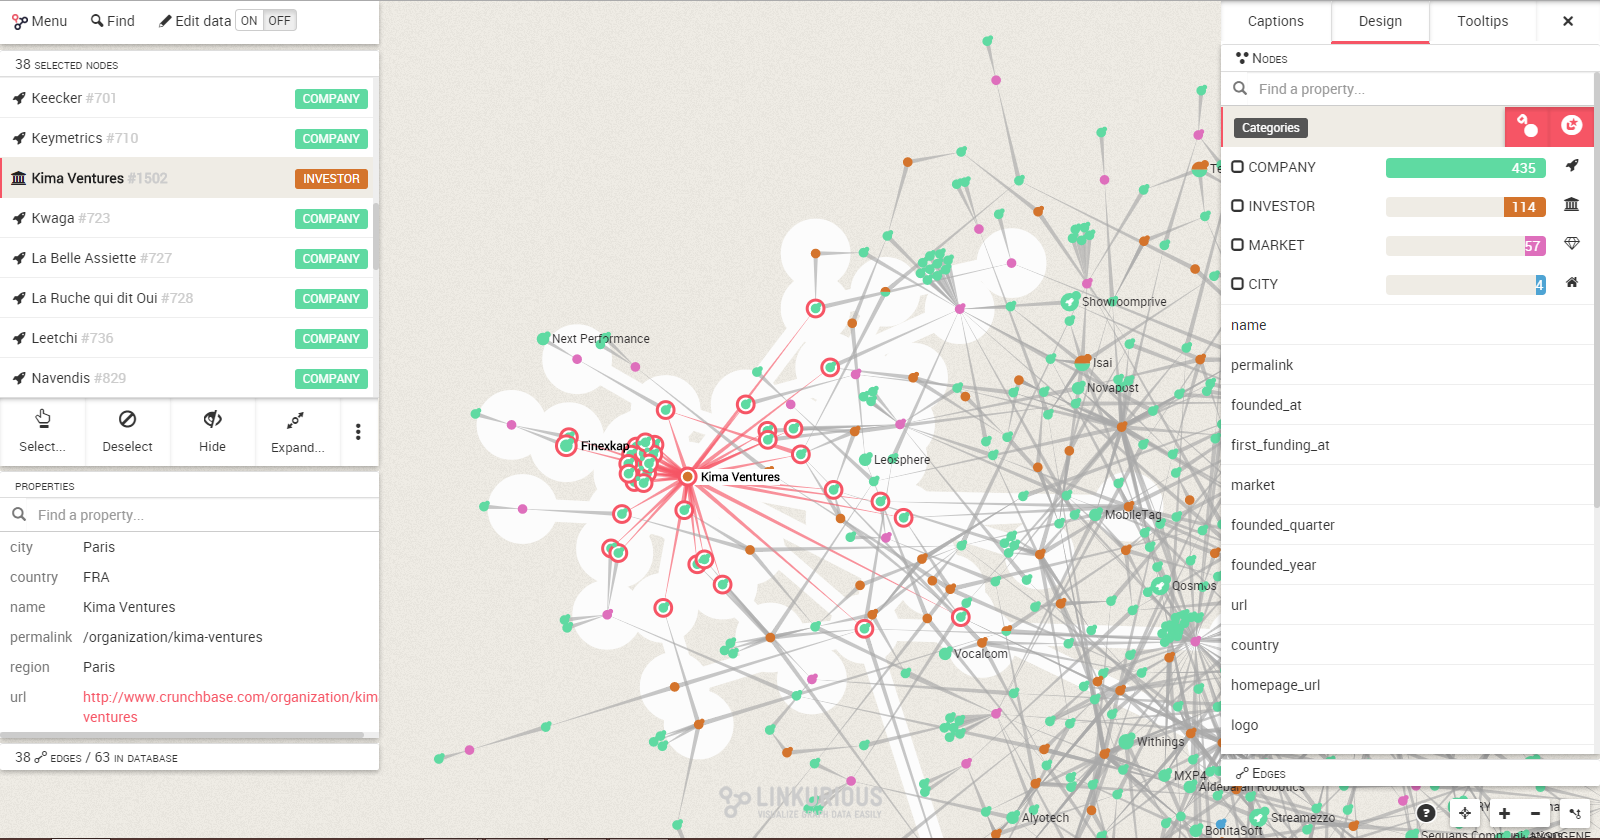
Linkurious.js
Open Source (GPLv3, commercial)
Core is sigma.js augmented with multiple plugins
Modular Architecture.
Challenges
- Display a lot of data
- Interact with large graphs
- Keep the experience smooth
Large Graphs
1/3
Small

Medium

Large
How can we display display large graph ?
Rendering engines technologies
SVG
Canvas
WebGL
More Built-ins
interactions
Quicker Rendering speed
Linkurious.js
| SVG | Canvas | WebGL | |
|---|---|---|---|
| Nodes | 500 | 5 000 | 20 000 |
| Edges | 1 000 | 8 000 | 30 000 |
| Speed |
Recommended display on an average laptop
Enable Graph interaction
2/3
How is the graph made interactive ?
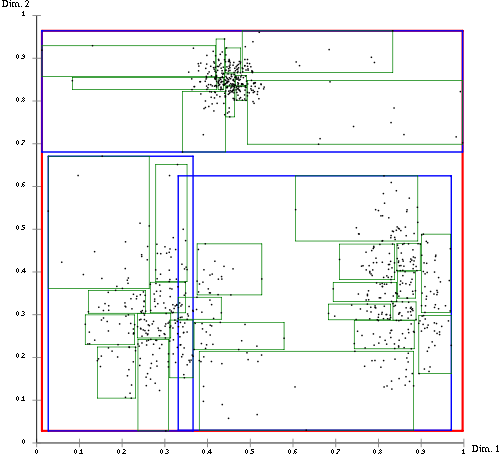
Basic Solution
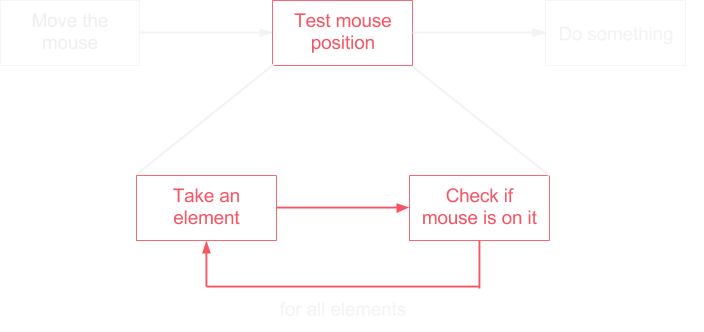
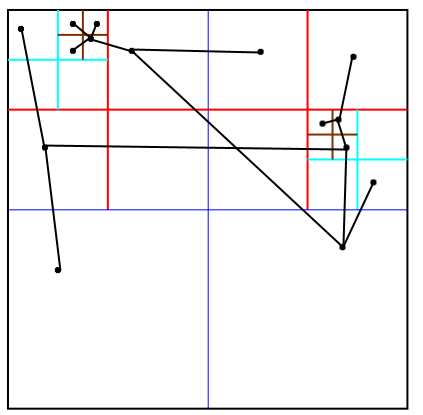
Spatial Indexing
Quad Tree
Credits to Berkley
1
2
3
4
1
2
3
4
Graphical Space
Tree Representation
Spatial Indexing
Quad Tree
Credits to Berkley
Graphical Space
Tree Representation
Spatial Indexing
Quad Tree
Credits to Berkley
Graphical Space
Tree Representation
Spatial Indexing
Quad Tree
Credits to Berkley
Graphical Space
Tree Representation
Spatial Indexing
What about Edges ? R-Tree in developement
Rendering engines and built-ins interactions
| Technology | SVG | Canvas | WebGL |
|---|---|---|---|
| Built-ins interactions |
Keep the UI responsive
3/3
E.g: Linkurious Enterprise
How to keep the interface responsive while computing ?
Use Web Workers
Basic JS
With Web Worker
- Do This
- Then do that
- finally execute this
- Create Web Worker
- Do this
- Do that
- Receive result
Main Thread
Web Worker
- Do something
- Compute something
- Send back result
Layouts
A layout is an algorithm consisting in ordering nodes in a graphical space so that the user can make sense out of its visualization
Force Directed layout
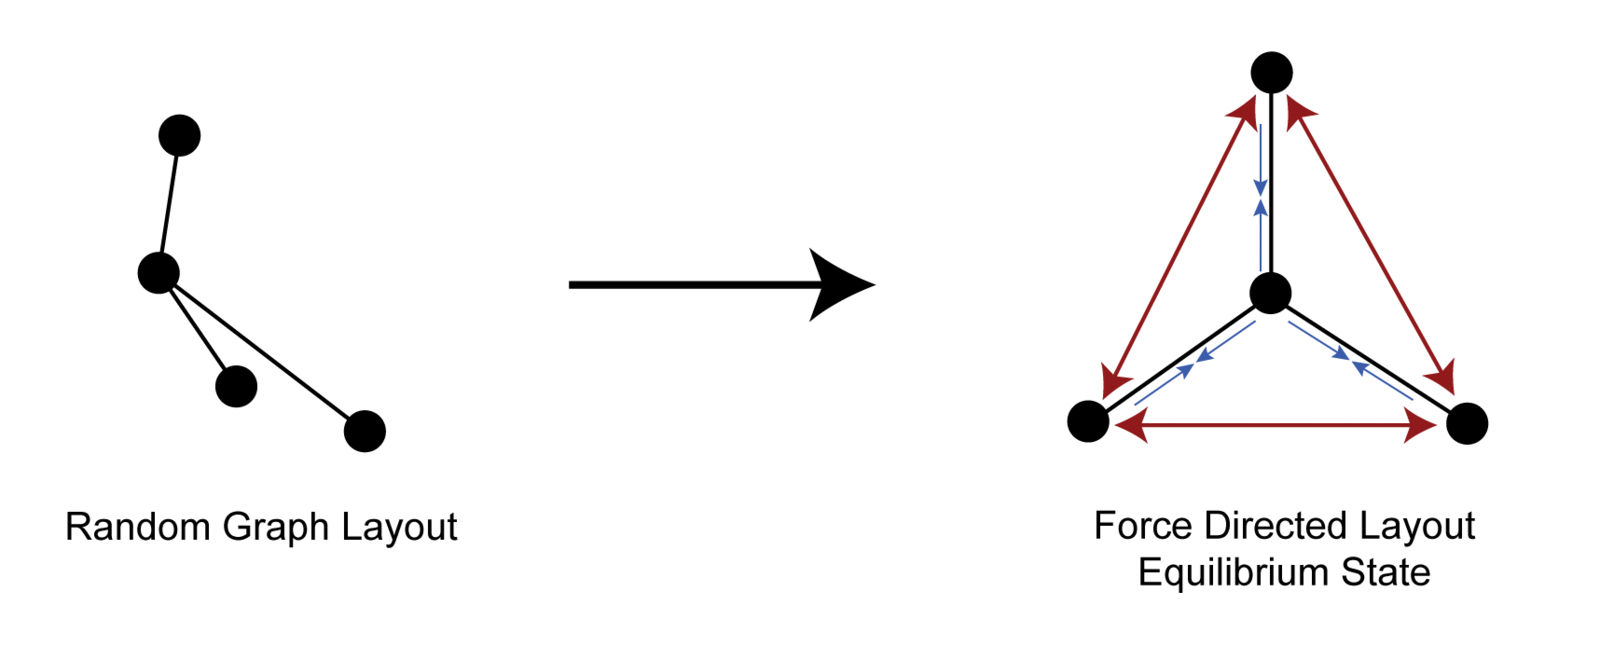
Nodes act as repulsive particles
Edges act as springs
Parallelize Computing
Compute Layout
| Technology | Rendering Capabilities | Built-in interactions | Developer friendly |
|---|---|---|---|
| SVG | |||
| Canvas | |||
| WebGL |
Conclusion
- Optimise data structure to improve performance
- Use Web workers for lengthy computations to keep the UI responsive
Thank you
@NicolasJosephIt
Callicles
@
nicolas@linkurio.us
Linkurious.js:
https://linkurio.us/toolkit
Slides:
https://slides.com/nicolasjoseph/largescalevis
Download for free
Spatial Indexing
R - Tree