HOW TO DEAL WITH OBSERVATIONAL DATA FOR (HYDROLOGICAL) MODELLING PURPOSES
ADRIANO FANTINI
PhD student at the University of Trieste and ICTP, Trieste, Italy
afantini@ictp.it
http://bit.ly/2s80MjF
Which observations do you need for hydrology?
- Precipitation (possibly hourly, esp. for small basins)
- Temperature
- Snow
- Elevation data
- Discharge / water stage
- Land use data
Gridded:
- Precipitation
- Temperature
- Elevation
- Land use
Dense or sparse?
In-situ:
- Precipitation
- Temperature
- Discharge
- Water stage

Advantages
- Uniform availability, often global
- Compare easily with models
- Generally straighforward formats (e.g. NetCDF)
- Efficient processing
- Different variables on the same grid
- Usually quality-controlled
Gridded
Disadvantages
- Heavily dependent on gridding method
- Not suitable for comparison over specific points
- Usually derived from in-situ data
- Dataset resolution != actual resolution (!!!)
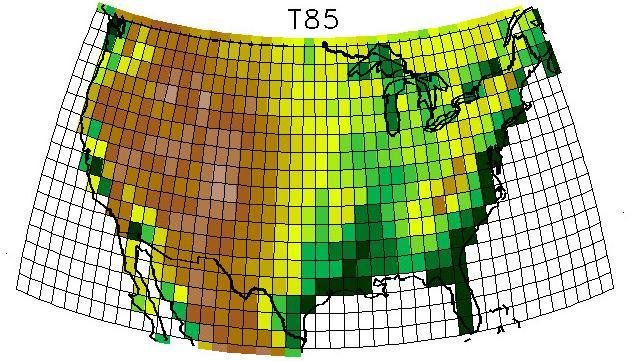
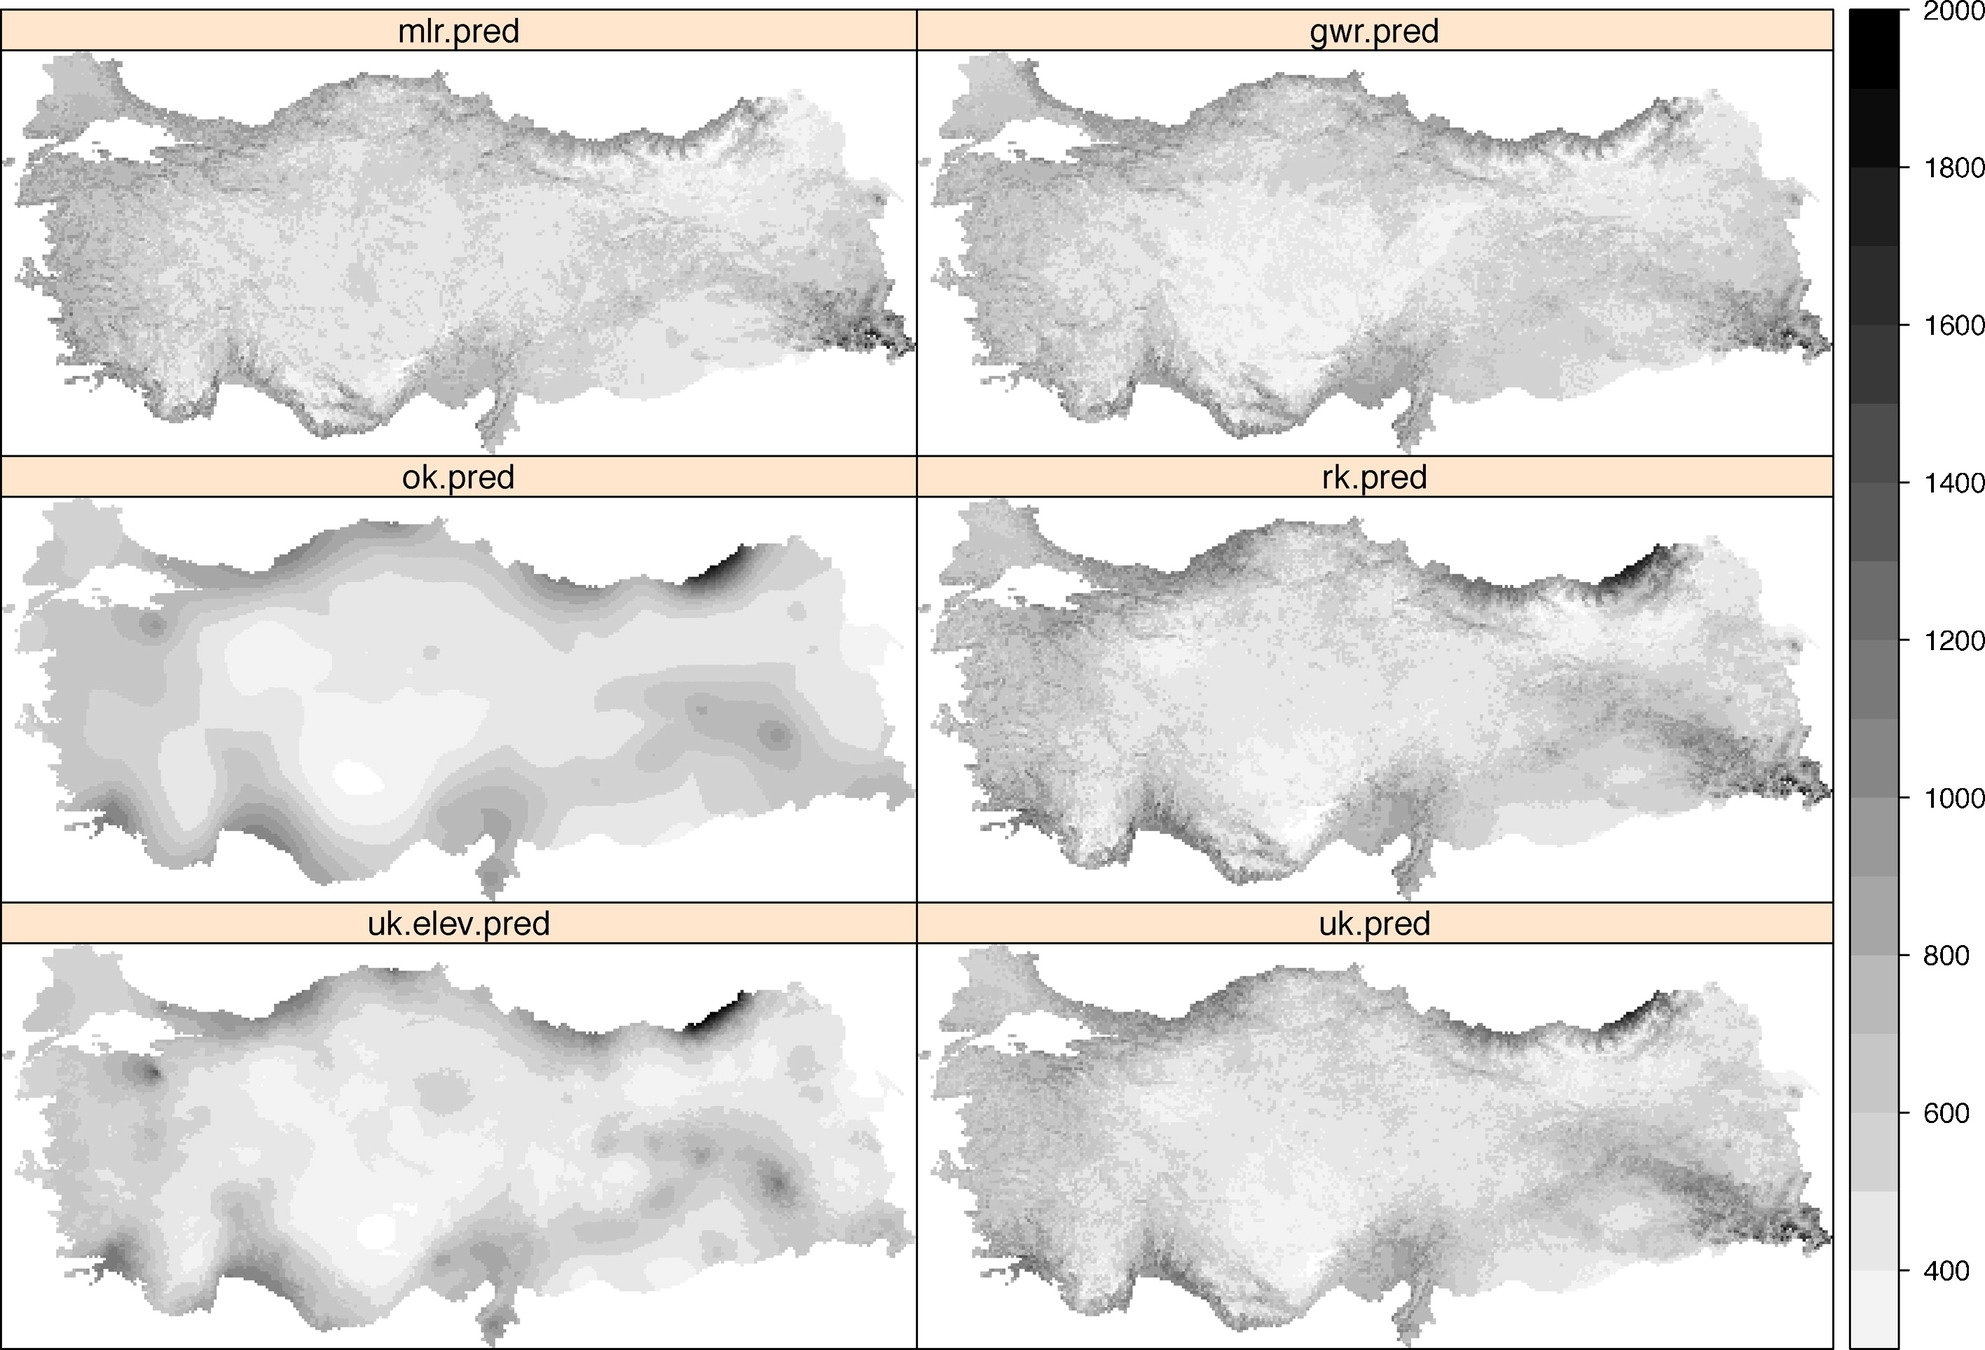
Basic categories:
- Inverse Distance Weighting
- Kriging
- Spline Interpolation
- Surface polygons
Gridding methods
CAN HAVE DIFFERENT RESULTS!
Mohr, 2008
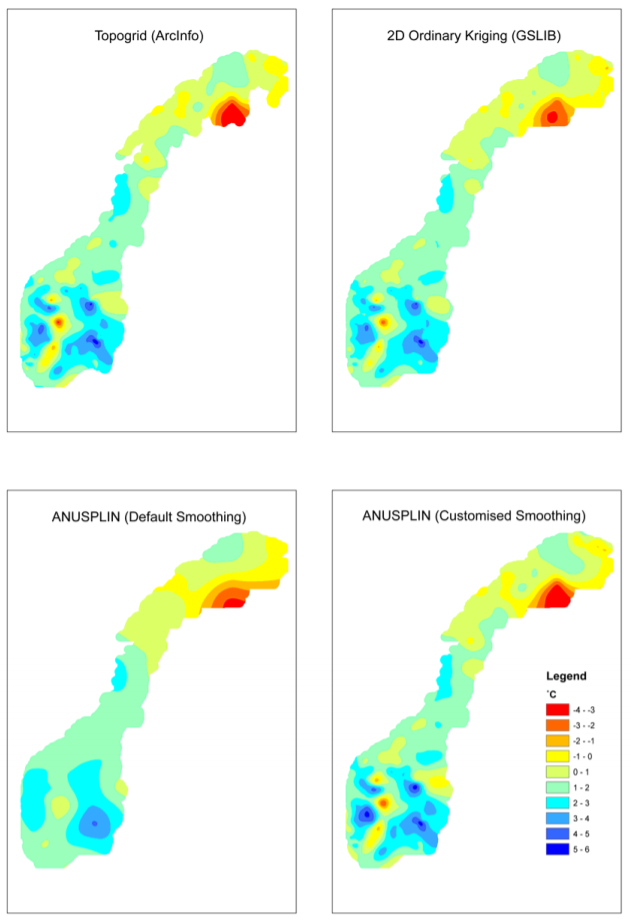
Basic categories:
- Inverse Distance Weighting
- Kriging
- Spline Interpolation
- Surface polygons
Gridding methods
CAN HAVE DIFFERENT RESULTS!
Hofstra, 2008
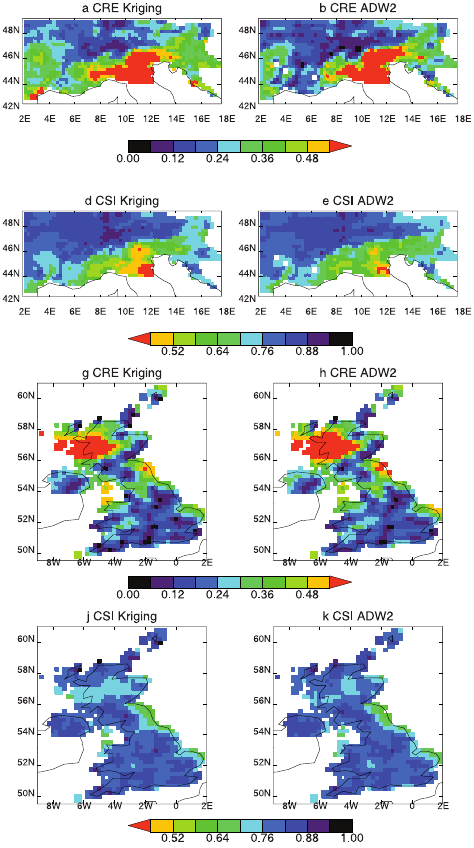
Bostan, 2012
Advantages
- No gridding/smoothing -> good for extremes
- Easy to compare with models (e.g. discharge at a given point)
- Do not hide anything from the user
- Dataset resolution == actual resolution
- Metadata!
In-situ
Disadvantages
- Scarse data availability
- Often in very weird formats
- Often lacking quality control
- Hard to compare with gridded (e.g. climate) models (PR, T)
Common problems with
in-situ measurements
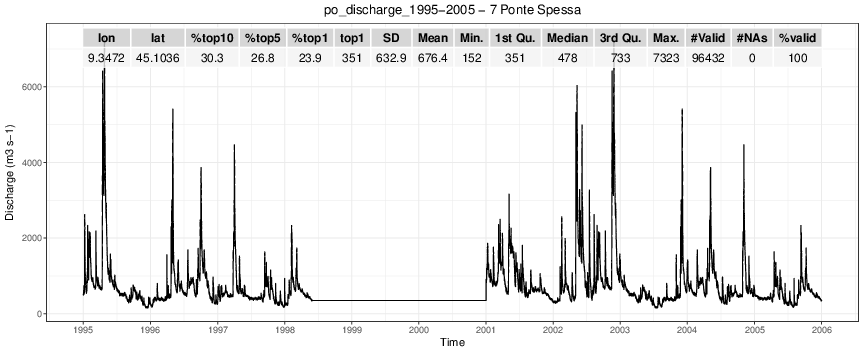
Temporal and spatial problems:
- Short timescale
- Missing periods
- Low station density
- Missing timesteps
Data quality problems:
- Breaks and inhomogeneities
- Manual measurement errors
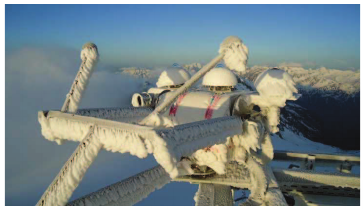
- Equipment errors and failures
- Weather-related measurement errors
Temporal and spatial problems
- Short timescale
- Low station density
- Missing timesteps
- Missing periods
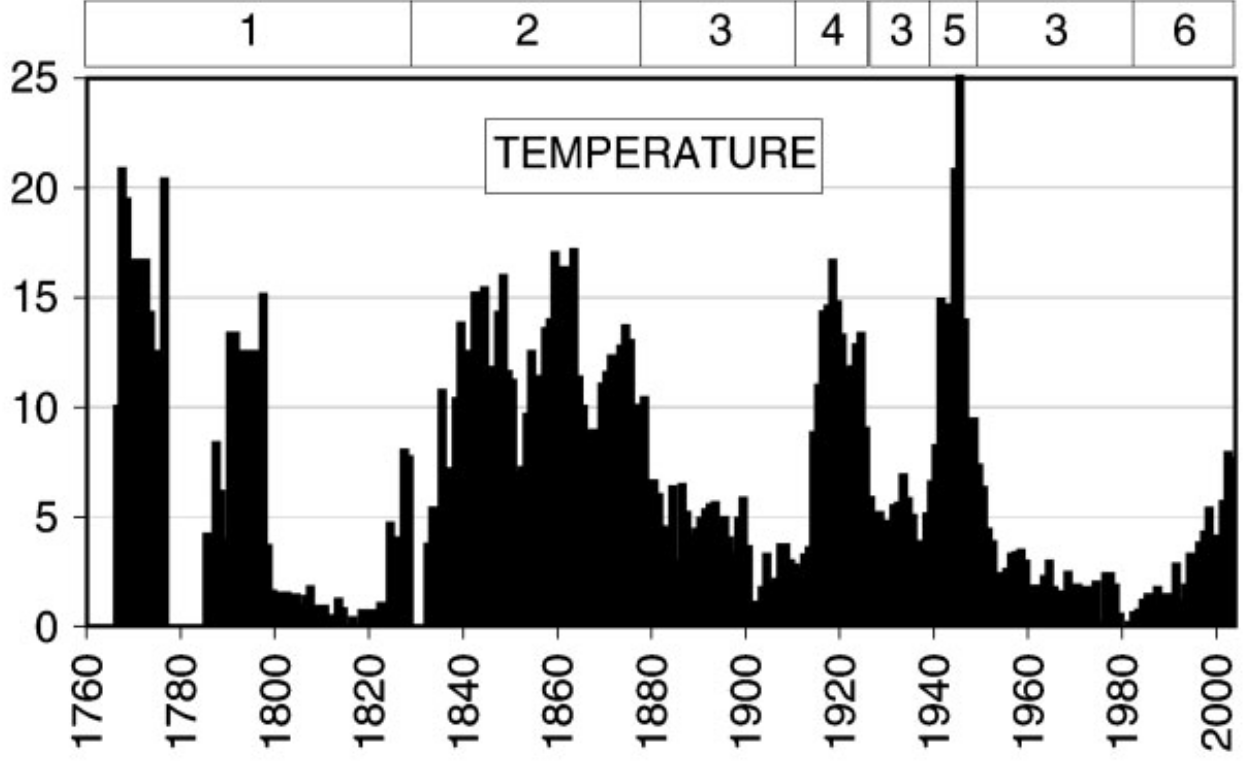
HISTALP database, Bohm et al., 2007
Data quality problems
- Manual measurement errors
- Equipment errors and failures
Inhomogeneities
?
- Changes in measurement time
- Station relocations
- Instrumentation upgrades
- Incorrect maintainance
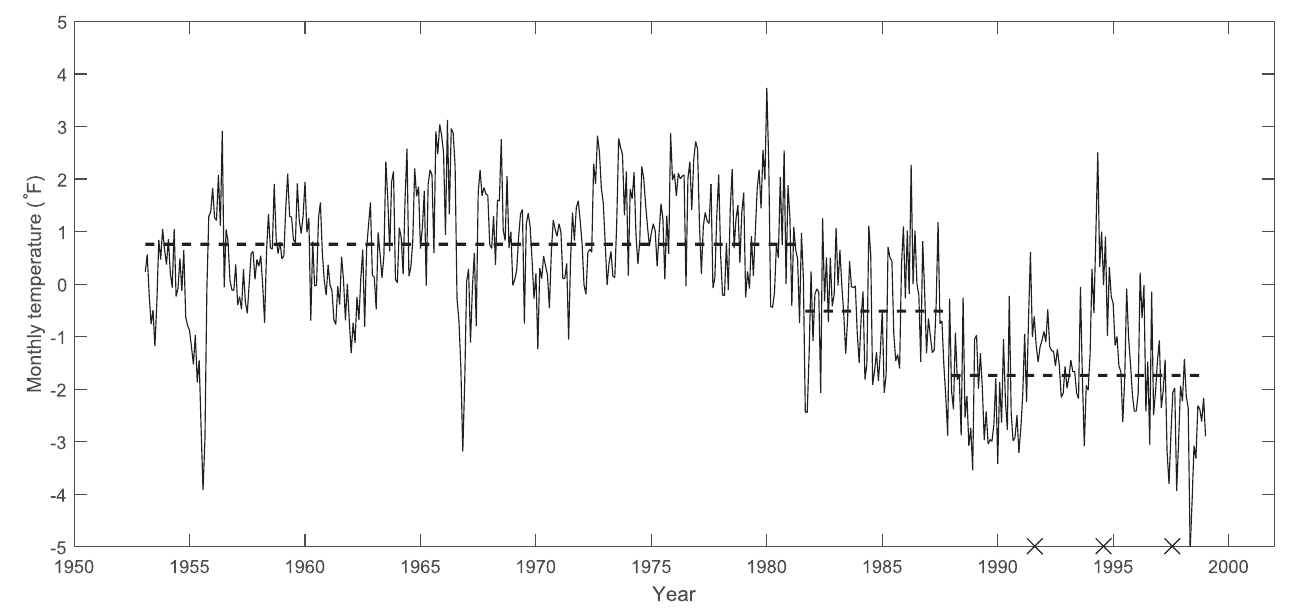
Hewaarachchi et al., 2016
Inhomogeneities
- Changes in measurement time
- Station relocations
- Instrumentation upgrades
- Incorrect maintainance
Data quality problems
- Weather-related measurement errors
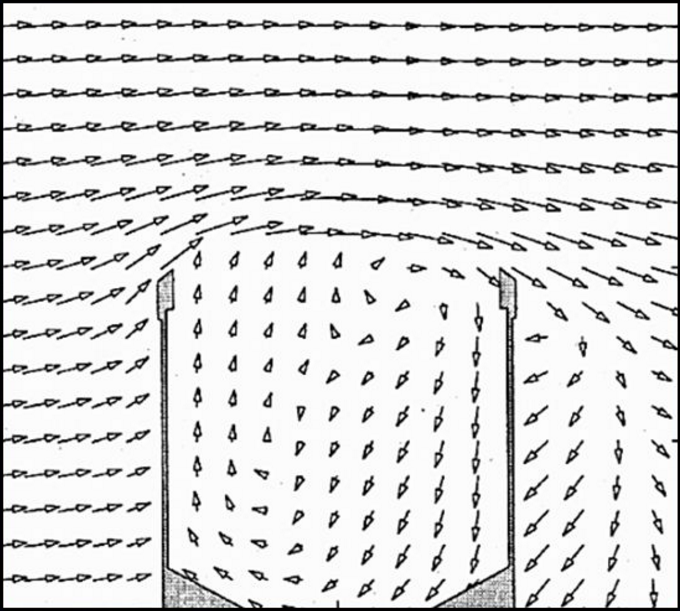
Nespor and Sevruk, 1999
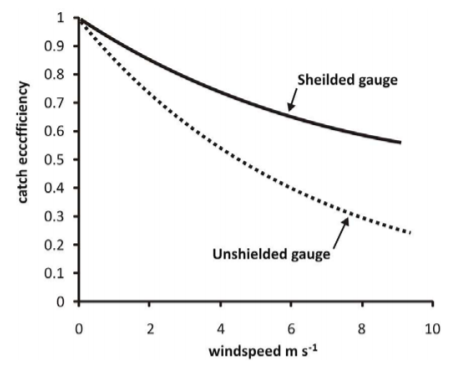
Macdonald and Pomeroy, 2008
>30% ?
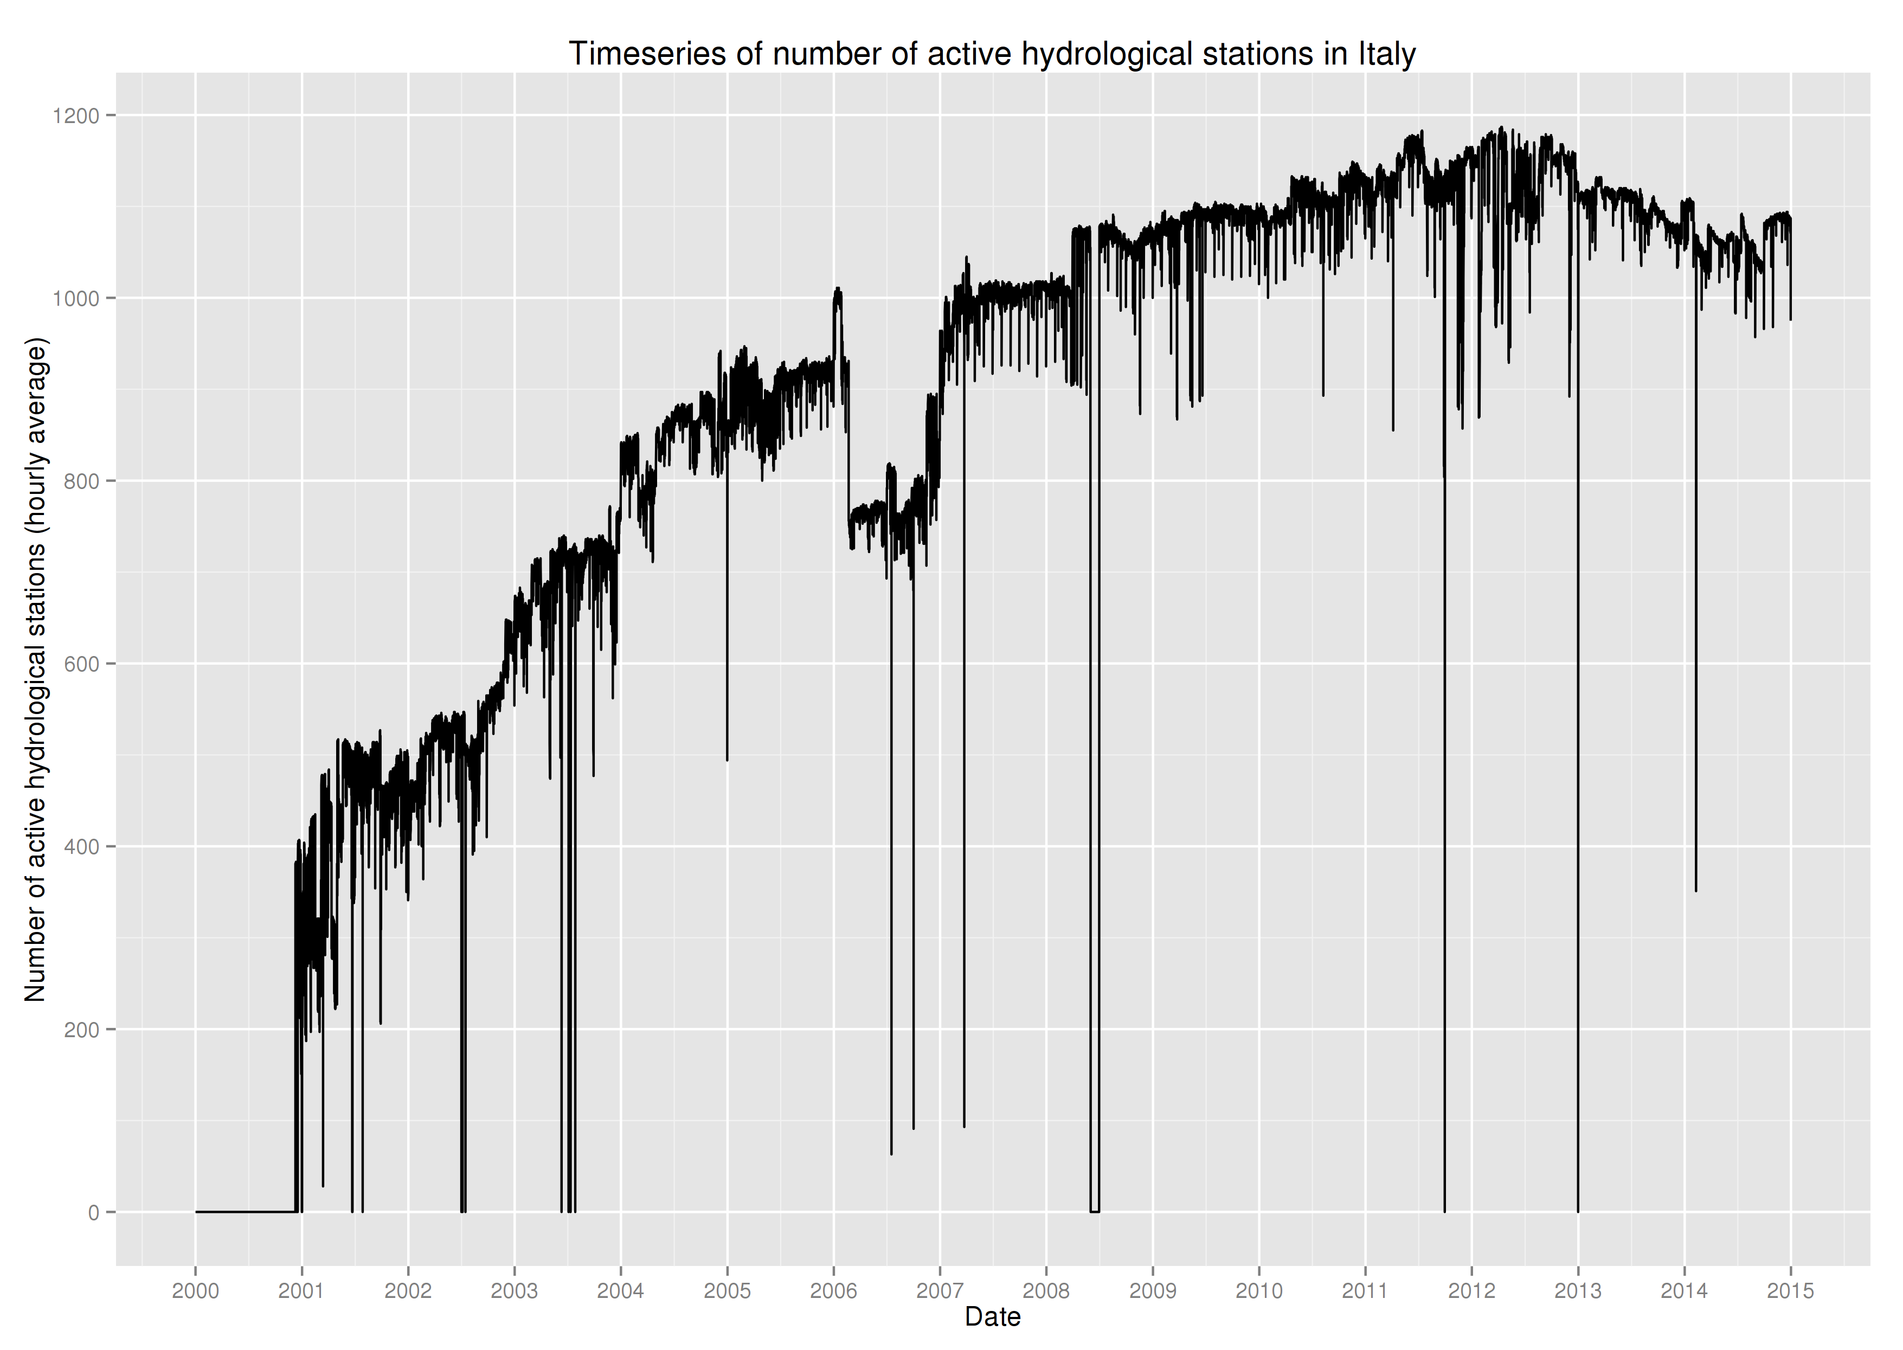
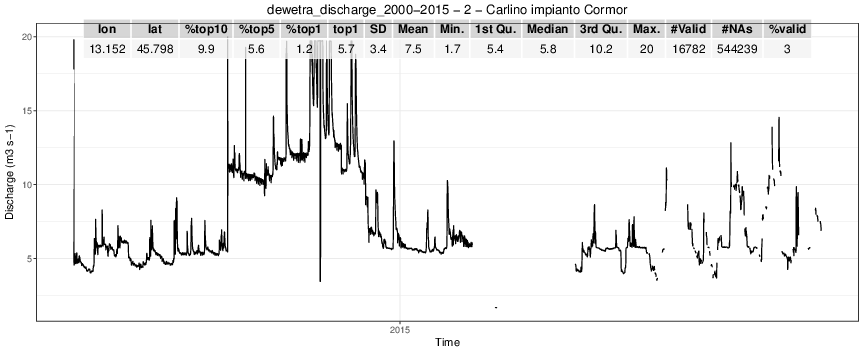
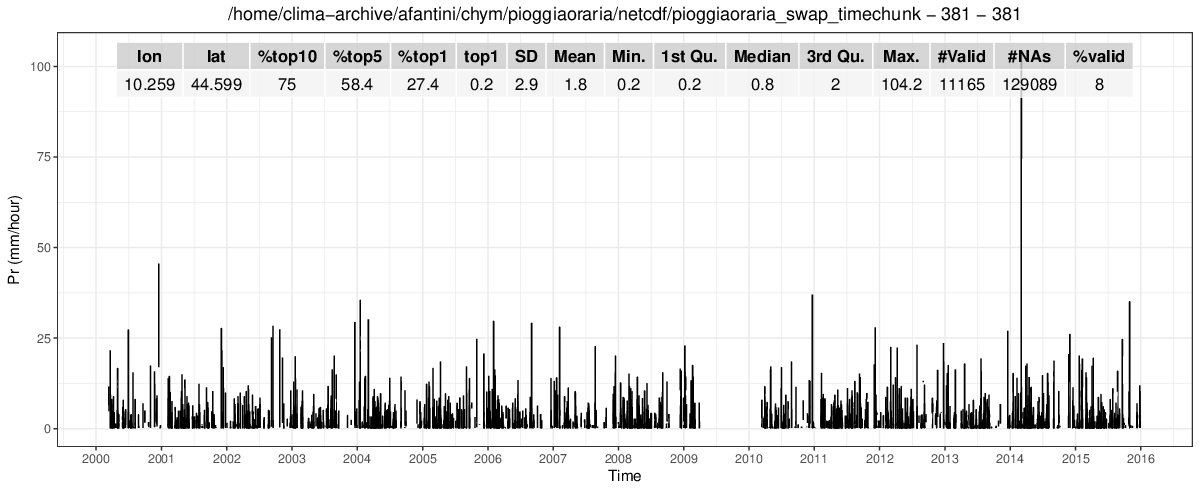
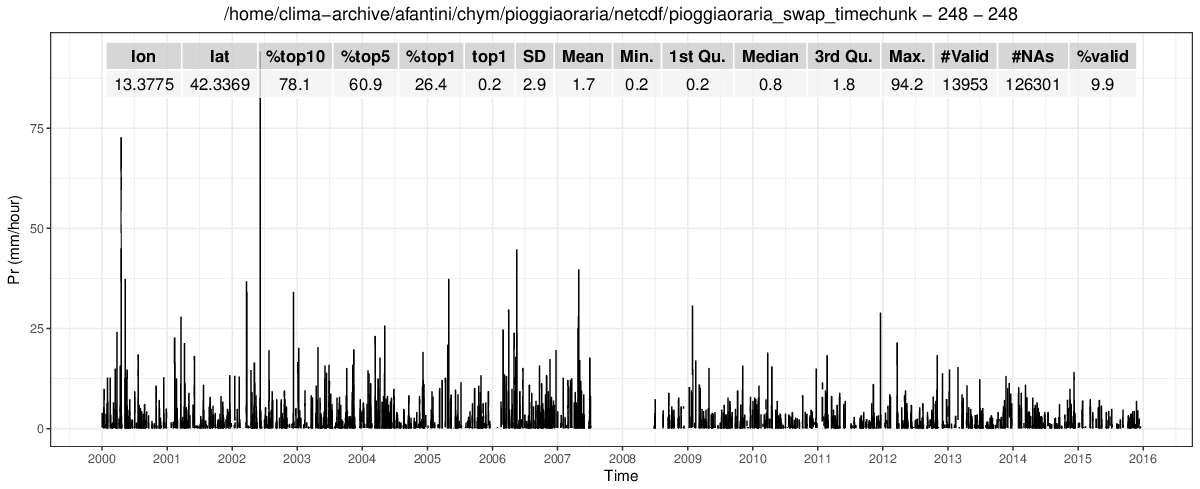
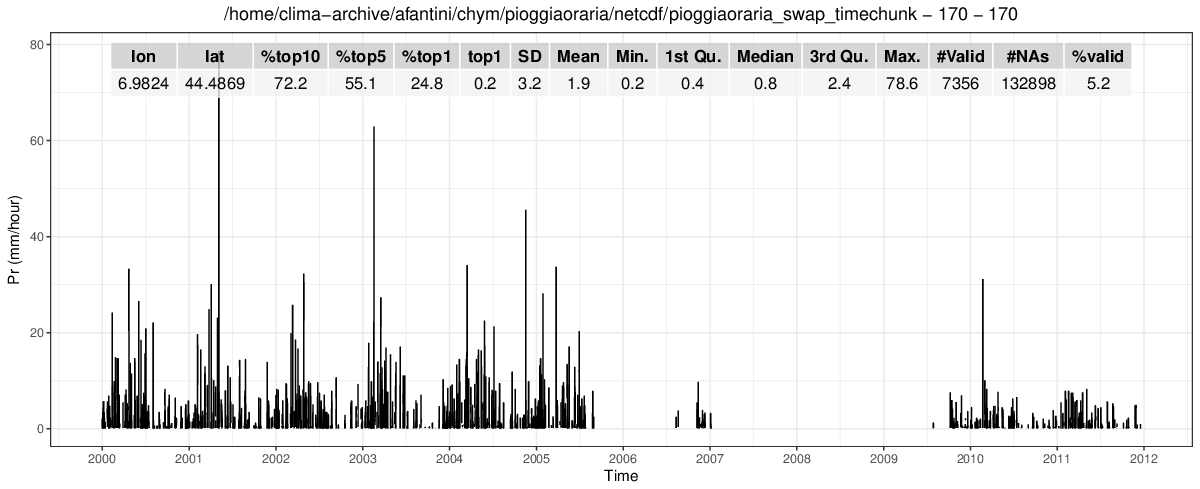
An in-situ example
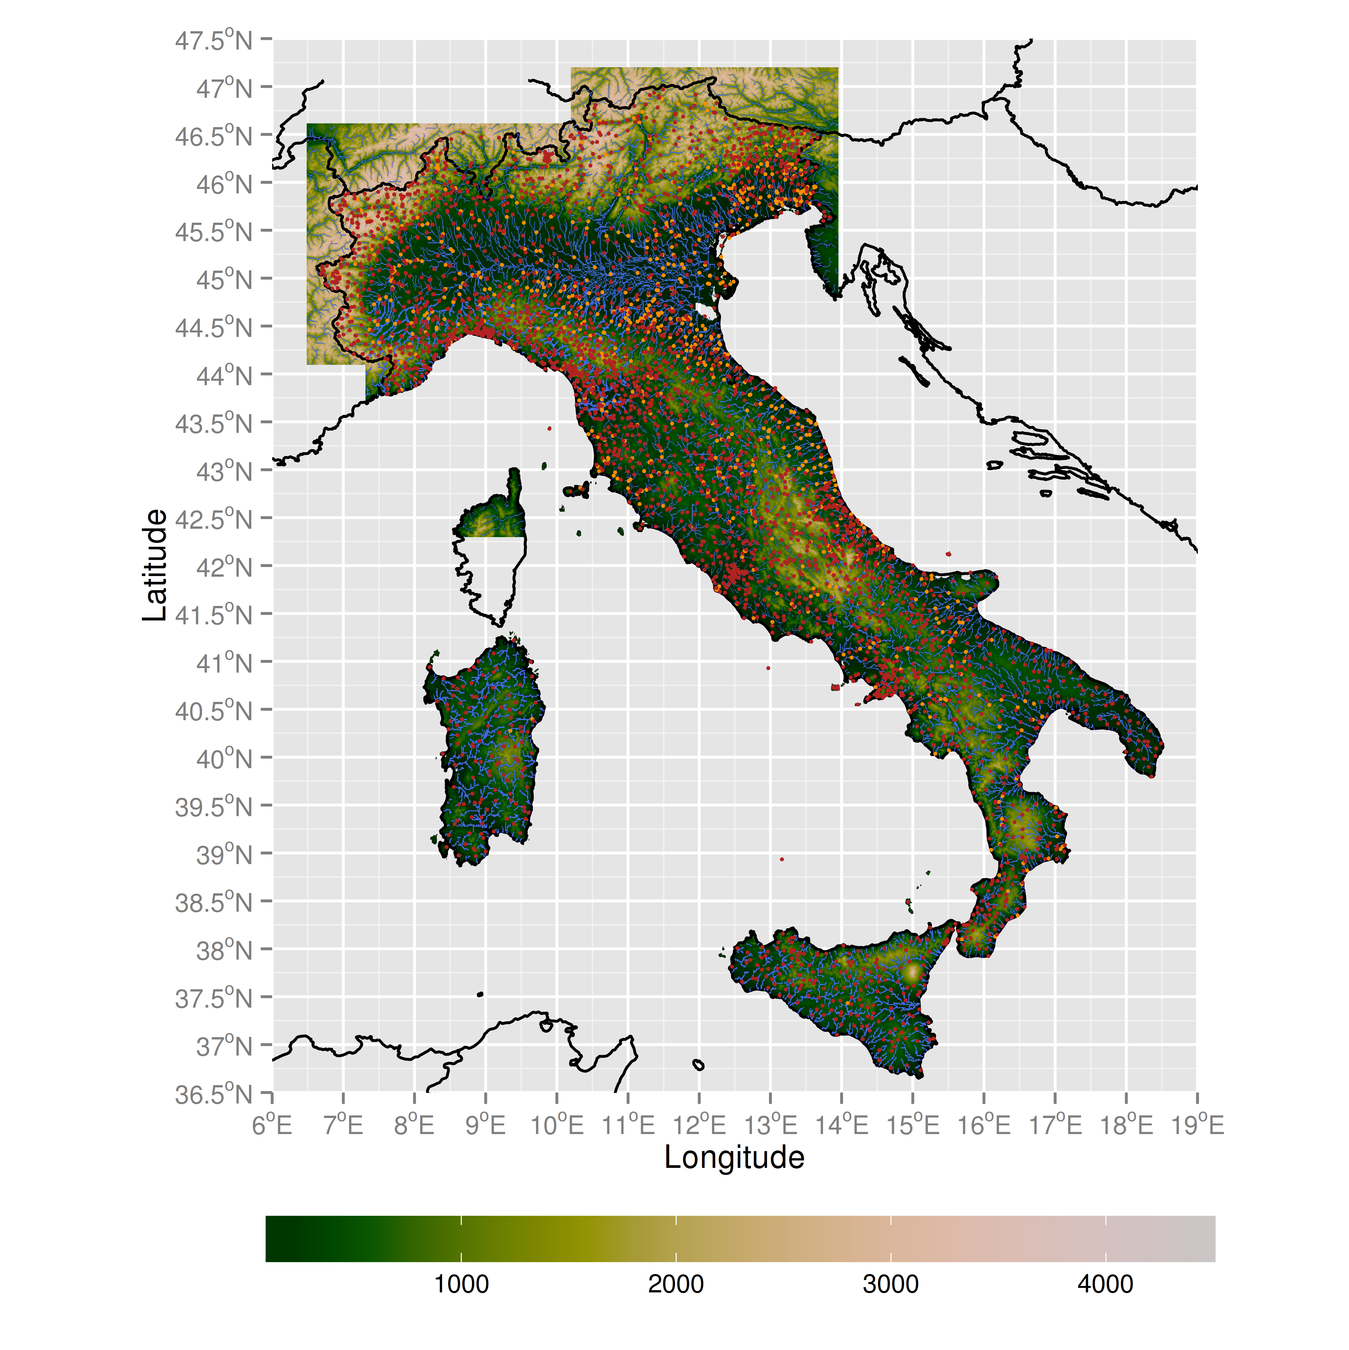
- Precipitation
- Hourly
- From different institutions
- ~2200 stations
- uneven spatial coverage
- 2000-2016
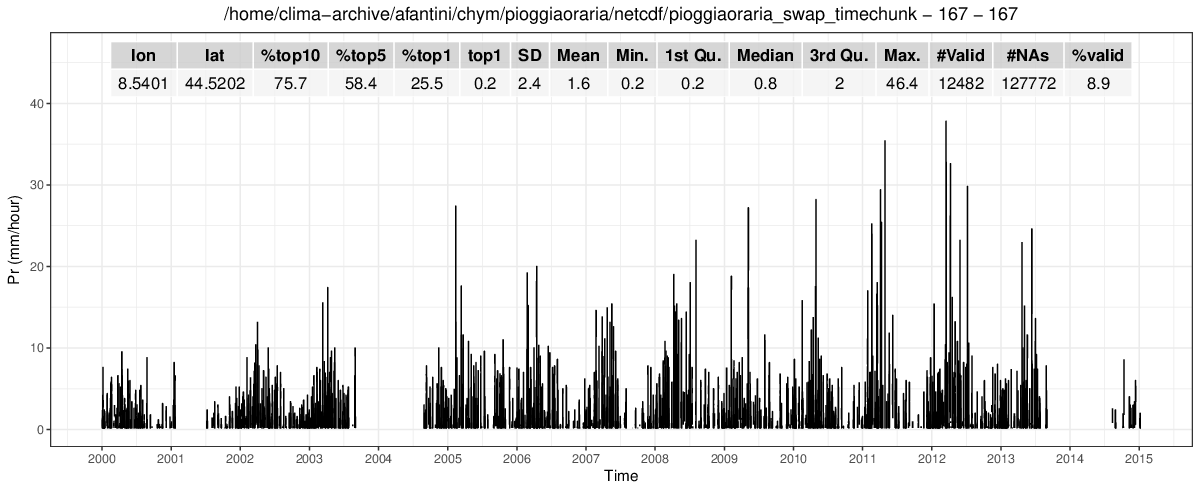
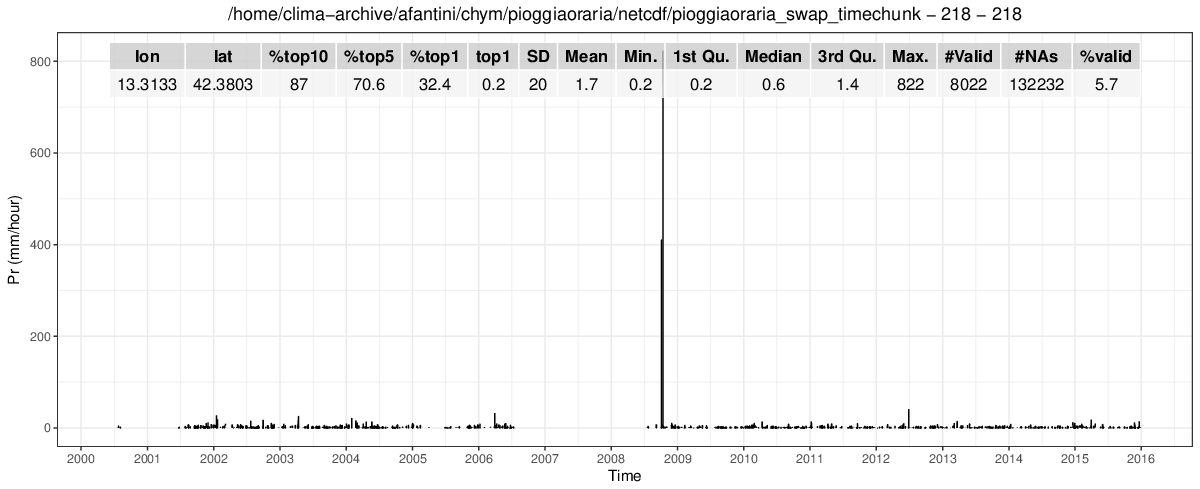
?
?
Timeseries are usually not enough to identify inhomogeneities and errors
Metadata
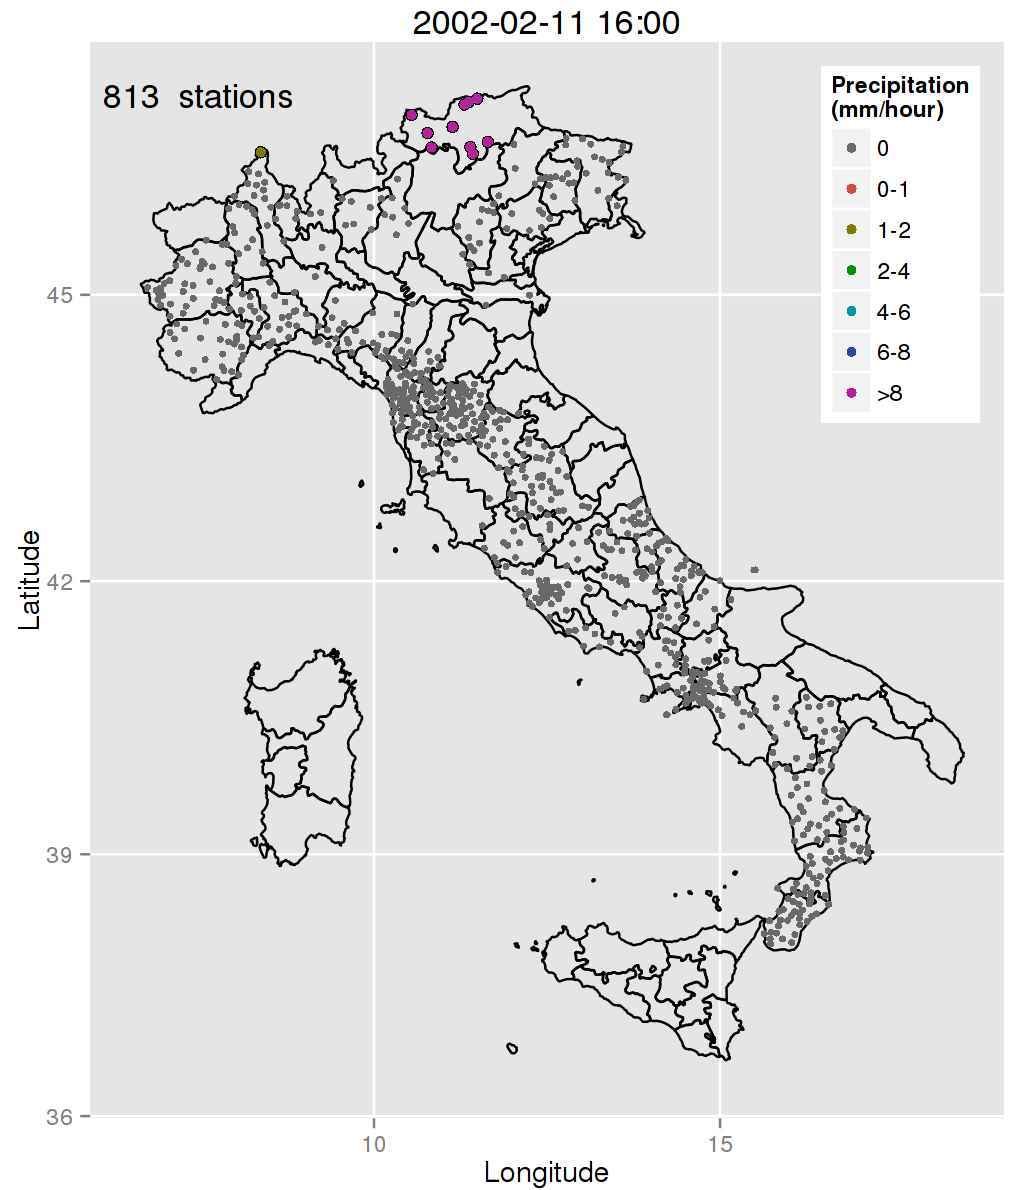
Spatial analysis
What can we do based on this?
- Cut outliers over a given fixed threshold
- Variable threshold based on SD or IQR
- Remove consecutive suspicious values
Metadata
all the information that is not data itself
- Gauge type and characteristics
- Station history (relocations, upgrades...)
- Recorded changes in station environment
- News about extreme events (hard to find for old data)
WE OFTEN DO NOT HAVE ACCESS TO THIS, AND IT'S EXTREMELY TIME CONSUMING
Spatial analysis
Maps + comparison to neighbouring stations
- Can be automated, once a criterion is chosen
- Possibilities for choosing reference stations: nearest neighbours, distance radius, height range, high correlation...
REQUIRES HIGH ENOUGH STATION DENSITY
HARD TO DO ON HIGHLY SPATIALLY VARIABLE FIELDS (e.g. PRECIPITATION) OR REGIONS (e.g. MOUNTAINS)
!
Even after correction sometimes...
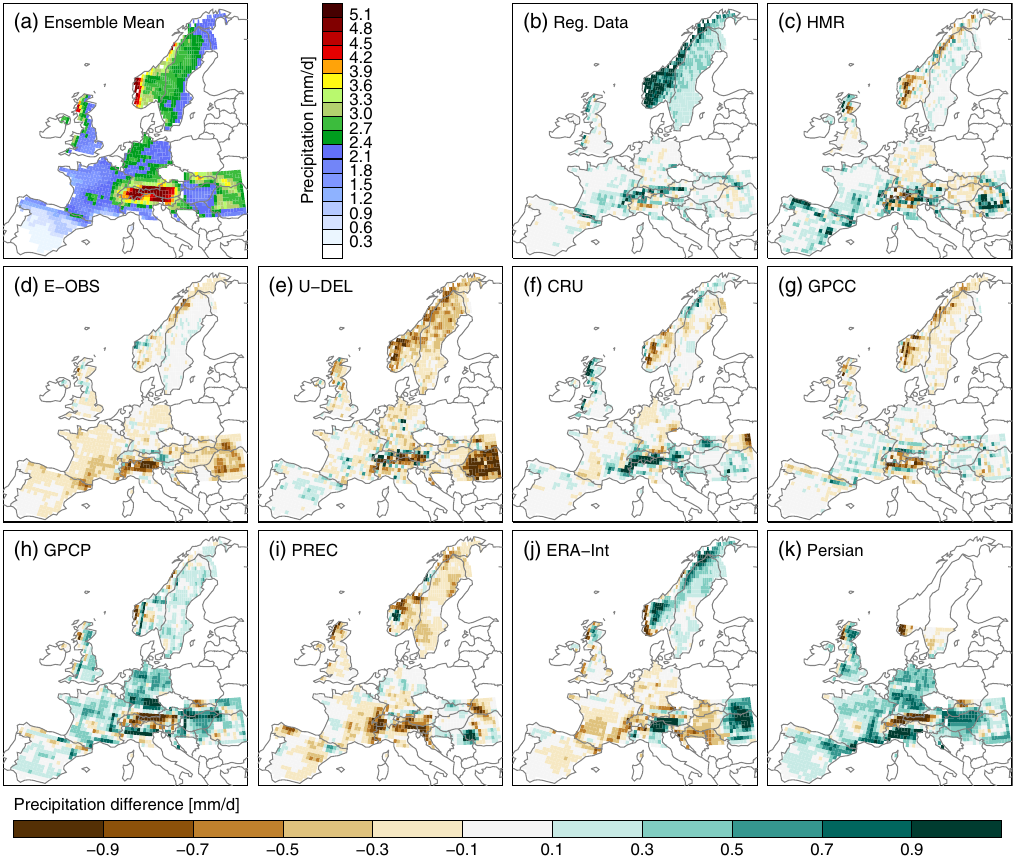
Prein et al., 2017
JJA
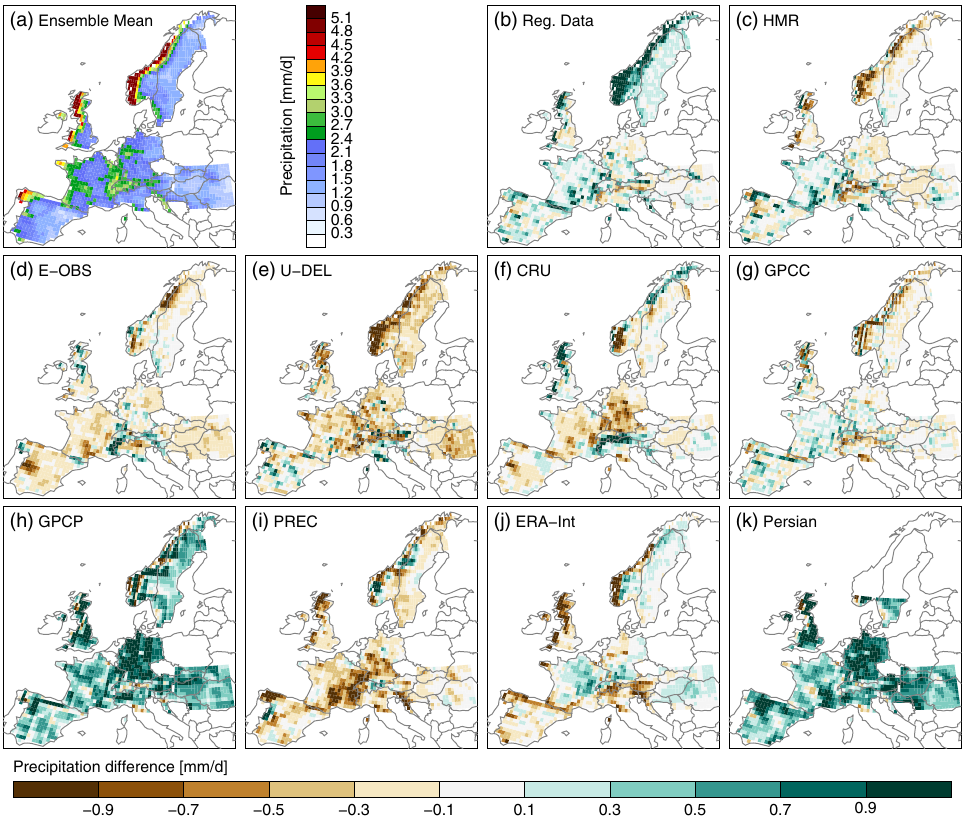
DJF
A few remarks
The best approach to correct data is heavily dependent on:
- Application
- Variable (e.g. precipitation > discharge > temperature)
- Availability of metadata
- Station density
- Length of the records
A CORRECTION WILL OFTEN NOT BE POSSIBLE
OBSERVATIONAL DATA WITH VERY HIGH UNCERTAINTY
But... what about other data sources?
RADAR
- Only for precipitation
- Depends heavily on location
- Can be shielded by topography
- Can be shielded by intense rain
- Frequent downtime
SATELLITE
- Precipitation, temperature
- ~ Worldwide
- The same algorithm is not necessarily good everywhere
- Resolution is generally poor (0.25° max)
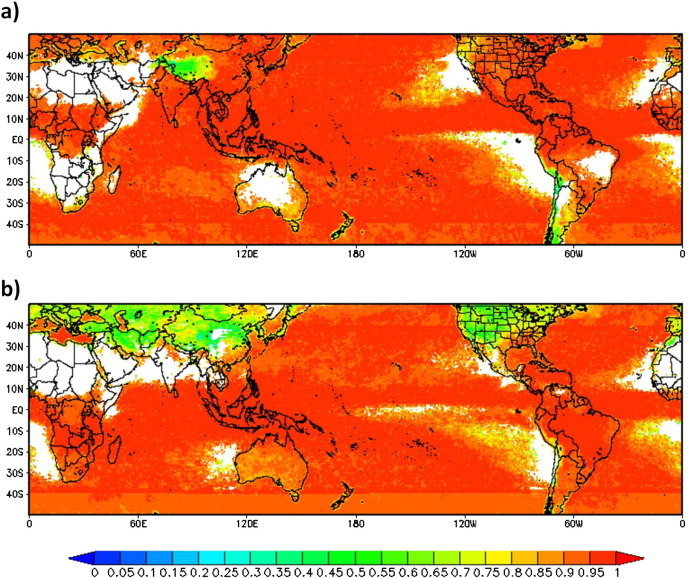
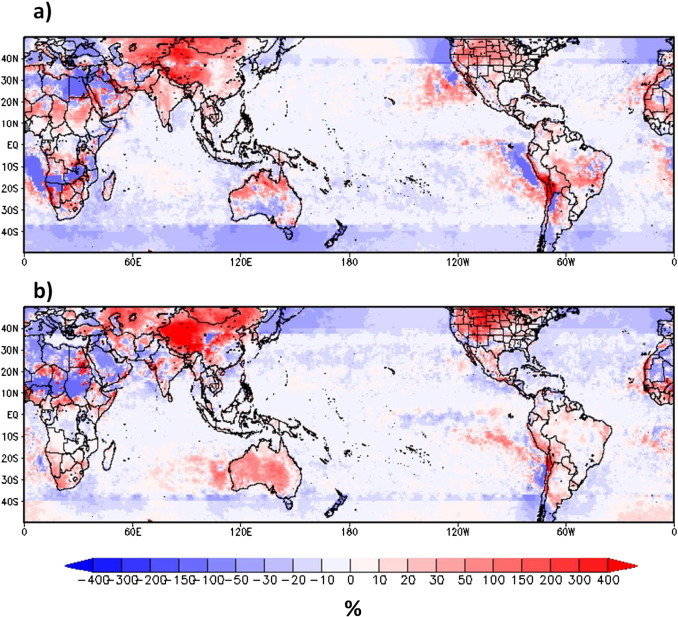
Liu, 2014
They are just proxies!
Requirement to choose an algorithm
But they are getting better and better!
% DIFF
CORR
TRMM
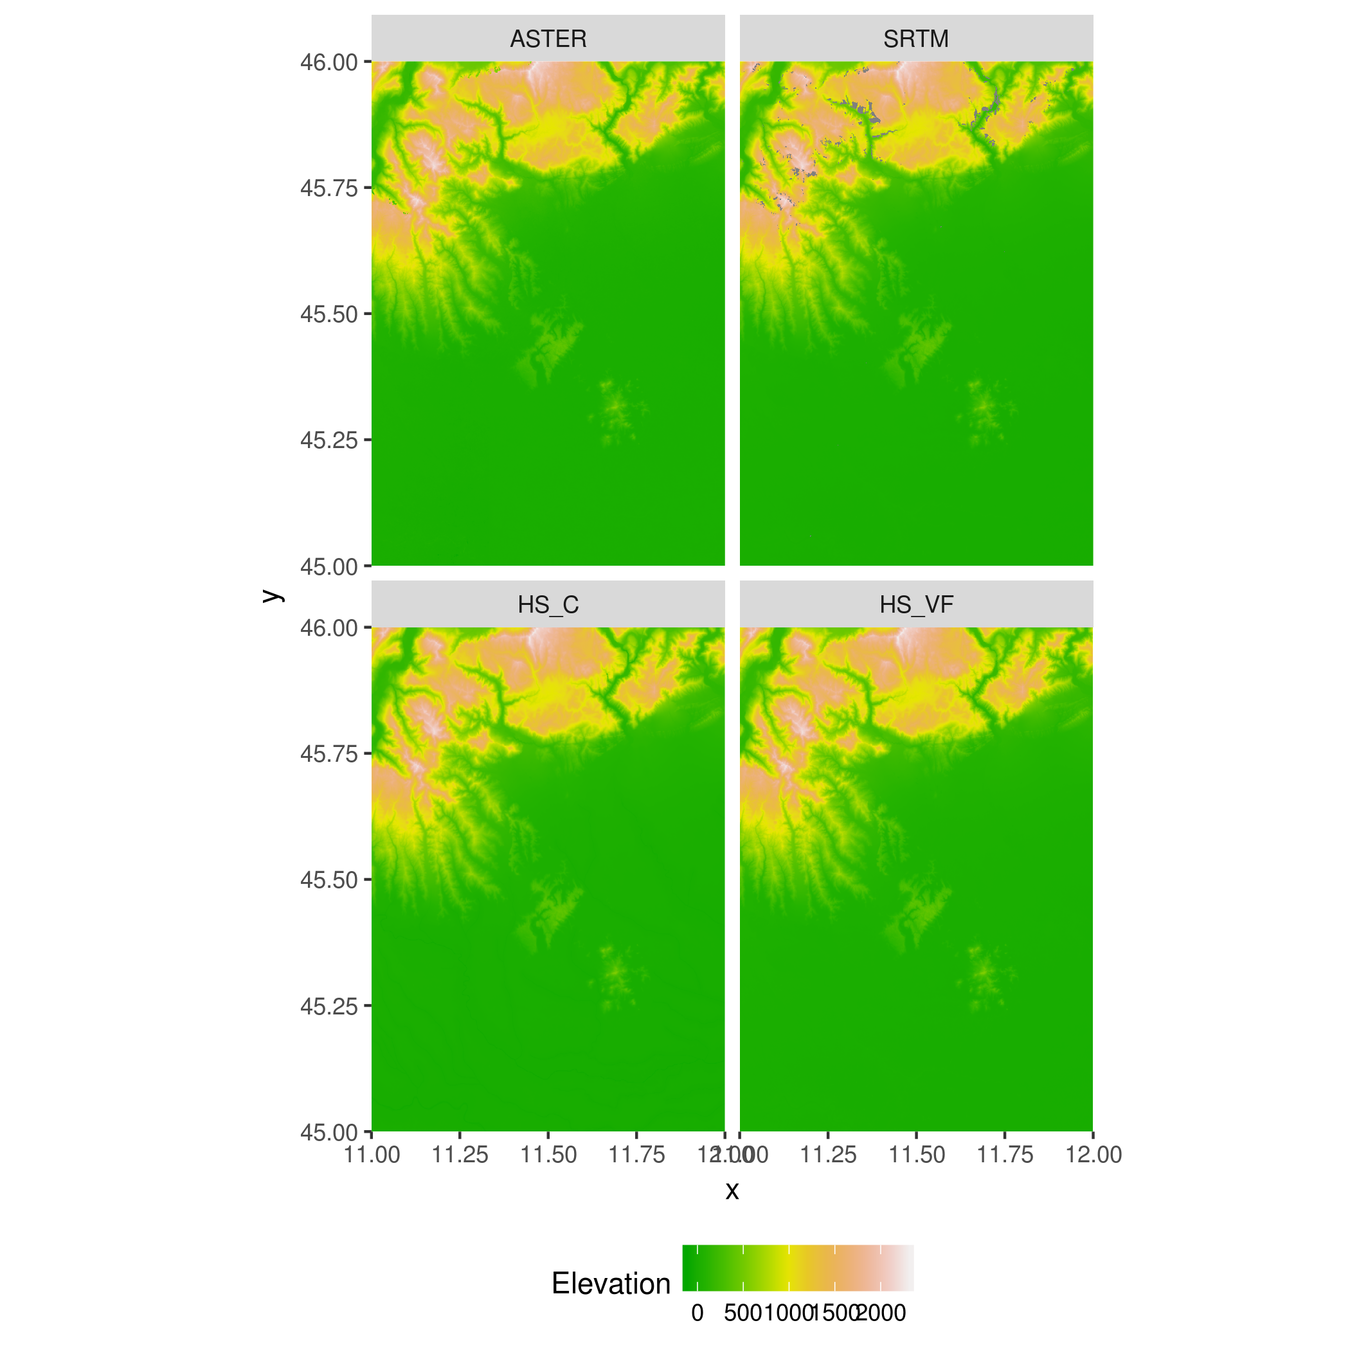
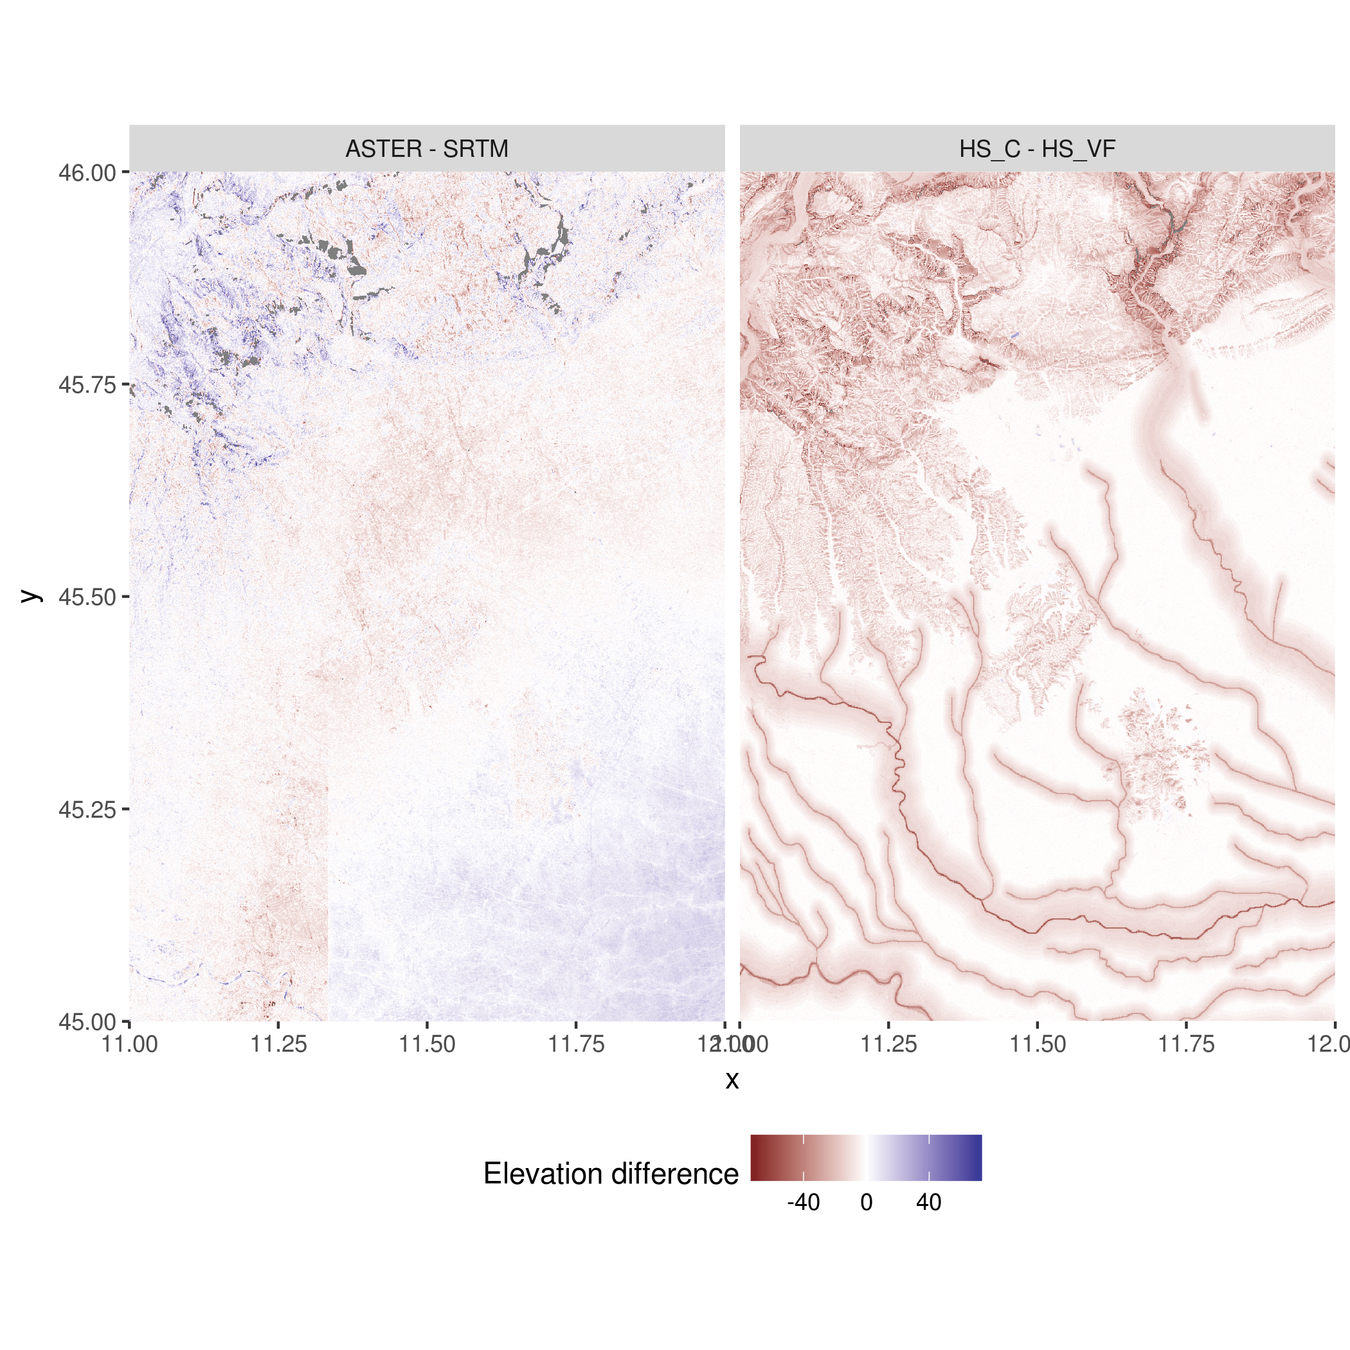
DEMs
- ASTER (30m)
- SRTM (30/90m)
- HydroSHEDS (90m)
- JAXA ALOS (30m)
- GTOPO (1km)
- WorldDEM (12m)
- Local, national DEMs
- ...
Digital Elevation Models
Usually satellite based, sometimes LIDAR
Take home message
-
Do not underestimate observational uncertainty
-
Choose your data source based on your application
-
Never-ever blindly trust un-checked obs data!!!