Open-source mobile-friendly maps
about me
Ryan Ohs
Phoenix Web Group
Waverly, Nebraska
var map = L.map('map').setView([51.505, -0.09], 13);
L.tileLayer('http://{s}.tile.osm.org/{z}/{x}/{y}.png', {
attribution: '© <a href="http://osm.org/copyright">OpenStreetMap</a> contributors'
}).addTo(map);
L.marker([51.5, -0.09]).addTo(map)
.bindPopup('A pretty CSS3 popup.
Easily customizable.')
.openPopup(); why leaflet?
- Google Maps for Business costs $10,000/yr
- Easy to use API
- Lightweight
- 64K (vs 700K for OpenLayers)
- Desktop and mobile support
- Retina display support with high-dpi tiles
- Currently at version 0.7.2
- Started in 2010
- Over 3000 commits and 157 contributers
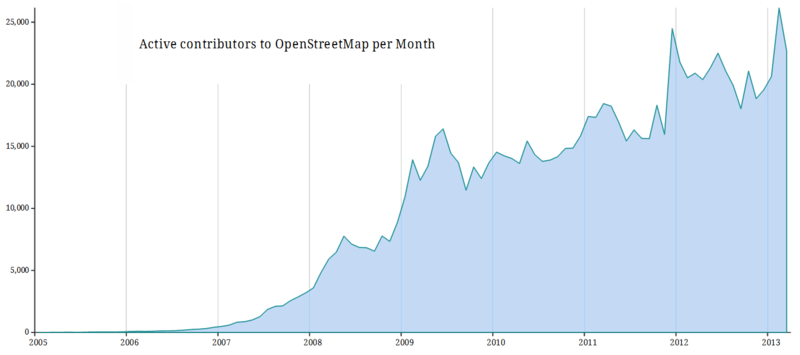
what is openstreetmap?
- Wikipedia for maps
- Data has open license
- User editable
- 1.5 million editors (doubling every year)
- > 2 trillion data points
OSM vs Google
Getting map tiles for free
-
OpenStreetMap
- Free but limited capacity
- Can’t use in distributed mobile apps
-
http://wiki.openstreetmap.org/wiki/Tile_usage_policy
- MapQuest Open license
- Free, open license, requires attribution
- For heavy usage (>4000 tiles/sec), contact them first
- JPEG
-
MapBox
- Free tier
- No satellite imagery
Commercial Options
- CloudMade
- Original creator of Leaflet
- $30 per 1 million tiles
- MapBox (Lead dev now works here)
- Free, then starting at $5/mo
- Roughly $30 per 900,000 tiles
- Also supports making your own tiles and layers
- Big list at http://wiki.openstreetmap.org/wiki/Commercial_OSM_Software_and_Services
Tiles and zooming
http://{s}.tile.osm.org/{z}/{x}/{y}.png
-
20 zoom levels
- 0 = whole world
- 13 = a town
- 19 = 1 ft/px
- Each level is about double the previous
-
Tiles are 256 x 256px PNG images
-
Approximately 15 tiles in a “map view”
getting started
- Link to javascript and stylesheet
<link rel="stylesheet" href="http://cdn.leafletjs.com/leaflet-0.7.2/leaflet.css" /> <script src="http://cdn.leafletjs.com/leaflet-0.7.2/leaflet.js"></script> - Add a map div. Give it a height.
<div id="map" style="height: 600px"></div> - Initialize the map.
var map = L.map('map').setView([51.505, -0.09], 13); - Add a map tile layer
L.tileLayer('http://{s}.tile.osm.org/{z}/{x}/{y}.png', {
    attribution: '© <a href="http://osm.org/copyright">
OpenStreetMap</a> contributors'
}).addTo(map);
mobile setup
Full screen support
body {
    padding: 0;
    margin: 0;
}
html, body, #map {
    height: 100%;
}
Disable automatic scaling
<meta name="viewport" content="width=device-width, initial-scale=1.0, maximum-scale=1.0, user-scalable=no" />
Initialize map (no coordinates here)
 var map = L.map('map');

L.tileLayer('map url', {
    attribution: 'attribution line',
    maxZoom: 18
}).addTo(map);
Geolocation
Zoom to the user's current position
map.locate({setView: true, maxZoom: 16});Continue initialization after success
function onLocationFound(e) {
    var radius = e.accuracy / 2;
    L.marker(e.latlng).addTo(map)
        .bindPopup("You are within " + radius + " meters from this point").openPopup();
    L.circle(e.latlng, radius).addTo(map);
}

map.on('locationfound', onLocationFound);
Handle error or permission denied
 function onLocationError(e) {
    alert(e.message);
}

map.on('locationerror', onLocationError);
Markers
Consist of an image and a shadow

 var appleIcon = L.icon({
    iconUrl: "../lib/images/apple.png",
    shadowUrl: "../lib/images/square-shadow.png",
    iconSize:     [32, 37],
    shadowSize:   [51, 37],
    iconAnchor:   [16, 37],
    shadowAnchor: [17, 37],
    popupAnchor:  [0, -37]
});

L.marker([51.5, -0.09], {icon: appleIcon}).addTo(map);
Creating Markers
Lots of free icons available online
Maps Icon Collection (CC BY SA 3.0)
Font-Awesome Markers (MIT)
Custom icons need custom shadow shapes
MArker Anchors
 iconSize:     [32, 37],
 shadowSize:   [51, 37],
 iconAnchor:   [16, 37],
 shadowAnchor: [17, 37],
 popupAnchor:  [0, -37]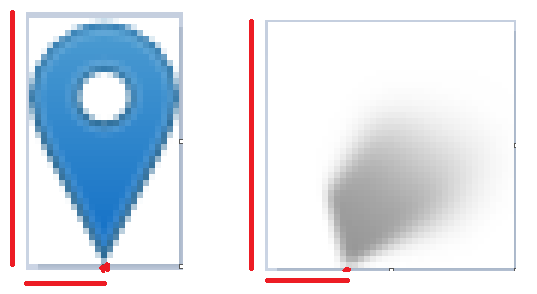
Popups
Popups can be bound to a coordinate, marker, or shape.
marker.bindPopup("<b>Hello world!</b><br>I am a popup.").openPopup();L.popup() .setLatLng([51.5, -0.09]) .setContent("I am a standalone popup.") .openOn(map);
Shapes
- Circles
- Polygons
- Lines
- Paths
var circle = L.circle([51.508, -0.11], 500, {
    color: 'red',
    fillColor: '#f03',
    fillOpacity: 0.5
}).addTo(map);

var polygon = L.polygon([
    [51.509, -0.08],
    [51.503, -0.06],
    [51.51, -0.047]
]).addTo(map);
Layers
Two types:
-
Base layers - only one can be visible
-
Overlays - markers, geoJSON, etc.
Add default layers to the map initialization:
 var map = L.map('map', {
    center: new L.LatLng(40.82,-96.65),
    zoom: 10,
    layers: [streets, cities]
}); L.control.layers(baseMaps, overlayMaps).addTo(map);
        var littleton = L.marker([39.61, -105.02]).bindPopup('This is Littleton, CO.'),
    denver    = L.marker([39.74, -104.99]).bindPopup('This is Denver, CO.'),
    aurora    = L.marker([39.73, -104.8]).bindPopup('This is Aurora, CO.'),
    golden    = L.marker([39.77, -105.23]).bindPopup('This is Golden, CO.');
var cities = L.layerGroup([littleton, denver, aurora, golden]);

var url = 'https://{s}.tiles.mapbox.com/v3/{key}/{z}/{x}/{y}.png';
var attribution = 'MapBox';

var streets   = L.tileLayer(url, {key: "rohs.hkme15d0", attribution: attribution});
var terrain  = L.tileLayer(url, {key: "rohs.hkmf3lfh",   attribution: attribution});

var map = L.map('map', {
    center: new L.LatLng(39.7308819,-105.0348376),
    zoom: 9,
    layers: [streets, cities]
});

var baseMaps = {
	"Streets" : streets,
	"Terrain" : terrain
};

var overlayMaps = {
	"Cities": cities
};

L.control.layers(baseMaps, overlayMaps).addTo(map);
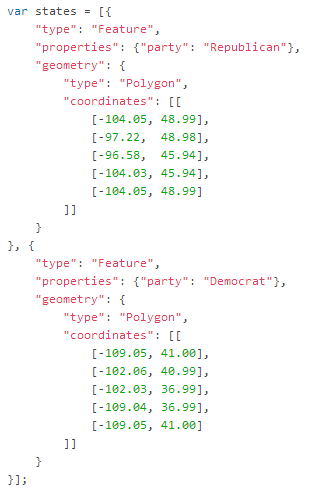
GEOJSON
Programmatically defining map elements is verbose.
GeoJSON is a standard format.
Using GEOJSON
Attach styles to geoJSON shapes:
var myStyle = {
    "color": "red",
    "weight": 5,
    "opacity": 0.65
};

L.geoJson(myLines, {
        style: myStyle
    }).addTo(map);
Points are converted to markers.
Alternatively you can turn them into a shape.
 var geojsonMarkerOptions = {
    radius: 8,
    fillColor: "#ff7800",
    color: "#000",
    weight: 1,
    opacity: 1,
    fillOpacity: 0.8
};

L.geoJson(someGeojsonFeature, {
    pointToLayer: function (feature, latlng) {
        return L.circleMarker(latlng, geojsonMarkerOptions);
    }
}).addTo(map);
You can attach popups to geoJSON features.
 function onEachFeature(feature, layer) {
    if (feature.properties && feature.properties.popupContent) {
        layer.bindPopup(feature.properties.popupContent);
    }
}

L.geoJson(geojsonFeature, {
    onEachFeature: onEachFeature
}).addTo(map);
You can filter geoJSON datasets.
L.geoJson(someFeatures, {
    filter: function(feature, layer) {
        return feature.properties.show_on_map;
    }
}).addTo(map);
Making geojson
MapBox TileMill - native app
Online editor at http://geojson.io/
MongoDB can serve and query geoJSON
routes
MapQuest routing plugin
 var map = L.map('map', {
    layers: MQ.mapLayer(),
    center: [ 38.895345, -77.030101 ],
    zoom: 15
});

var dir = MQ.routing.directions();

dir.route({
    locations: [
        '1600 pennsylvania ave, washington dc',
        '935 pennsylvania ave, washington dc'
    ]
});

map.addLayer(MQ.routing.routeLayer({ directions: dir, fitBounds: true }));
event model
- click
- mouseover object
- dragging
- popups
- resize
- geolocation
- errors
Events Demo
LeafLET.Draw
Marker cluster plugin
PLUGINS
Labels
BounceMarker
KML
geoCSV
Heatmap
Terminator
Context menu
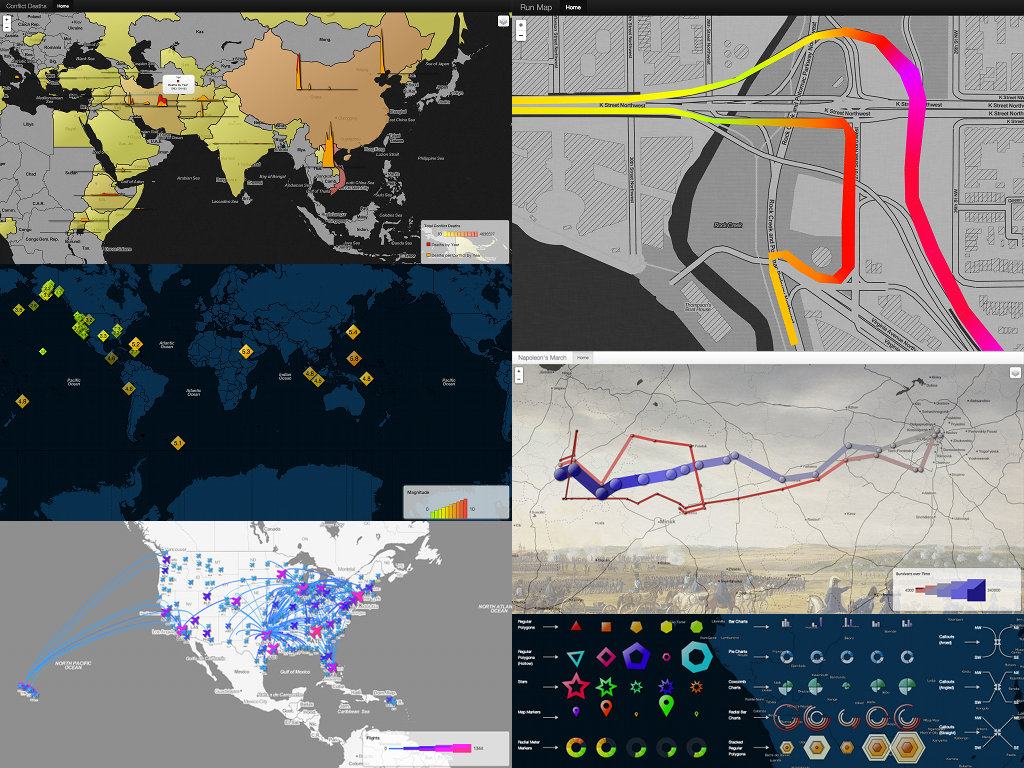
data visualization
RESOURCES
leaflet online
Find this Presentation
All code examples will be at