JavaScript Debugging
JavaScript Debugging
- It is difficult to write JavaScript code without a debugger.
- Your code might contain syntax errors, or logical errors, that are difficult to diagnose.
- Often, when JavaScript code contains errors, nothing will happen. There are no error messages, and you will get no indications where to search for errors.
JavaScript Debuggers
- Searching for errors in programming code is called code debugging.
- Debugging is not easy. But fortunately, all modern browsers have a built-in debugger.
- Built-in debuggers can be turned on and off, forcing errors to be reported to the user.
- With a debugger, you can also set breakpoints (places where code execution can be stopped), and examine variables while the code is executing.
- Normally you activate debugging in your browser with the F12 key, and select "Console" in the debugger menu.
The console.log() Method
If your browser supports debugging, you can use console.log() to display JavaScript values in the debugger window:
<!DOCTYPE html>
<html>
<body>

<h1>My First Web Page</h1>

<p>
Activate debugging in your browser (Chrome, IE, Firefox) with F12, and select "Console" in the debugger menu.
</p>

<script>
a = 5;
b = 6;
c = a + b;
console.log(c);
</script>

</body>
</html> Setting Breakpoints
- In the debugger window, you can set breakpoints in the JavaScript code.
- At each breakpoint, JavaScript will stop executing, and let you examine JavaScript values.
- After examining values, you can resume the execution of code (typically with a play button).
The debugger Keyword
- The debugger keyword stops the execution of JavaScript, and calls (if available) the debugging function.
- This has the same function as setting a breakpoint in the debugger.
- If no debugging is available, the debugger statement has no effect.
- With the debugger turned on, this code will stop executing before it executes the third line.
var x = 15 * 5;
debugger;
document.getElementbyId("demo").innerHTML = x;Major Browsers' Debugging Tools
Normally, you activate debugging in your browser with F12, and select "Console" in the debugger menu.
Otherwise follow these steps:
Firefox Firebug
- Open the browser.
- Go to the web page: http://www.getfirebug.com
- Follow the instructions how to: install Firebug
Opera
- Open the browser.
- Go to the webpage: http://dev.opera.com
- Follow the instructions how to:
add a Developer Console button to your toolbar.
Safari Develop Menu
- Go to Safari, Preferences, Advanced in the main menu.
- Check "Enable Show Develop menu in menu bar".
- When the new option "Develop" appears in the menu:
Choose "Show Error Console".
Chrome
- Open the browser.
- From the menu, select tools.
- From tools, choose developer tools.
- Finally, select Console.
Internet Explorer
- Open the browser.
- From the menu, select tools.
- From tools, choose developer tools.
- Finally, select Console.
Safari Firebug
- Open the browser.
- Go to the webpage: http://extensions.apple.com
- Follow the instructions how to: install Firebug Lite.
Debugging JavaScript in Chrome
- As the complexity of JavaScript applications increase, developers need powerful debugging tools to help quickly discover the cause of an issue and fix it efficiently.
- The Chrome DevTools include a number of useful tools to help make debugging JavaScript less painful.
- In this section, we will walk through how to use these tools by debugging the TodoMVC Angular app.
Note: If you are a Web Developer and want to get the latest version of DevTools, you should use Chrome Canary.
The Sources Panel
The Sources panel lets you debug your JavaScript code. It provides a graphical interface to the V8 debugger. Follow the steps below to explore the Sources panel:
-
Open a site such as the TodoMVC Angular app.
-
Open the DevTools window.
-
If it is not already selected, select Sources.
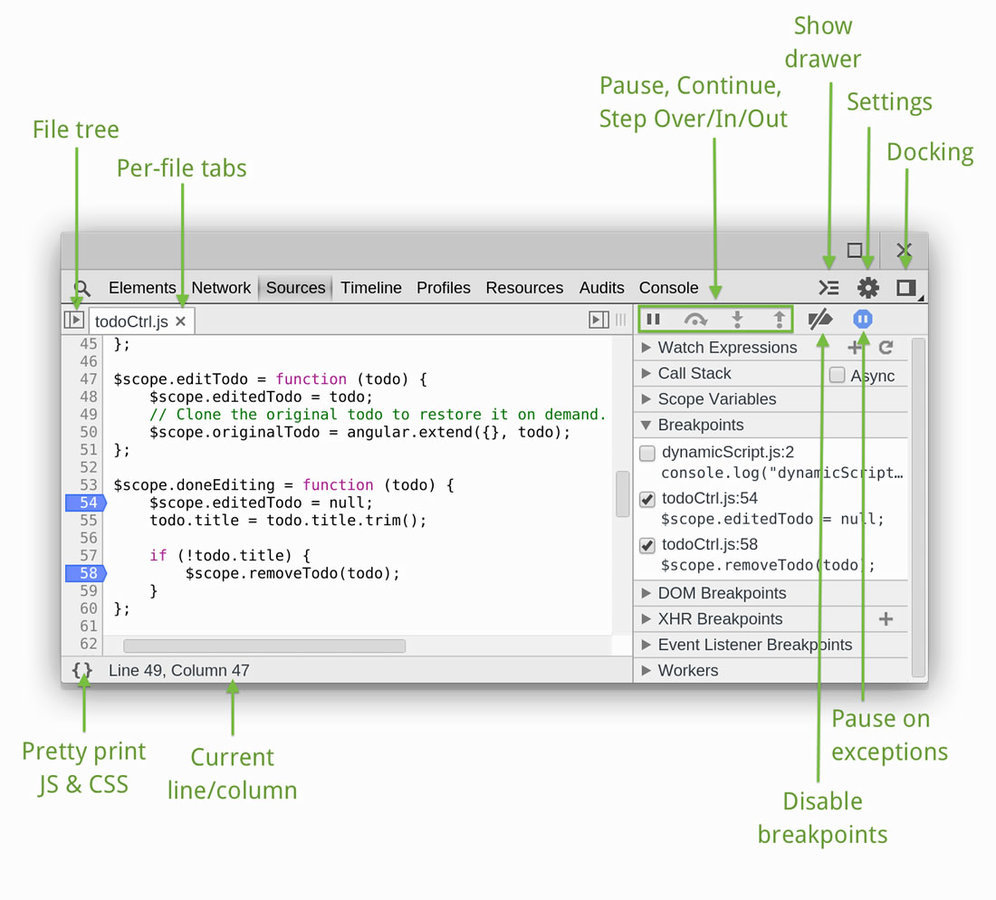
The Sources panel lets you see all the scripts that are part of the inspected page. Standard controls to pause, resume, and step through code are provided below the panel selection icons. A button to force a pause at exceptions is located at the bottom of the window. Sources are visible in separate tabs and clicking opens the file navigator which will display all open scripts.

Execution control
The execution control buttons are located at the top of the side panels and allow you to step through code. The buttons available are:
- Continue: continues code execution until we encounter another breakpoint.
- Step over: step through code line-by-line to get insights into how each line affects the variables being updated. Should your code call another function, the debugger won't jump into its code, instead stepping over so that the focus remains on the current function.
- Step into: like Step over, however clicking Step into at the function call will cause the debugger to move its execution to the first line in the functions definition.
- Step out: having stepped into a function, clicking this will cause the remainder of the function definition to be run and the debugger will move its execution to the parent function.
- Toggle breakpoints: toggles breakpoints on/off while leaving their enabled states intact.


There are also several related keyboard shortcuts available in the Sources panel:
- Continue: F8 or Command + \ on Mac or Ctrl + \ on other platforms.
- Step over: F10 or Command+' on Mac or Ctrl+' on other platforms.
- Step into: F11 or Command+; on Mac or Ctrl+; on other platforms.
- Step out: Shift+F11 or Shift+Command+; on Mac or Shift+Ctrl+; on other platforms.
- Next call frame: Ctrl+. on all platforms.
- Previous call frame: Ctrl+, on all platforms.
For a walkthrough of other keyboard shortcuts supported, see Shortcuts.
Debugging with breakpoints
A breakpoint is an intentional stopping or pausing place in a script. Use breakpoints in DevTools to debug JavaScript code, DOM updates, and network calls.
Add and remove breakpoints
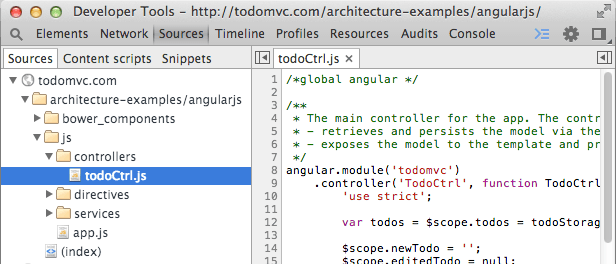
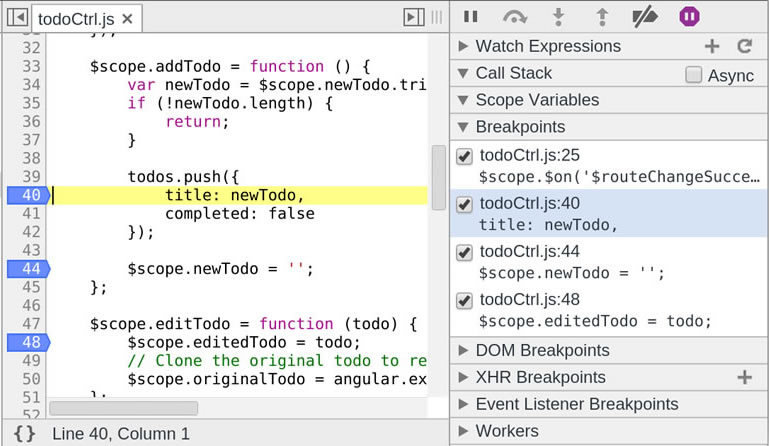
In the Sources panel, open a JavaScript file for debugging. In the example below, we are debugging the todoCtrl.js file from the AngularJS version of TodoMVC.
Click the line gutter to set a breakpoint for that line of code. A blue tag will indicate if a breakpoint has been set:
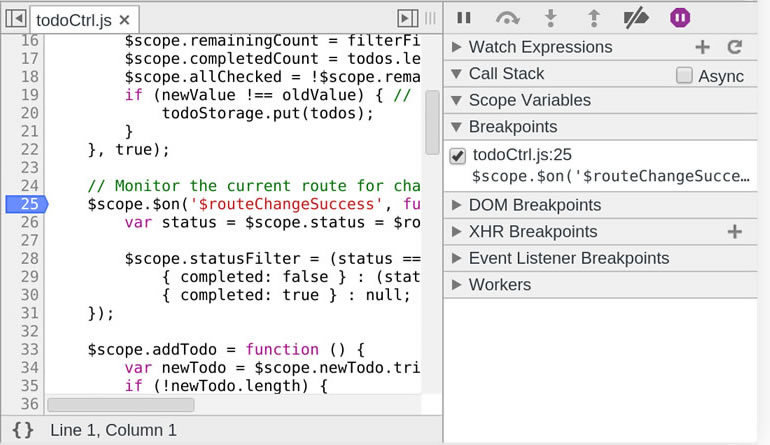
You can add multiple breakpoints. Click the line gutter of another line to set another breakpoint. All the breakpoints you have set appear under Breakpoints in the right-hand sidebar.
Breakpoints can be enabled or disabled using the checkboxes in this sidebar. If a breakpoint is disabled, the blue tag will appear faded out.
Click on a breakpoint entry to jump to that particular line in the source file:
Remove a breakpoint by clicking the blue tag breakpoint indicator.
Right-click on the blue tag to access a menu with several options including: Continue to Here, Remove Breakpoint, Edit Breakpoint, and Disable Breakpoint.
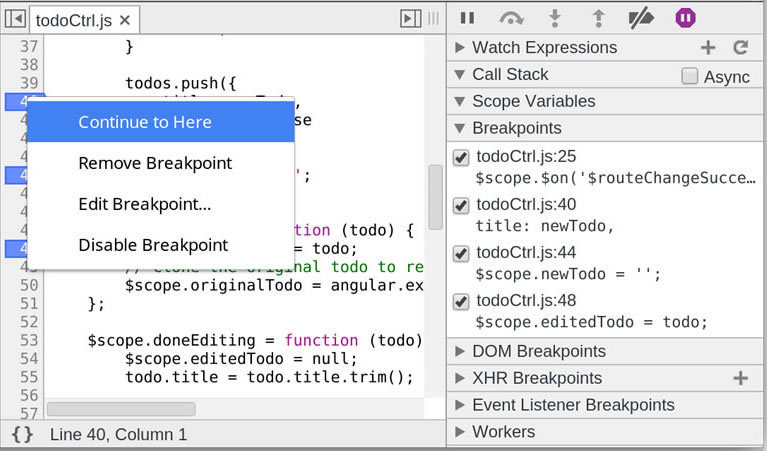
To set a conditional breakpoint, choose Edit Breakpoint. Alternatively, right-click on the gutter line and choose Add Conditional Breakpoint. In the input field, type any expression that could resolve to true or false. The breakpoint will pause code execution only if the condition is true.
Conditional breakpoints are especially useful when you're looking to analyze code in a loop or an event callback that fires often.
Note: It may not be desirable to set breakpoints from the DevTools interface. Should you wish to launch the debugger from your code, you may use the debugger keyword to achieve this.
Interact with paused breakpoints
Once you have one or more breakpoints set, return to the browser window and interact with your page. In the example below, a breakpoint was added within removeTodo(). Now any attempts to delete a todo item in the TodoMVC app will trigger a breakpoint pause:
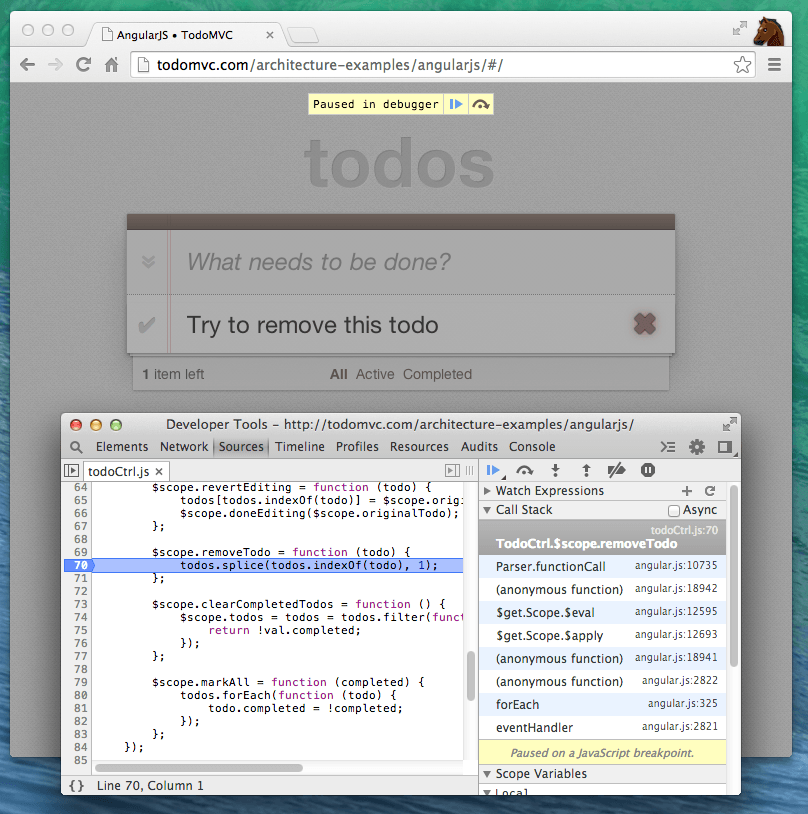
To resume code execution, click the
Continue button or use the
F8 keyboard shortcut in the DevTools window.
While a script is paused, you can interact with the Watch Expressions, Call Stack, and Scope Variables panels in the right-hand side bar.
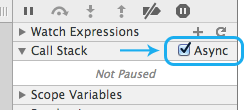
Call Stack panel
The Call Stack panel displays the complete execution path that led to the point where code was paused, giving us insights into the code flaws that caused the error.
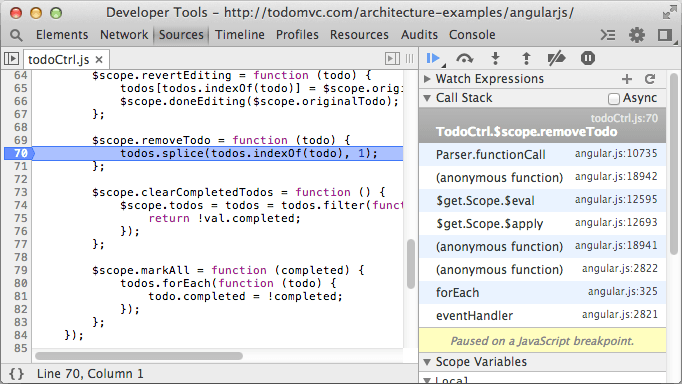
To view the execution path including asynchronous JavaScript callbacks such as timer and XHR events, check the Async checkbox.
Further information and examples using async call stacks can be found in Debugging Asynchronous JavaScript with Chrome DevTools on HTML5Rocks.com.
Console drawer
The DevTools console drawer will allow you to experiment within the scope of where the debugger is currently paused. Hit the Esc key to bring the console into view. The Esc key also closes this drawer.
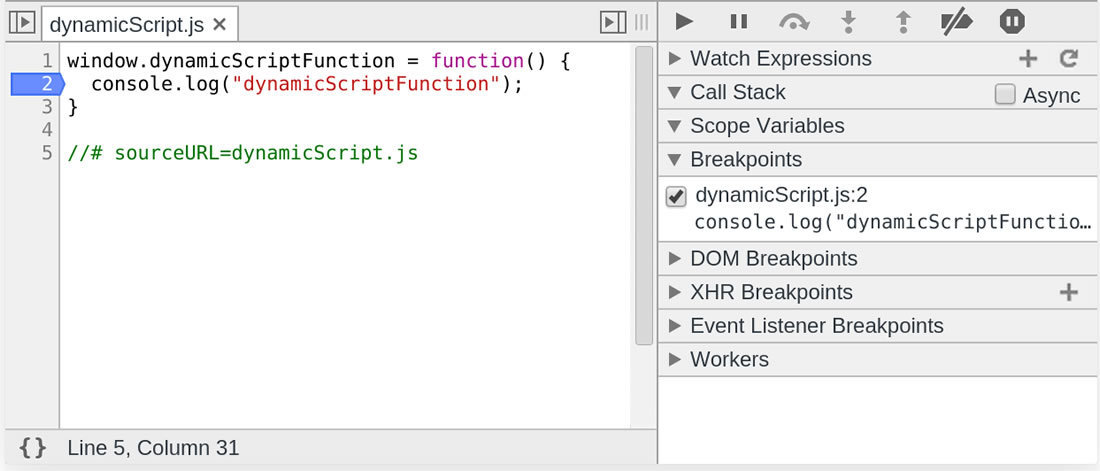
Breakpoints in Dynamic JavaScript
- Load dynamic script
- In the Sources panel select "dynamicScript.js" from scripts drop-down and set breakpoint on line 2
- Call function from dynamic script
- You should stop on the breakpoint
- Click the Continue button or hit F8 in DevTools window to resume
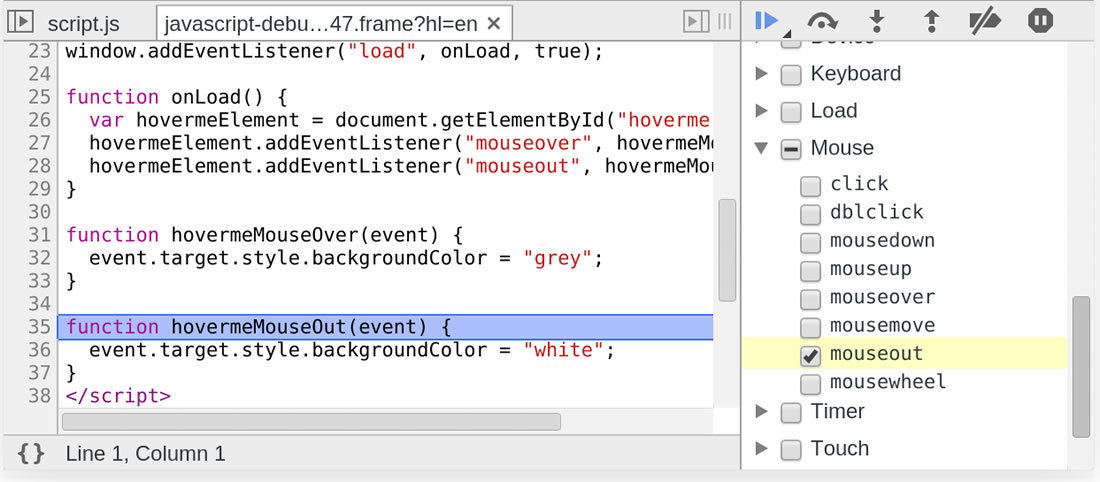
Pause on Next JavaScript Statement
- Click the Pause
![]() button
button - Move your mouse over this section
- You should stop in
onMouseOverfunction - Click the Continue
![]() button or hit F8 in DevTools window to resume
button or hit F8 in DevTools window to resume
Pause on Uncaught Exceptions
- Click the Pause on exceptions
![]() button
button - Disable the Pause On Caught Exceptions checkbox
- You should stop in
raiseExceptionfunction - Click the Continue
![]() button or hit F8 in DevTools window to resume
button or hit F8 in DevTools window to resume
 button
 button or hit F8 in DevTools window to resume
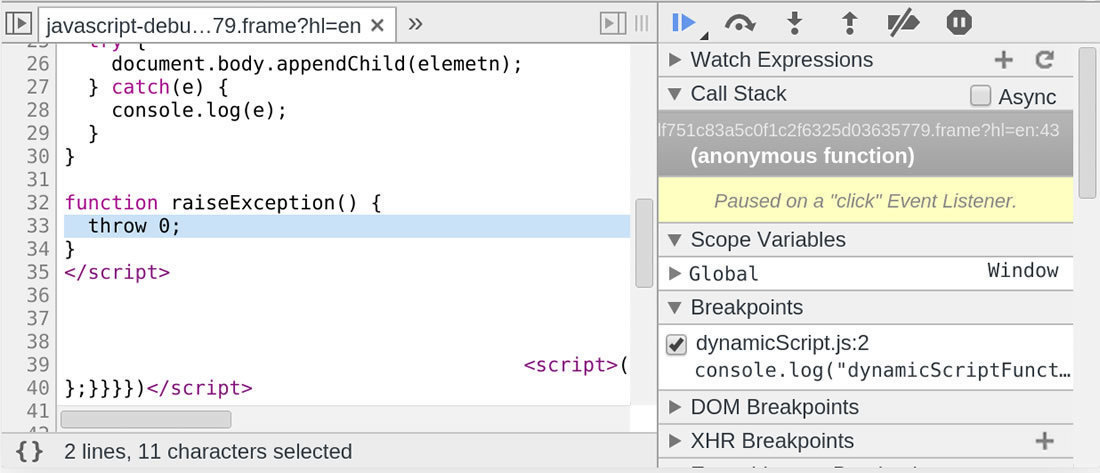
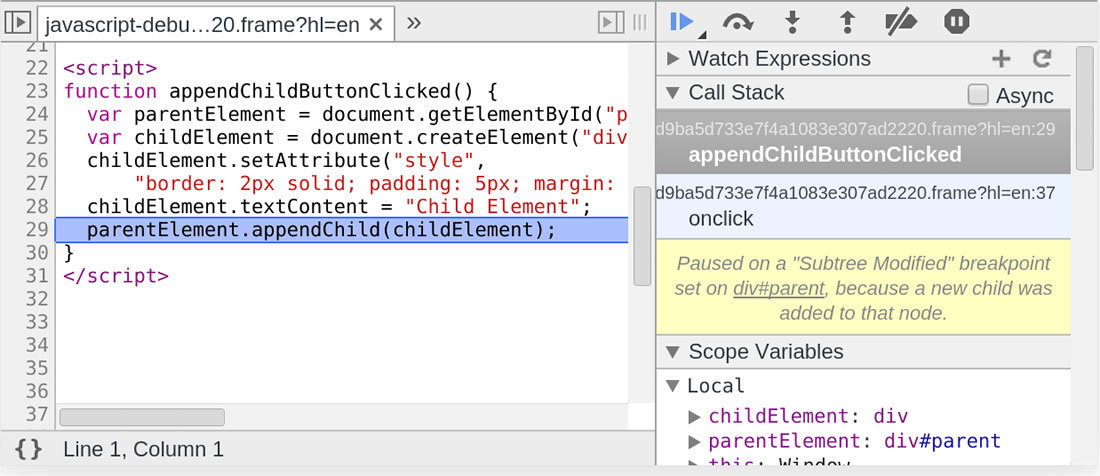
Breakpoints on DOM Mutation Events
-
Right click on the "Parent Element" below and select Inspect Element from context menu
Parent Element
- Right click on the Elements' panel element and select Break on Subtree Modifications
- You should stop on
appendChildfunction call - Click the Continue
![]() button or hit F8 in DevTools window to resume
button or hit F8 in DevTools window to resume
Breakpoints on XHR
- Click the Add
![]() button on XHR Breakpoints sidebar pane on the right side of Sources panel
button on XHR Breakpoints sidebar pane on the right side of Sources panel - Type "data.txt" in text input and hit enter
- You should stop on
sendfunction call - Right-click on the newly created breakpoint and select Remove Breakpoint context menu item
- Click the Continue
![]() button or hit F8 in DevTools window to resume
button or hit F8 in DevTools window to resume
 button on XHR Breakpoints sidebar pane on the right side of Sources panel
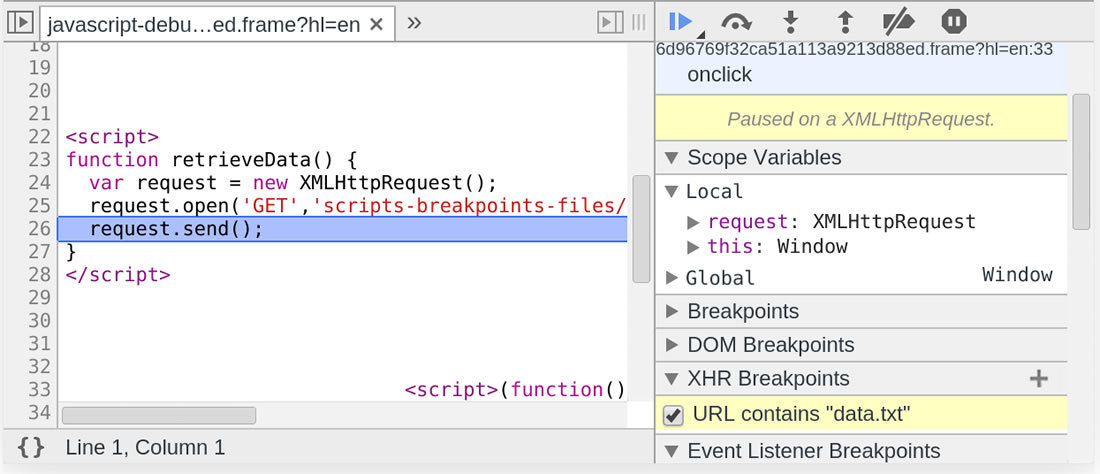
Note: To edit URL filter, double click on the XHR breakpoint entry in XHR Breakpoints sidebar pane. XHR breakpoint with empty URL filter will match any XHR.
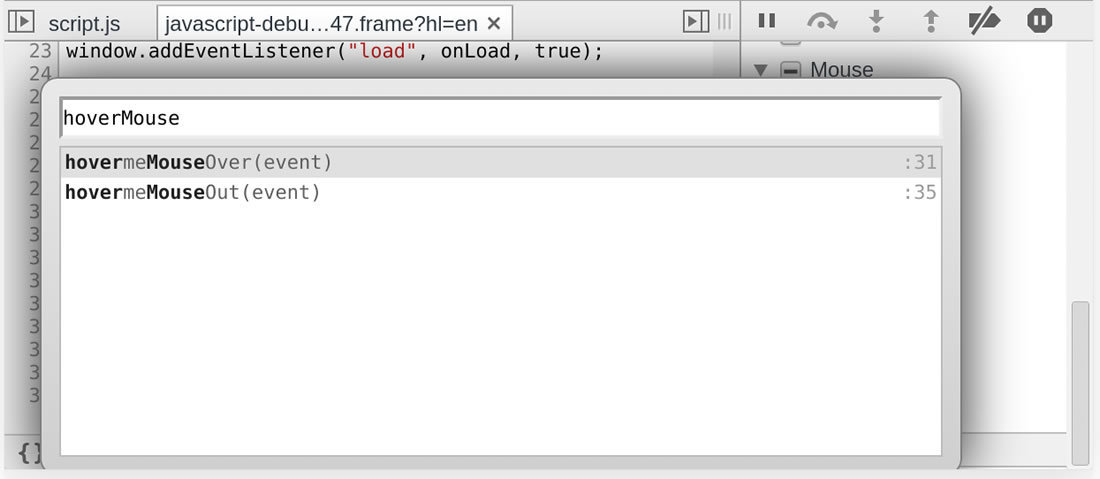
Live Editing
- Navigate to the Google Closure hovercard demo
- In the Sources panel, open up "ui/hovercard.js" and use the Ctrl/Cmd + Shift + O to navigate to the handleTriggerMouseOver_
- Click the pause button to pause debugging
- Modify the function, adding a console.log('Mouse over') to the end
- Using the Cmd +S or Ctrl + S shortcuts will save these modifications. Make sure to Save As.
- Click the pause/resume button to resume execution
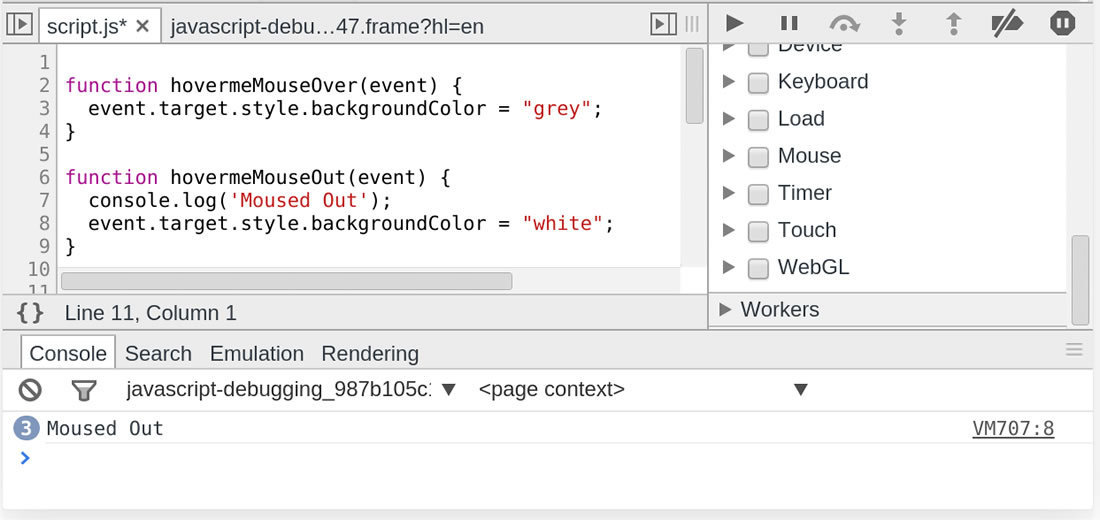
- When you now hover out, the new message will be logged to the console
Exceptions
Let's now look at how to deal with exceptions and stack traces using Chrome DevTools.
Exception handling is the process of responding to the occurrence of exceptions - exceptional situations that require special processing - often changing the normal flow of your JavaScript code's execution.
Note: If you are a Web Developer and want to get the latest version of DevTools, you should use Chrome Canary.
Tracking exceptions
When something goes wrong, you can open the DevTools console (Ctrl+Shift+J / Cmd+Option+J) and find a number of JavaScript error messages there. Each message has a link to the file name with the line number you can navigate to.
Viewing exception stack trace
There might be several execution paths that lead to the error and it's not always obvious which one of them has happened. Once DevTools window is opened, exceptions in the console are accompanied with thecomplete JavaScript call stacks. You can expand these console messages to see the stack frames and navigate to the corresponding locations in the code:
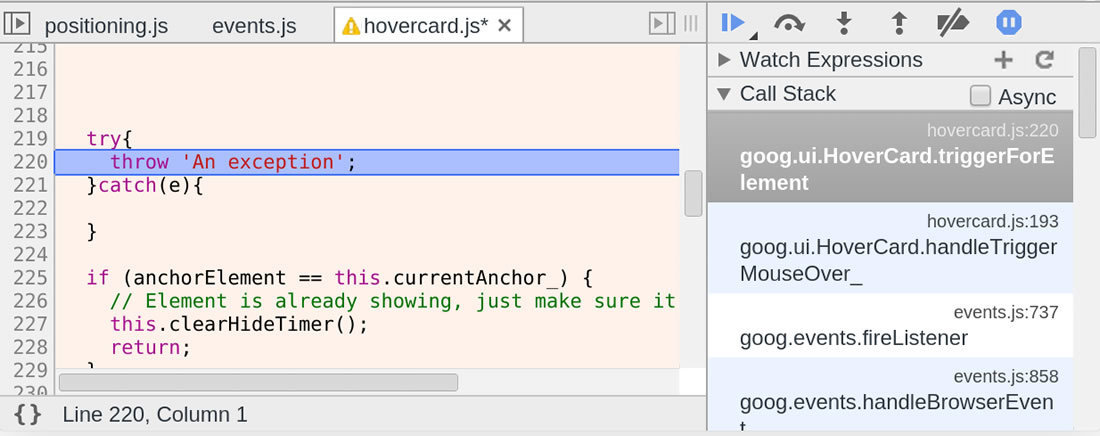
Pause on JavaScript exceptions
You may also want to pause JavaScript execution next time exception is thrown and inspect its call stack, scope variables and state of your app. A tri-state stop button (  ) at the bottom of the Scripts panel enables you to switch between different exception handling modes: you can choose to either pause on all exception or only on the uncaught ones or you can ignore exceptions altogether.
Printing stack traces
Printing log messages to the DevTools console may be very helpful in understanding how your application behaves. You can make the log entries even more informative by including associated stack traces. There are several ways of doing that.
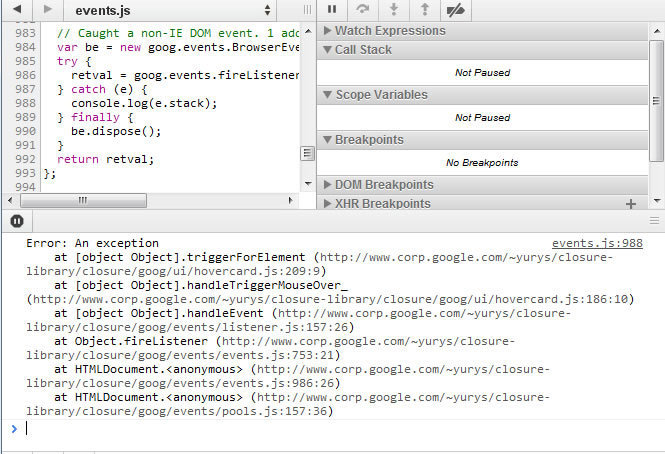
Error.stack
Each Error object has a string property named stack that contains the stack trace:
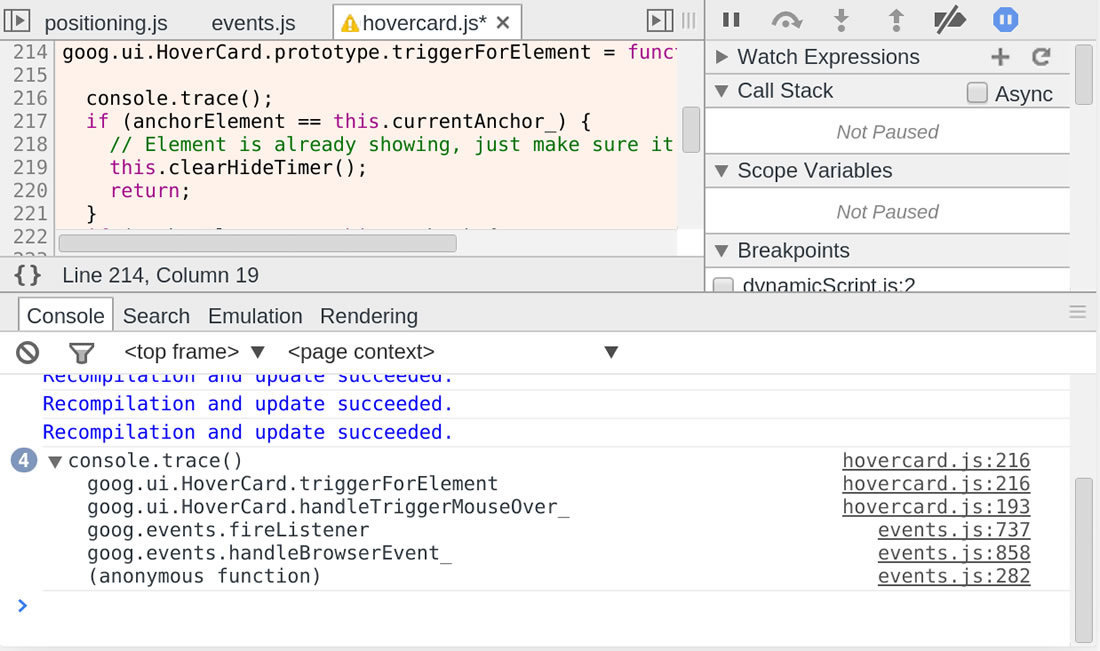
console.trace()
You can instrument your code with console.trace() calls that would print current JavaScript call stacks:
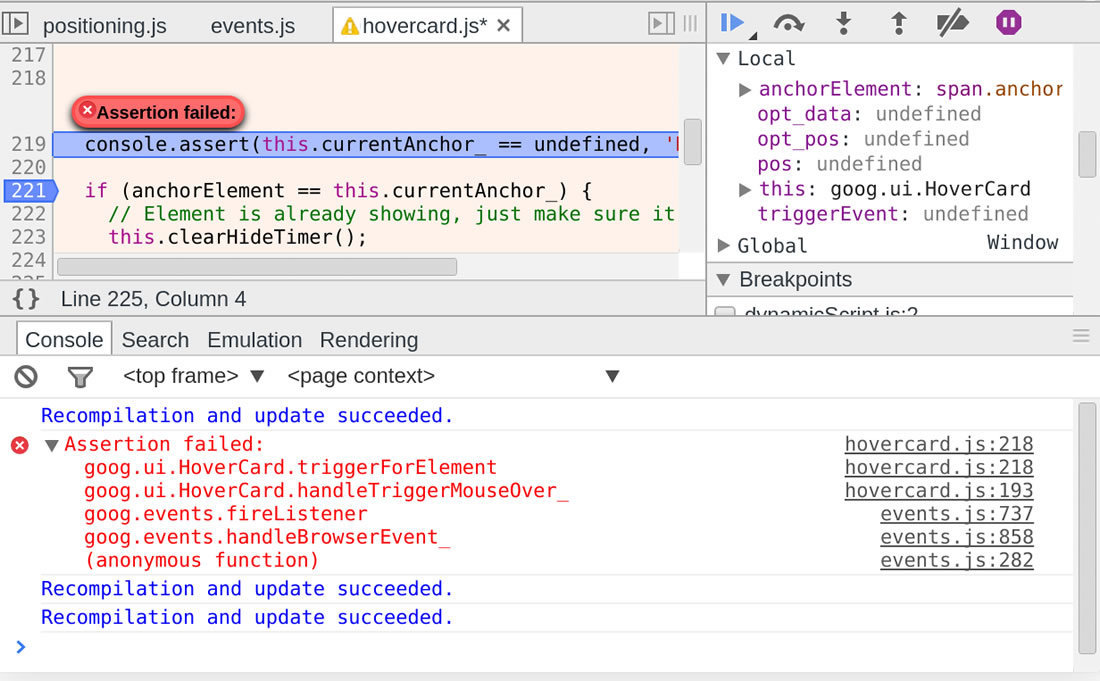
console.assert()
There is also a way to place assertion in your JavaScript code. Just call console.assert() with the error condition as the first parameter. Whenever this expression evaluates to false you will see a corresponding console record:

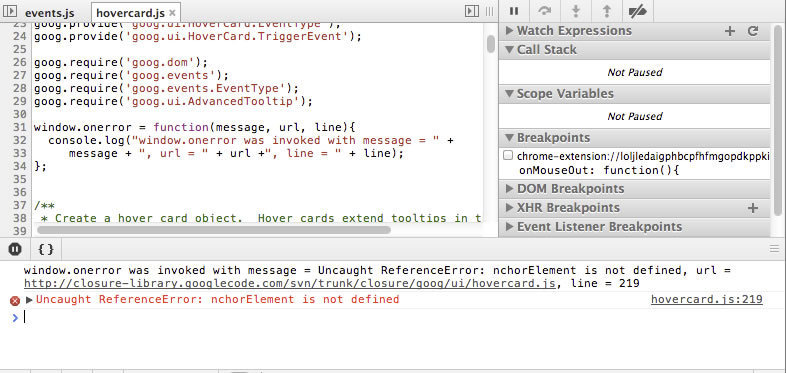
Handling exceptions at runtime using window.onerror
Chrome supports setting a handler function to window.onerror. Whenever a JavaScript exception is thrown in the window context and is not caught by any try/catch block, the function will be invoked with the exception's message, the URL of the file where the exception was thrown and the line number in that file passed as three arguments in that order. You may find it convenient to set an error handler that would collect information about uncaught exceptions and report it back to your server.