Big (enough) data
and strategies for distributed geoprocessing
@robinkraft
Data Lab @ World Resources Institute
Me - not an engineer
but still useful!
@robinkraft
WRI - not Twitter
But sometimes has lots of data
Big vs. small
What about big enough?
I know "big enough" when I see it
When standard tools just aren't enough ...
- RAM
- Disk space
- Max out CPUs for days
- Mystery crashes
- Etc.
... but the big data toolkit is overkill
Awkward middle ground

GlobalForestWatch.org
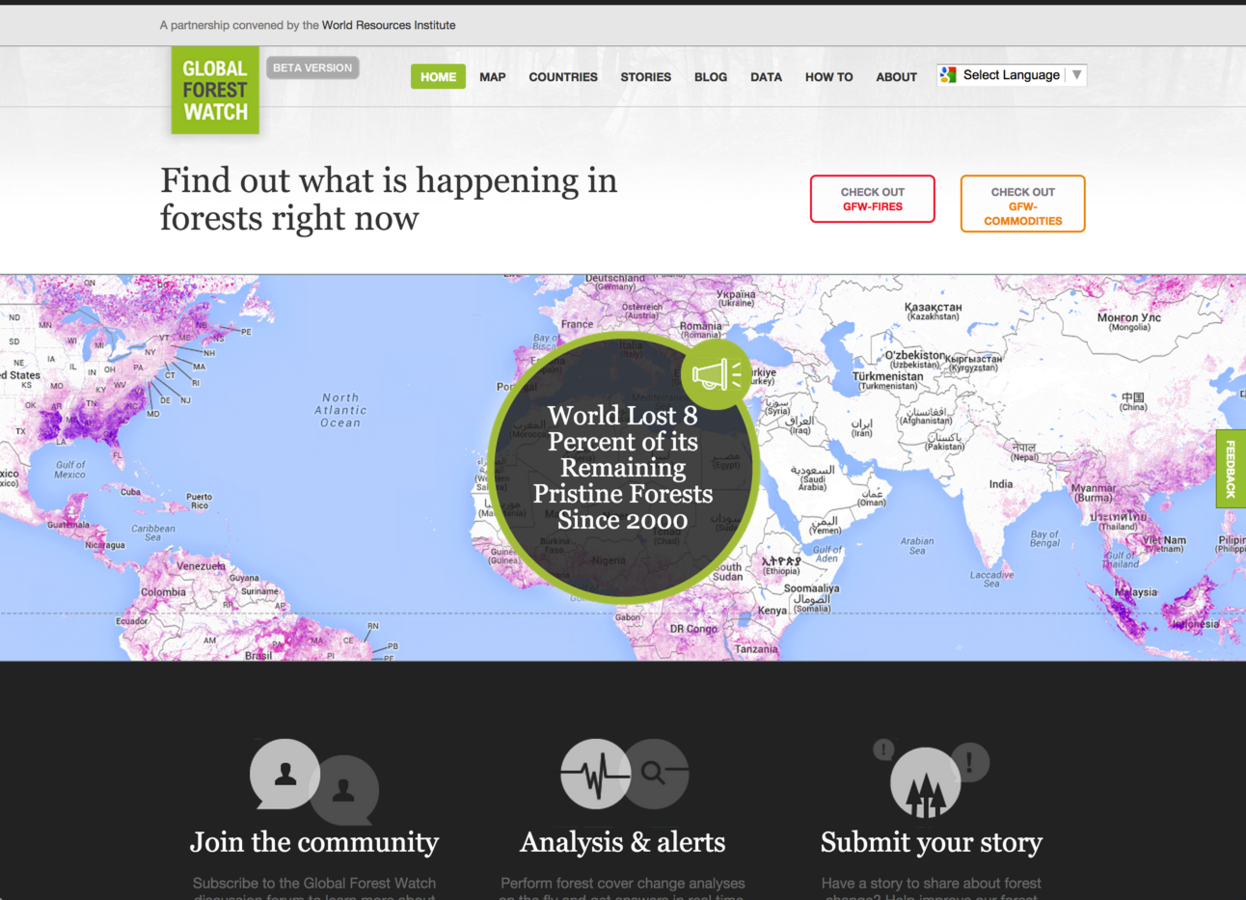
Demo!
FORMA
"Near real-time" forest loss
One guiding principle
Simplicity > optimal
You don't start with simplicity, simplicity is the goal"
- @leafletjs #foss4g
1 hour
human cost = 400x AWS cost
FORMA = imagery + stats
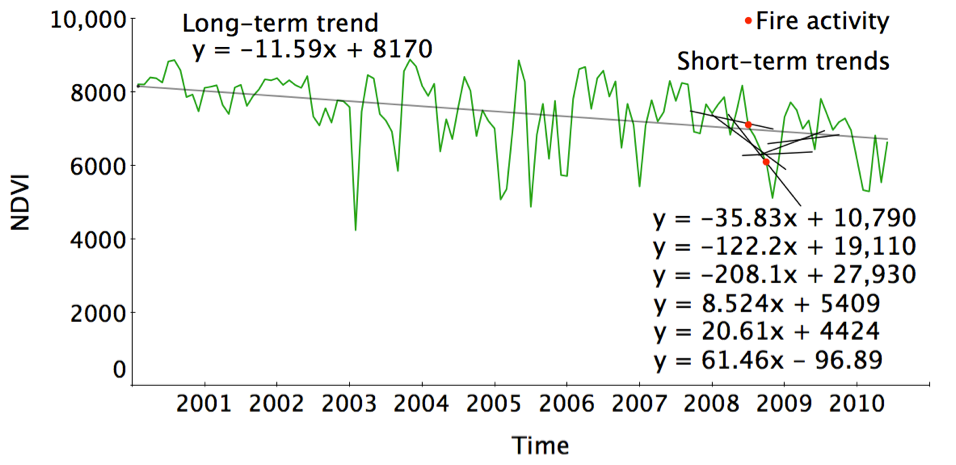
Green to brown + fires = forest loss?
-
Pixel time series
-
Spatial joins
-
Spatial filters
-
Regressions
1-2 desktops
- ArcGIS
- Python
- Stata/Numpy
How do you scale from 10k pixels to 100 billion?
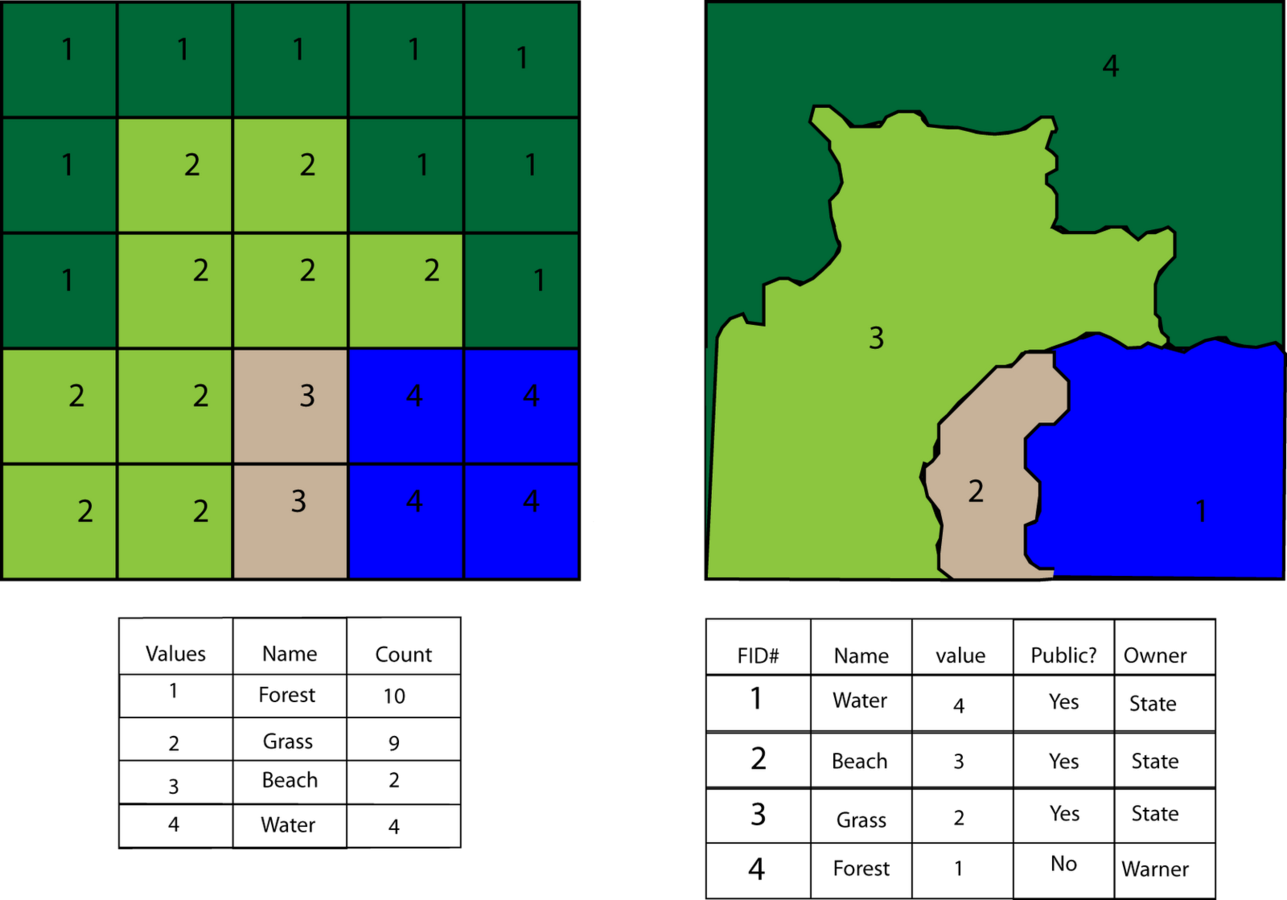
Everything is a raster


row col val
0 0 10
0 1 20
1 0 30
1 1 40
Rasters are text
Everything is text
Hadoop loves text!
But Hadoop isn't simple
Hadoop without the hassle

+

+
Cascalog
MapReduce, without thinking MapReduce
(def query
  (let [data-src [[0 0 10]
                  [0 1 20]
                  [1 0 30]
                  [1 1 40]]]
    (<- [?row ?col ?new-val]
        (data-src ?row ?col ?val)
        (* 5 ?val :> ?new-val))
> (??- query)
0 0 50
0 1 100
1 0 150
1 1 200Basic Cascalog
Simple join
pixel-src [row col val]:

0 0 10
0 1 20
1 0 30
1 1 40


country-src [row col country]:

0 0 "Japan"
0 1 "China"
1 0 "England"
1 1 "South Africa"
> (??- query)
0 0 "Japan10"
0 1 "China20"
1 0 "England30"
1 1 "South Africa40"(def query
(<- [?row ?col ?country-val]
(pixel-src ?row ?col ?val)
(country-src ?row ?col ?country)
(str ?country ?val :> ?country-val)))Aggregate count of hot fires, by country
fire-src [lat lon date kelvin]:

30 -120 "2014-09-10" 335
39 116 "2014-09-10" 335
6 106 "2014-08-25" 300
6 106 "2014-08-25" 350
6 105 "2014-09-09" 339

country-src [row col country]:

300 400 "United States"
250 2000 "China"
200 2000 "Indonesia"
> (??- fires-query)
"China" 1
"Indonesia" 2
"United States" 1(:use 'cascalog.api)
(:require '[cascalog.ops :as c])
(:use '[demo :only (latlon->row-col)])
(def fires-query
(<- [?country ?count]
(fire-src ?lat ?lon ?date ?kelvin)
(country-src ?row ?col ?country)
(latlon->row-col ?lat ?lon :> ?row ?col)
(< 330 ?kelvin)
(c/count ?count)))Pixel time series
pixel-src [row col date val]:

0 0 "2010-01-01" 10
0 0 "2010-01-02" 20
0 0 "2010-01-03" 30
0 0 "2010-01-04" 40
0 1 "2010-01-01" 50
0 1 "2010-01-02" 60
0 1 "2010-01-03" 70
0 1 "2010-01-04" 80
(use 'cascalog.api)
(use '[demo :only (build-series)])
(def timeseries-query
(<- [?row ?col ?start ?end ?series]
(pixel-src ?row ?col ?date ?val)
(build-series ?date ?val :> ?start ?end ?series)))> (??- timeseries-query)
0 0 "2010-01-01" "2010-01-04" [10 20 30 40]
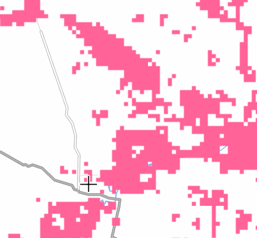
0 1 "2010-01-01" "2010-01-04" [50 60 70 80]"Vector tiles" - SQL
INSERT INTO gfw2_forma (x,y,date_array,z)
     (SELECT x, y, array_agg(undate) AS date_array, 16 AS z
FROM (SELECT floor(x/2) AS x, floor(y/2) AS y, unnest(date_array) AS undate
      FROM gfw2_forma WHERE z = 16) foo
GROUP BY x,y)"
{
    "rows": [
        {
            "x": 51480,
            "y": 32760,
            "sd": [
                86,
                98
            ],
            "se": [
                1,
                1
            ]
        },
etc.
}
It works, but ...
- Hard to test
- Statement timeouts
- Hard to automate
- Slow for large table
(defn zoom-out
  [n]
  (math/floor (/ n 2)))

(defn gen-tiles
  [x y z min-z]
  (if (= z min-z)
     [[x y z]]
     (conj (gen-tiles (zoom-out x) (zoom-out y) (dec z) min-z) [x y z])))

(defn prep-xyz
  "Stylized version"
  [src]
  (<- [?x2 ?y2 ?z2 ?period ?count]
      (src ?row ?col ?start-period ?series)
      (gen-period ?start-period ?series :> ?period _)
      (rowcol->latlon ?row ?col :> ?lat ?lon)
      (latlon->tile ?lat ?lon zoom :> ?x ?y ?z)
      (c/count ?count)))

(defn gen-all-zooms
  [src min-z]
  (<- [?x2 ?y2 ?z2 ?period ?count]
      (src ?x ?y ?z ?period)
      (gen-tiles ?x ?y ?z min-z :> ?x2 ?y2 ?z2)
      (c/count ?count)))

> (let [src (hfs-seqfile "s3n://path/to/data"
        min-z 7]
    (??- (gen-all-zooms (prep-xyz src))))
Gen tiles for 10 pixels or 100 billion
Calculate tile for one pixel, all zooms
Transpose time series, convert rowcol -> latlon -> xyz
Run it!
Same result, but
-
"infinitely scalable"
-
testable
-
totally reliable
-
fast enough
Lessons for
"big enough" geo data
Find - and use! - the right tools
- Hadoop
- StarCluster
- Spark
- Python multiprocessing
- AWS Simple Queue Service
- Google App Engine Task Queues
- GeoTrellis
Simple > optimal
1 hour of human = 400 AWS hours
Get creative
... about data formats
... about what geo means
Hadoop can be your friend, or your enemy ...
Questions?
@robinkraft
GlobalForestWatch.org
http://slides.com/wri/big-enough-foss4g