Monitoring microservices

What is this for?
To know what is going on with our running services.
How many users
% errors per requests
Is it running
Average time of response
# containers registered
# messages processed
error rate on B2B
General metrics:
Custom metrics:
Why is important?
It will give us information on how good or bad is our system performing.
We want to know before our customers know about an issue.
It gives us visibility on where to focus and alert us.

How does it work?

Micrometer
Actuator endpoints output metrics in a specific format that is readable for prometheus.
Micrometer exposes this data from our JVM and some automatic gather information. eg http calls

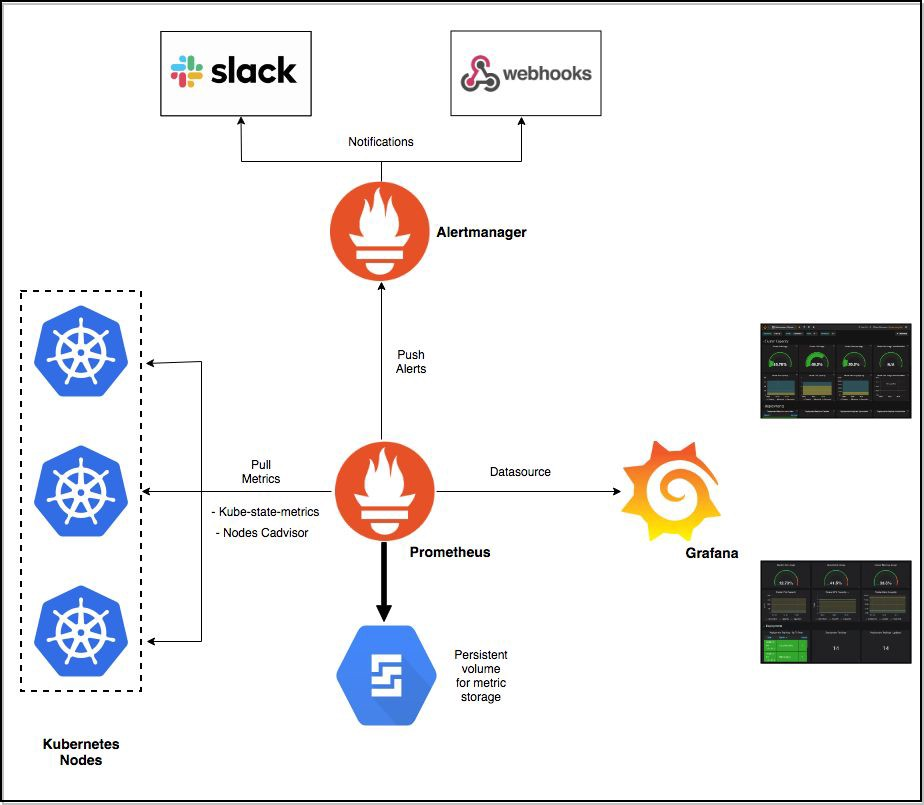
Prometheus
Polls every x seconds to each service to get this data in a specific format.
(like a file)
Prometheus can discover services from services like (consul, kubernetes, etc) so no hardcoded targets are needed.

AlertManager
Listen to alarms triggered by Prometheus configured rules and uses registered channels to notify (slack, pager, email, etc)
It has features like silencing an alert, promoting, non-repeating, etc.

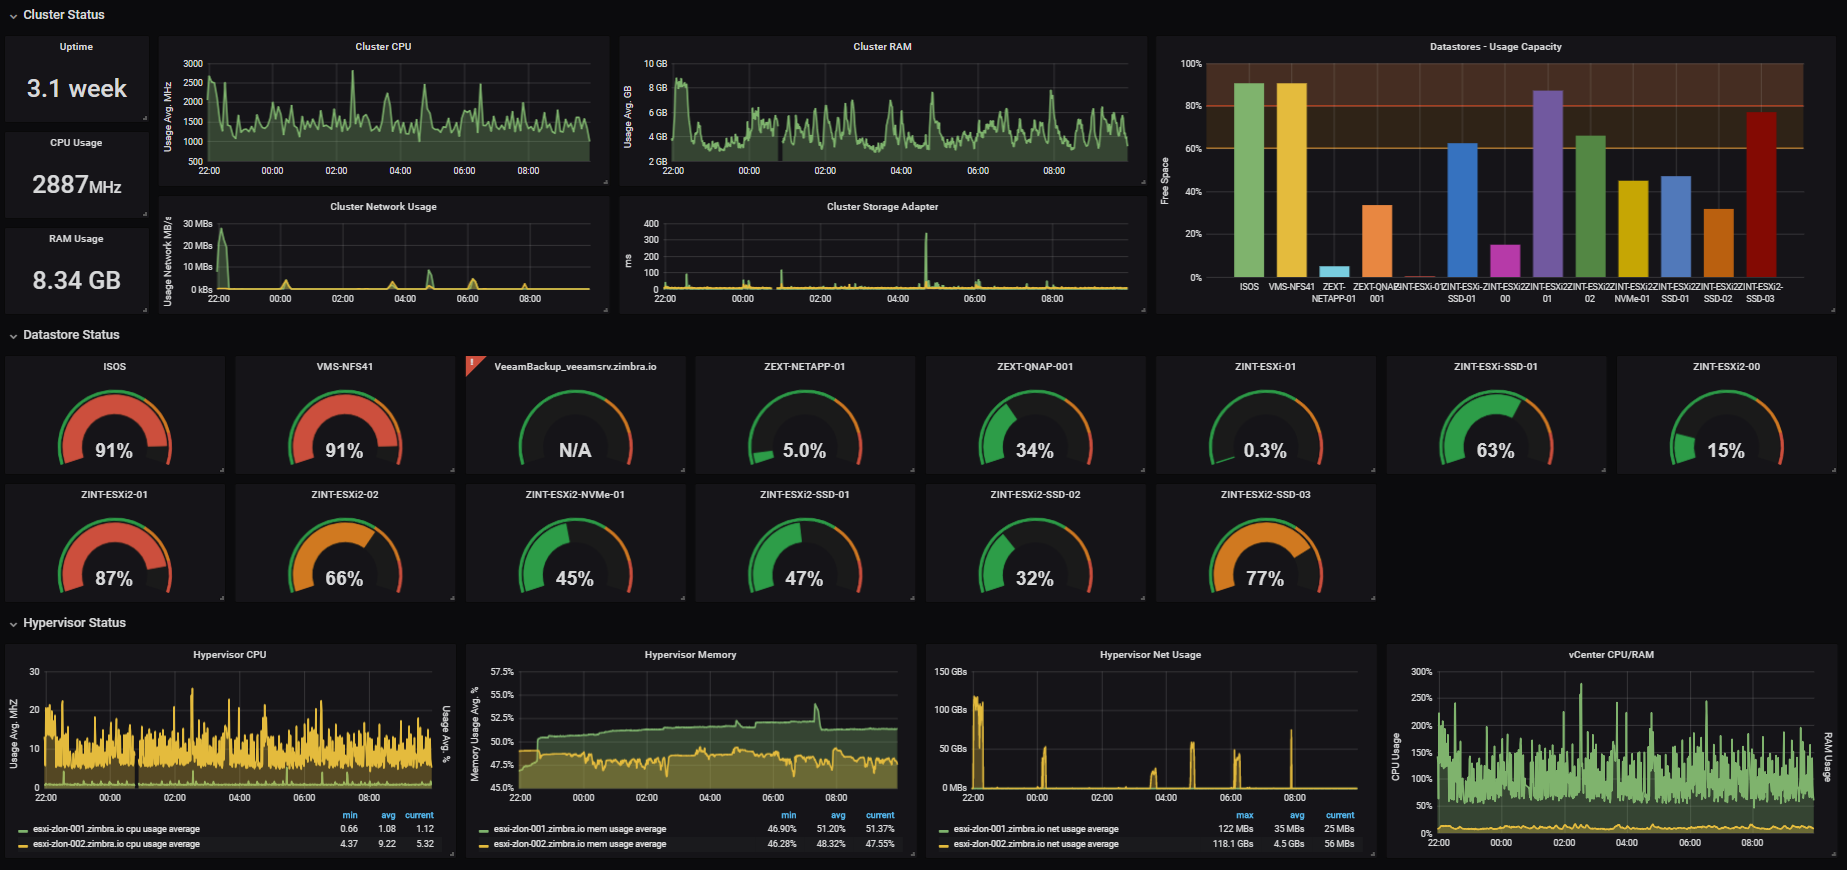
Grafana
Grafana can read from multiple sources and offers better graphs and user management.
It just reads from Prometheus and uses PromQL to set metrics.

DEMO!
Lets see it in action

How do use it?
- Clone from PoC repo your own and play with PromQL
- Create your own metrics and alerts.
- Load it with lots of requests and see how the graphs behave.
From next sprint:
- Use your credentials to see mawani dashboard and create your own to see data :)
Pending:
- Deploy to core-stg using ansible scripts.
- Deploy to kubernetes cluster using deployments.
- Define credentials for grafana.
- Make PRs for micrometer
- Make PRs for securing data points.
- Create TOKEN for data access only.
Links:
Learn PromQL:
https://medium.com/@valyala/promql-tutorial-for-beginners-9ab455142085
Create your own data points:
https://www.atlantbh.com/blog/custom_metrics_micrometer_prometheus_spring_boot_actuator/
Questions?