Stats x Performance

Skeepers Influence Workshop
2022-03-31
Program
Variability and Percentiles
Pareto & Amdahl Laws
Uncertainty and Error
Profiling Your Code
Variability and Percentiles

Example: Height


Distribution of heights in USA, source
Unending source of worries for first time parents
Height Distribution

"Normal" distribution
Important Distributions
Gaussian (normal)

Poisson: random incoming

Binomial: random coins

Zipf: word frequencies

Pareto: riches

Percentiles and Service
The average gives a biased idea of the experience
Percentiles tell a more complete story
Speaking about time per request:
- 50th percentile (median): half of all requests are above
- 90th percentile: 1 out of every 10 requests is above
- 99th percentile: 1 out of every 100 requests is above
Bad 99th percentile, at 100 requests per second:
One failure per second!
Exercise: Total Time
A request uses 10 servers in parallel

50th percentile is 50 ms
90th percentile is 200 ms
Estimate a minimum value for the average time per request
⮯
Exercise +
Simulate a Pareto distribution

xm = 28 ms
α = 1.16
As function U you can use
Math.random()
⮯
Exercise +
Simulate 100k Pareto samples
Compute average, minimum, maximum
Compute percentiles: 5, 50, 90, 95, 99, 99.9
To compute percentiles:
- Sort the array (as numbers!)
- For 50th percentile, go to the middle of the array
- For 90th percentile, go to position 90k
- ...
⮯
Exercise +
Now simulate requests with 10 calls to servers in parallel
= the maximum of 10 Pareto samples
Compute minimum, average, 50th and 90th percentiles
Are they the same as before?
⮯
Exercise +
Finally, simulate requests with 10 sequential calls to servers

=> the result of adding 10 Pareto samples
Compute 50th percentile
Is it 10 times bigger than before?
⮯
Exercise +
As an extra: simulate a request to 10 sequential servers,
each doing 10 requests in parallel

What is the average, minimum, 50th percentile?
⮯
Exercise +
This last part is not fiction
In 2009 a Google search used 1000 servers

Total time 200 ms
Can you think of any way to improve the response time?
⮯
Timed out!

Package pareto-simulator
Install pareto-simulator:
$ npm i -g pareto-simulator Now test a few commands:
$ pareto --xm 28
$ pareto --xm 28 --parallel 10
$ pareto --xm 28 --series 10
$ pareto --xm 28 --series 10 --parallel 10
$ pareto --xm 1 -n 1000 --parallel 30 --series 30 --timeout 10 --linear
What distributions do they remind you of?
Pareto Law

Rule of 80/20
A 20% of causes generates 80% of effects
Applies to a wide spectrum of phenomena:
- Distribution of land property ownership
- 20% of customers generate 80% of sales
- Distribution of cities by population

Optimization Work
Now it's time for hard work: optimize a service
It consumes too much:
- CPU
- memory
- file descriptors
- input/output buffers
- ...
Where do we start?
Locate 🔥hot spots🔥
That's Lucky!
🔥Hot spots🔥 follow the Pareto principle
20% of the code takes 80% of processing time
The law applies recursively...
4% of the code takes 64% of processing time
Is it worth it?

Amdahl Law
An Apparently Complicated Law


Easier

Exercise: Limits of Optimization
Request get in nodecached: 37250 rps
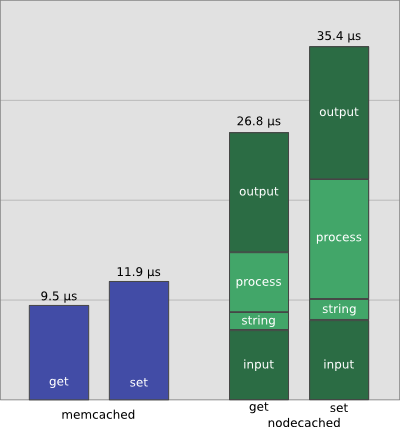
How much can we accelerate nodecached?
⮯
Exercise +
Let us focus on the get operation:
- 2 µs: string conversion
- 6 µs: internal processing
- 7 µs: input
- 12 µs: output
Let us suppose we optimize string and processing (0µs)
What is the theoretical maximum for requests per second?
⮯
Exercise +
Formula: R [rps] = 1000000 / t [µs]
Exercise of imagination:
What strategies can we follow to optimize more?
⮯
Accelerating!

Law of Diminishing Returns
As we go along in optimization, return of investment goes down
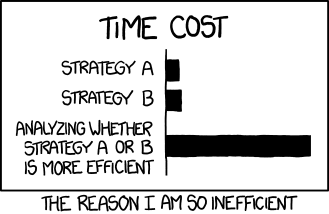
Careful with micro-optimization
Uncertainty and Error

Systematic and random errors

Systematic error

Random error
Types of Randomness


Exercise: Real Distribution
We want to measure the distribution of response times
Requests to service https://reqbin.com/echo
⮯
Exercise +
Download the loadtest project:
git clone https://github.com/alexfernandez/loadtest.gitTweak it to show the time for every request
Now send the tests:
node bin/loadtest.js https://reqbin.com/echo -k -n 15000 -c 100 --rps 300 Use rps above and below the value without --rps (e.g. 300 y 500)
⮯
Exercise +
Export the result to a file and extract all numerical values
$ command | grep -v INFO > service-times-300.csv Draw a histogram with the values
Draw a log-log histogram
What do graphs tell you?
⮯
Awesome!

Exercise +
Profiling Code

Profiling with microprofiler
Package microprofiler
Allows finding out where processing time is spent
Thin layer on
process.hrtime()
Sections of code are instrumented:
const start = microprofiler.start() Start measuring:
microprofiler.measureFrom(start, 'label', 10000) Measures time between
start() and measureFrom()
Shows a summary for
label every 10000 callsNative Profiling
Node.js includes a nice profiler:
$ node --prof ... It generates a file like
isolate-0x440c2f0-28473-v8.log
It can be interpreted with the command:
node --prof-process isolate-0x440c2f0-28473-v8.log Output has three parts:
-
[Summary]: Summary of times -
[JavaScript],[C++ entry points]: Sections by language -
[Bottom up (heavy) profile]: Hierarchical profile
Flamegraphs

Flamegraph Packages
Package 0x
Live demo
Exercise: Saving Microseconds
We want to optimize the code for pareto-simulator
Where are we spending most time?
Two alternative approaches
⮯
Exercise +
Clone package pareto-simulator
$ git clone https://github.com/alexfernandez/pareto-simulator.git
$ cd pareto-simulator
Install microprofiler
$ npm i microprofiler Read the instructions
⮯
Exercise +
Instrument the code:
const microprofiler = require('microprofiler');
...
	computeSamples() {
		for (let i = 0; i < options.number; i++) {
        	const start = microprofiler.start()
			const sample = this.computeSample()
			microprofiler.measureFrom(start, 'sample', 10000)
			this.samples.push(sample)
			this.sum += sample
			if (sample > this.max) this.max = sample
			if (sample < this.min) this.min = sample
			microprofiler.measureFrom(start, 'stats', 10000)
		}
	}
Run and see the results:
$ node index.js --xm 1 -n 1000 --parallel 30 --series 30 --timeout 10 --linear
⮯
Exercise +
Now instrument the function
computeSample()
Look for any surprises
Try to find some optimization...
And measure again
⮯
Exercise+
Now let's run the Node.js profiler:
$ node --prof index.js --xm 28 -n 10000000 And now check out the output:
$ node --prof-process isolate-0x...-v8.log
Is anything surprising?
Can you imagine how to improve it?
Is this profiler as agile as microprofiler?
⮯
Good job!

Bibliography
pinchito.es: Optimizando sockets con node.js
pinchito.es: node.js: ¿rápido como el rayo?
pinchito.es: Pruebas de carga
Node.js: Flame Graphs
Netflix Tech Blog: Node.js in Flames