The Value of a Millisecond:
Harnessing Information in Fast, Fragmented Markets
paper by Chen, Foley, Goldstein, and Ruf
discussion by Andreas Park

Research Question
Who benefits from a speed bump on marketable orders that provides a speed advantage to some limit orders?
Answers
- HFTs liquidity providers: larger profits on the speed-bump venue.
- Aggregate liquidity worsens.
- Liquidity providers: lower profits on remaining venues.
Speed Bumps
The famous case: IEX's Speed Bump
- main idea: orders into IEX are slowed down by 350 milliseconds but updates SIP data (=NBBO) faster.
- => NBBO pegged orders trade at "fresh" prices
- Chicago Exchange proposes “Liquidity Taking Access Delay"
- Incoming marketable orders get delayed by 350 microseconds, limit order cancellations do not

Speed Bumps
- all orders send to TSX Alpha Exchange are randomly delayed, between 1-3 milliseconds
- the exception are "post-only" orders which are not subject to the delay
Here: TSX Alpha Exchange

- higher maker fee:
- 16 cents per 100 shares vs
- 14 cents per 100 shares
- minimum posting size

Cost of using post-only?
How do you benefit from post-only?
market event
expect market orders
200 shares
100 shares
500 shares
before
at the ask
How do you benefit from post-only?
market event
expect market orders
200 shares
100 shares
500 shares
after
cancels
Comment 1:
Many things happened at the same time
- TMX Select was closed
- Alpha fees became inverted
- Alpha introduced a speed bump
- Alpha became "unprotected"
- Brokers/marketplaces could "trade-through" Alpha's prices
1 event = 4 changes
Comment 2: Endogeneity of Adverse Selection measures in the paper
General Idea:
- the speed bump protects liquidity provider against adverse selection
- => avoid posted orders to become stale and can cancel ahead of market orders
Defining an informed order
- Step 1: Collect strings of trades
- = trades within 50 milliseconds
- Step 2: Informed = displaced/absorbs entire NBBO (i.e. across multiple markets)
- accounts for
- the trade itself
- plus trades by others
- plus cancellations!
- What if the NBBO is only 100 shares?
- Creates an endogeneity when speed bumps are introduced!
- accounts for
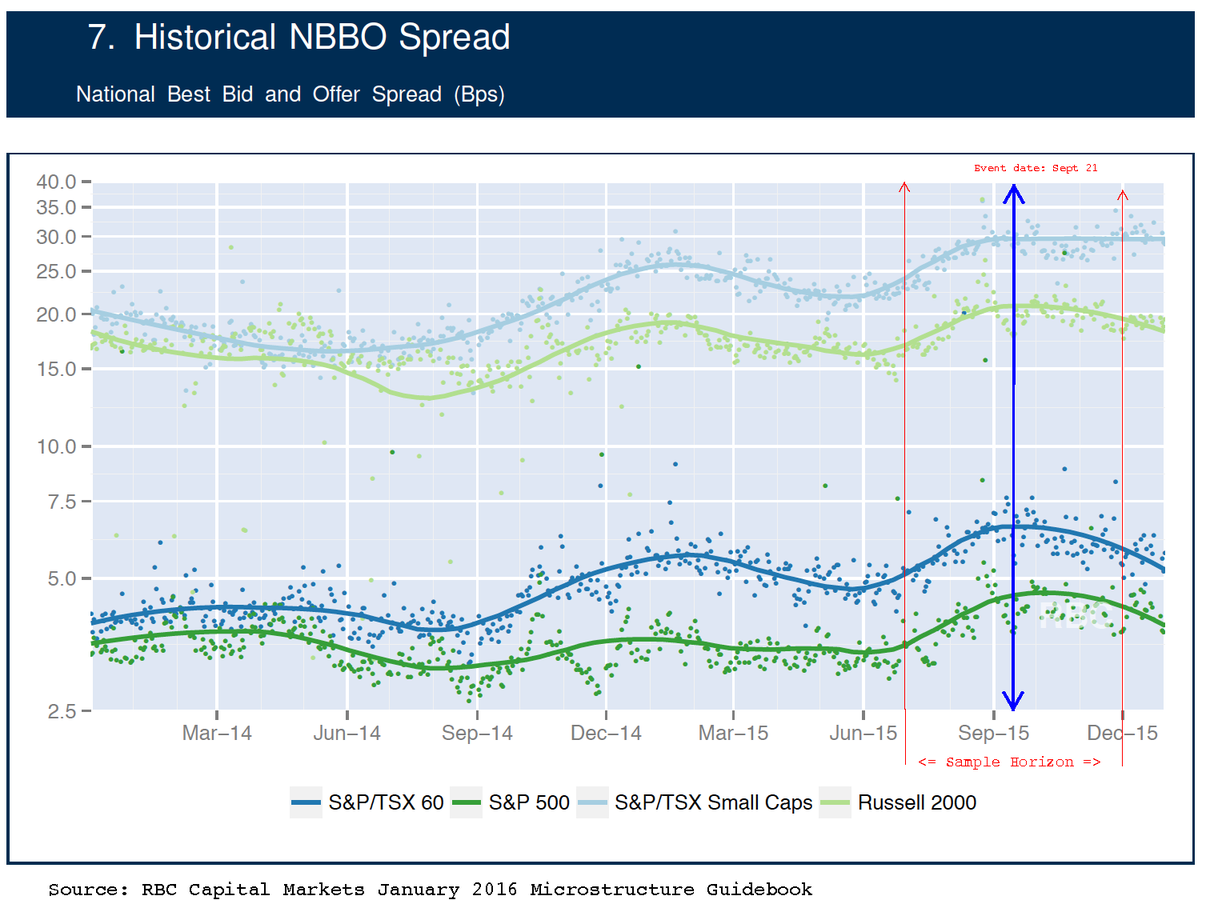
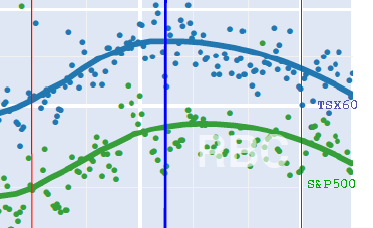
Comment 3: Did spreads change?
Comment 4: Beware of retail orders
Retail Myth 1:
(not this paper, but generally)
"retail trades are small"
| Price level | retail | non-retail |
|---|---|---|
| $1-$5 | 1,486 | 697 |
| $5-$10 | 791 | 413 |
| $10-$25 | 422 | 266 |
| >$25 | 275 | 203 |
average volume for single-market marketable orders
Retail Myth 2:
"retail trades are single-market and small"
| Price level | retail | non-retail | %retail | minimum size Alpha |
|---|---|---|---|---|
| $1-$5 | 5,100 | 5,797 | 26% | 5,000 |
| $5-$10 | 2,134 | 2,378 | 17% | 3,500 |
| $10-$25 | 1,032 | 1,128 | 27% | 1,000 |
| >$25 | 664 | 719 | 17% | 500 |
average volume for multi-market marketable orders
=> retail trades are neither small nor trade on only one market
HANDLE WITH CARE: "retail orders, on average, are unlikely to need to execute quantities larger than the 5 board lot minimum Alpha enforces"
Smaller Comments on Results and Interpretation
- "[The change] increase[s] profits for liquidity providers on [...] Alpha but [...] liquidity suppliers’ profits [are] reduced across remaining venues."
- Often these will be the same entities: do they just cross-subsidize and costs/benefits net to zero?
- NBBO Computation for Alpha trades - does it include Alpha?
- would explain quote-fade/fill rate result
overall I like many of the results, and I believe that they make intuitive sense, but I think the construction of measures requires work
Results and Interpretation
- informed=consume all liquidity
Tight spreads: 50-80% of trade-strings consume all liquidity
Wide spreads: significantly lower levels of informed.- I am sympathetic to the measure
- BUT: Way too much informed trading! If depth is low, too much will be absorbed
- The fill-rate measure has to be explained more thoroughly, e.g., by using examples.
overall I like many of the results, and I believe that they make intuitive sense, but I think the construction of measures requires work
Broker Activities
| Broker | %Vol |
|---|---|
| Anonymous | 24% |
| CIBC | 13% |
| TD | 11% |
| RBC | 9% |
| BMO | 5% |
| Scotia | 5% |
| National Bank | 4% |
| Merrill | 4% |
| Instinet | 2% |
| Morgan Stanley | 2% |
Source: RBC Marketstructure Guidebook Jan 2016

Who are the retail brokers? RBC & TD?
- are the largest retail brokers
- have many institutional clients
Comment on Results on Adverse Selection
- Result: Adverse Selection on Alpha declines
- => makes perfect sense to me
- hard to show in the data, but apparently one retail broker send all its flow there first.
- lower realized spreads for non-HFT liquidity provision on Alpha also makes perfect sense
- => only get to trade once the HFTs stepped out of the way
Effects on other venues
- "Section 4 establishes that Alpha’s systematic order processing delay against marketable orders enables the segmentation of uninformed order flow"
- statement much too strong!
- Question: with minimum post size, what is the ratio of depth Alpha/depth rest when Alpha at NBBO?
- Feature of TSX Composite:
- around 180 of 250 have 1-2 cent spreads
- rest has very wide spreads
- Suggestion: split sample!
my view: take with huge grain of salt due to the many simultaneous changes
Conclusion
- Paper has a lot of good stuff/ideas
- Interesting event
- Need to tighten data collection:
- What is a string? What is informed?
- Good call to move away from retail segmentation (old version) as it's too speculative
- Personal and subtle note: your results on retail flow segmentation contradict your findings in your recent JFE...