Méga-analyse: inférence
bayésienne standard et au niveau du champ
Arnaud de Mattia, Christophe Yèche
CEA Saclay, Irfu/DPhP
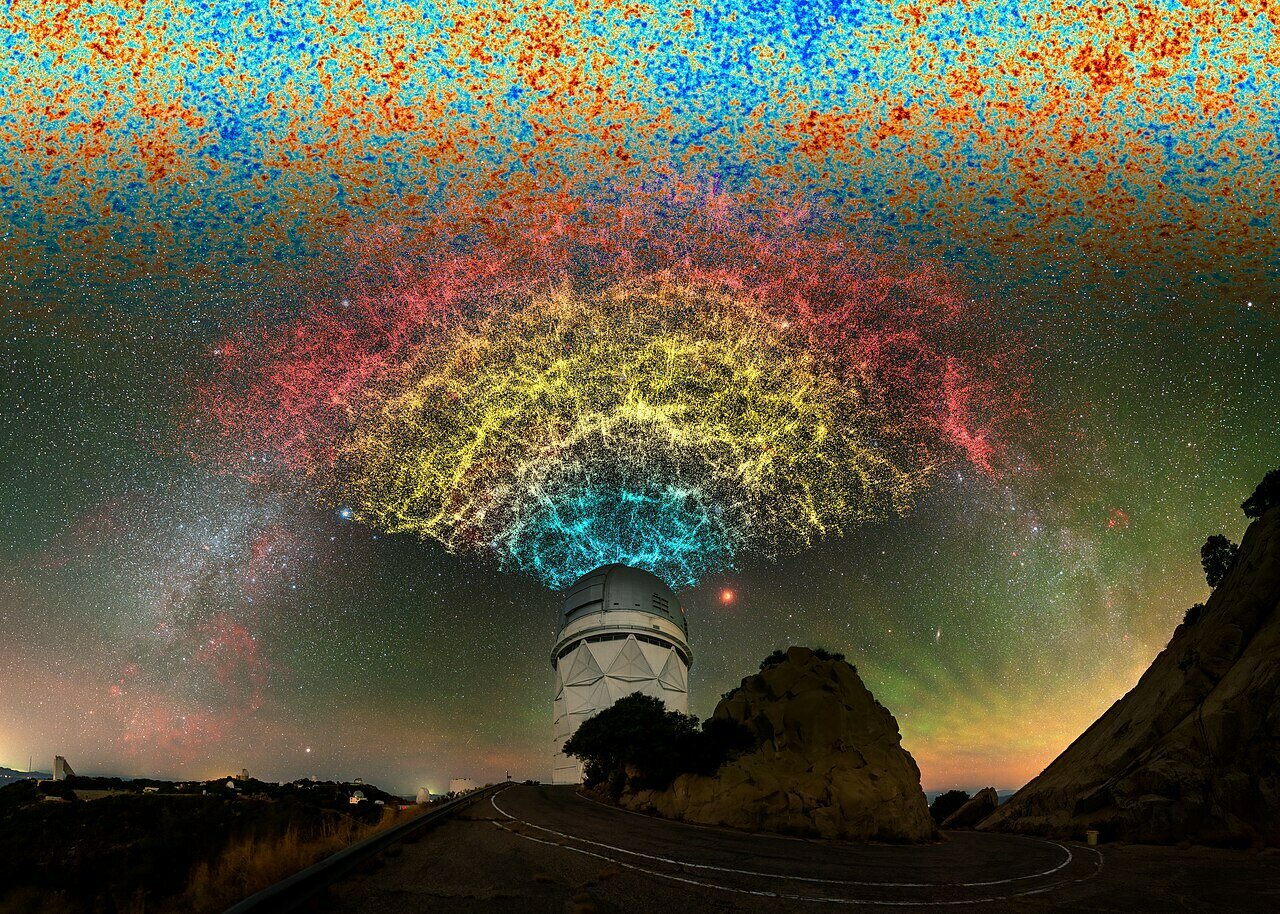
Stage IV experiments: DESI
2021 - 2025: 40M redshifts at \(0 < z < 3\) over \(14 000 \; \mathrm{deg}²\)
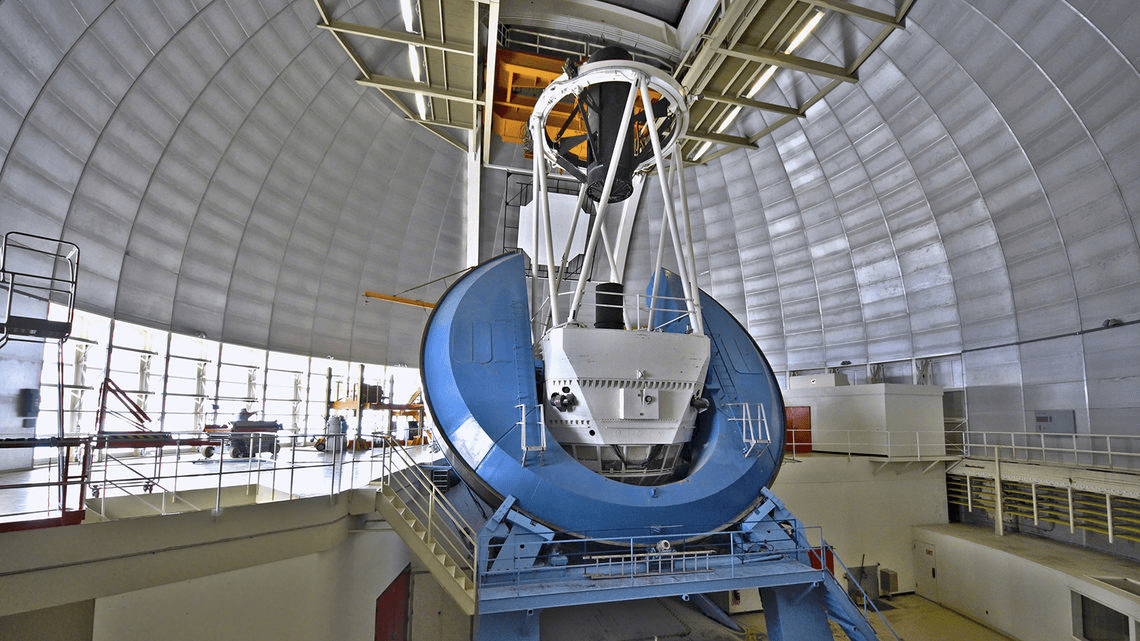
Mayall Telescope at Kitt Peak, AZ
5000 robotically-positioned spectroscopic fibers
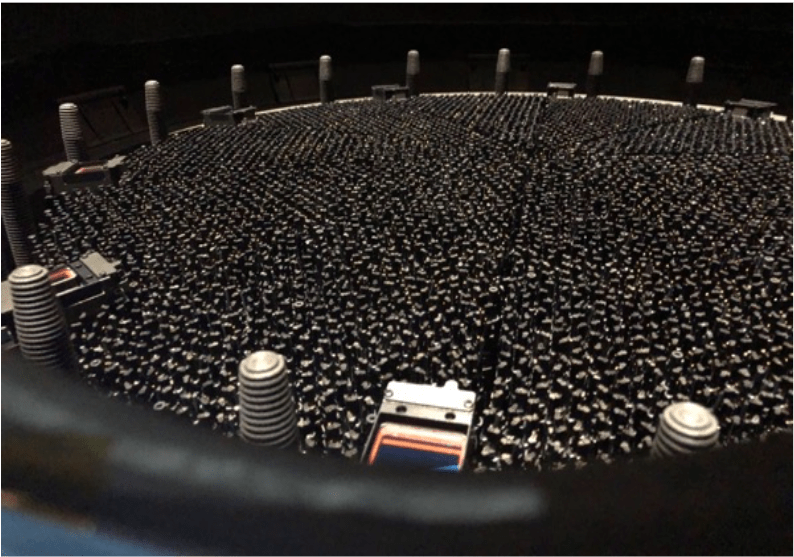
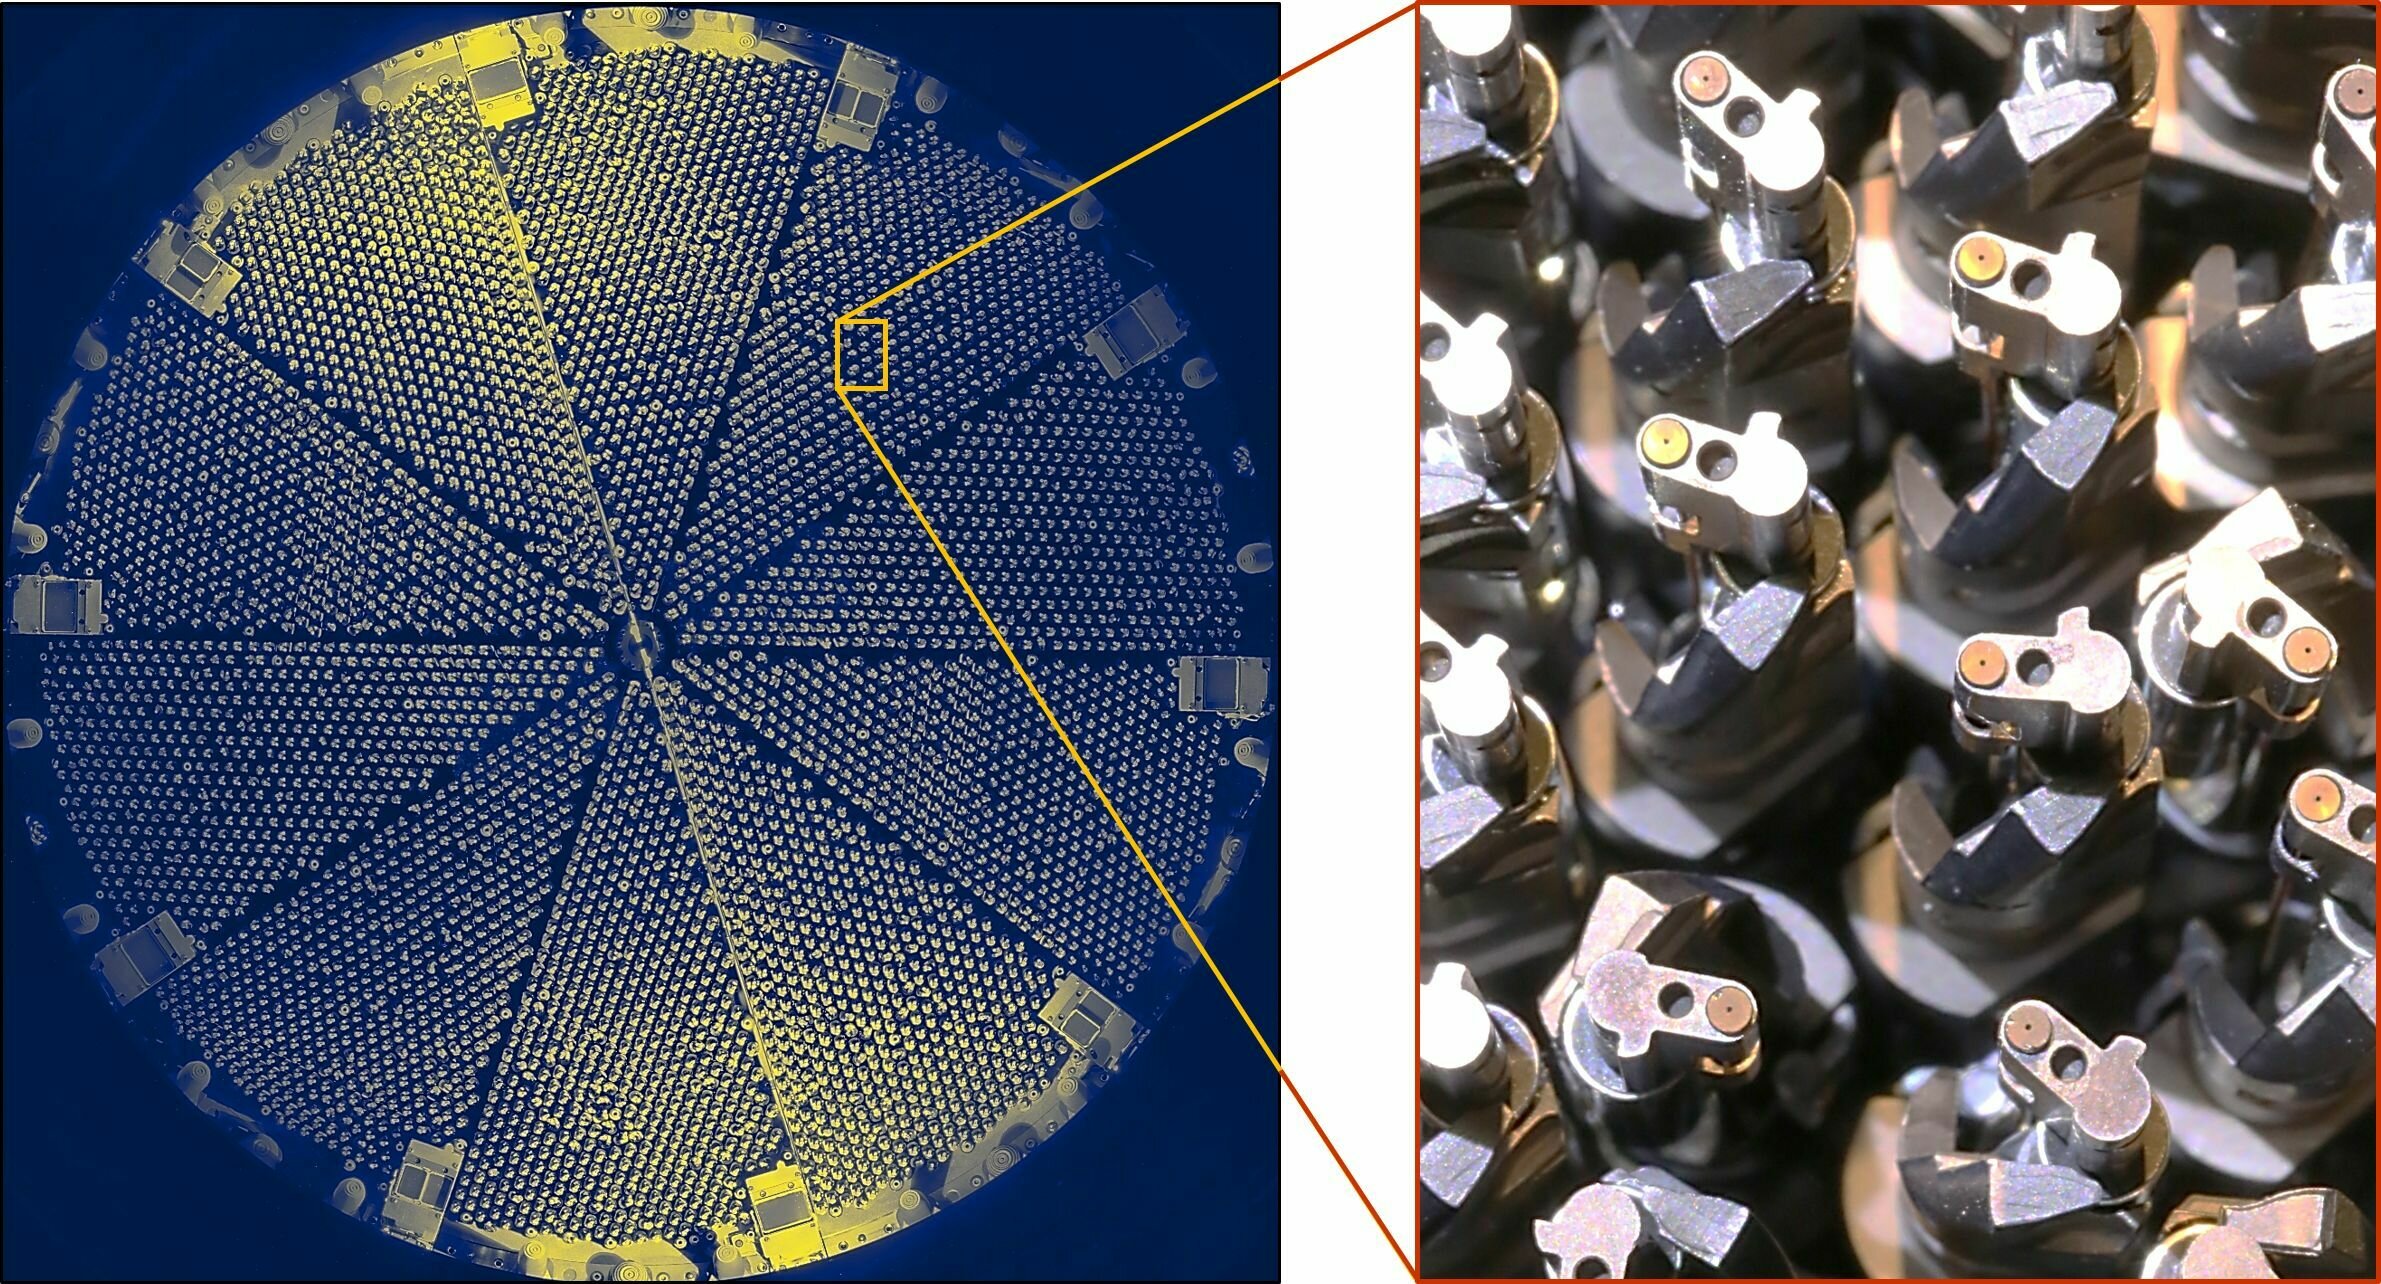
robotic positioners
Taken from Zhao et al. (2020)
DESI
Credit: NSF
Spectroscopic galaxy surveys


imaging surveys (2014 - 2019) + WISE (IR)
target selection
spectroscopic observations
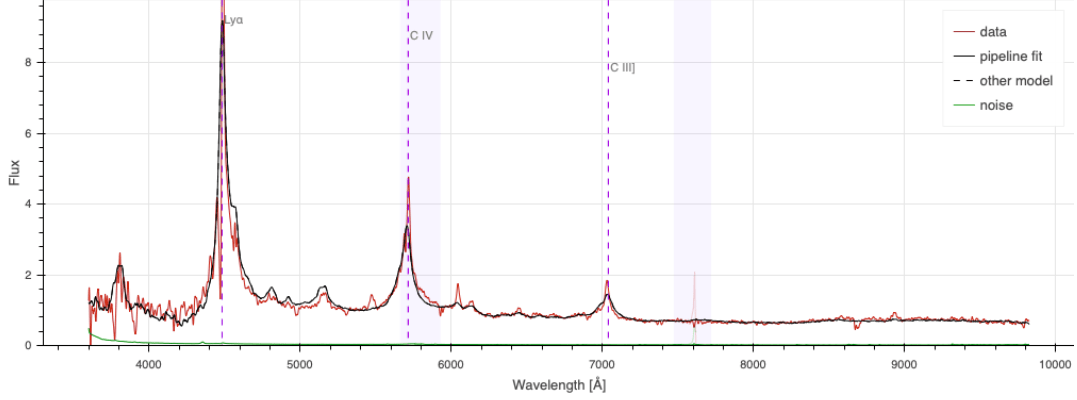
spectra and redshift measurements
- two steps: photometry and spectroscopy ⇒ selection effects
- catalog of angular positions \(\mathrm{R.A.}, \mathrm{Dec.}\) and redshifts \(z\)
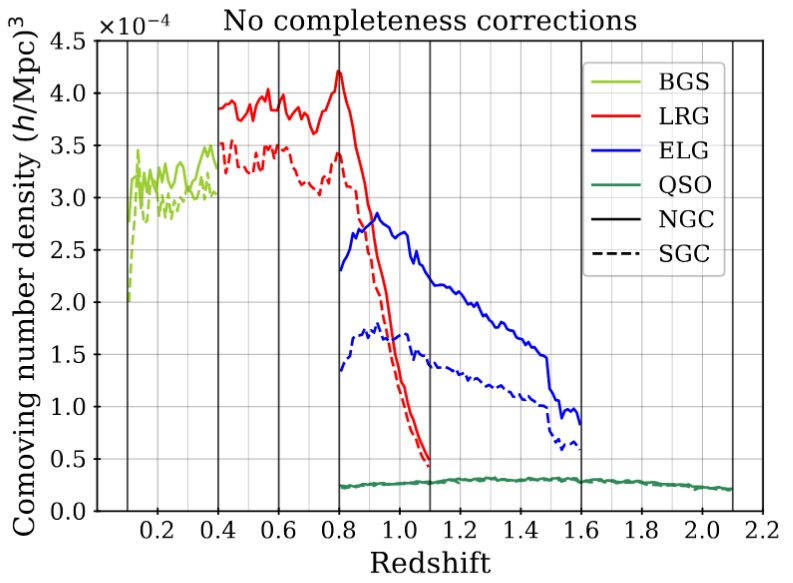
DESI Y5 galaxy samples
Bright Galaxies: 14M (SDSS: 600k)
0 < z < 0.4
LRG: 8M (SDSS: 1M)
0.4 < z < 1.1
ELG: 16M (SDSS: 200k)
0.6 < z < 1.6
QSO: 3M (SDSS: 500k)
Lya \(1.8 < z\)
Tracers \(0.8 < z < 2.1\)
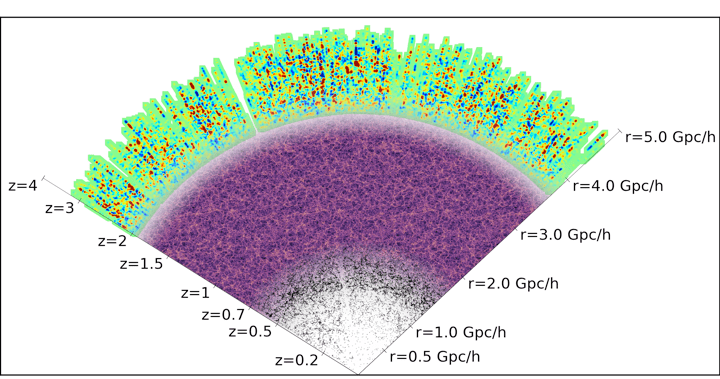
Y5 (DR1-DR2-DR3) \(\sim 40\)M galaxy redshifts!
\(z = 0.4\)
\(z = 0.8\)
\(z = 0\)
\(z = 1.6\)
\(z = 2.0\)
\(z = 3.0\)
DESI cosmological constraints
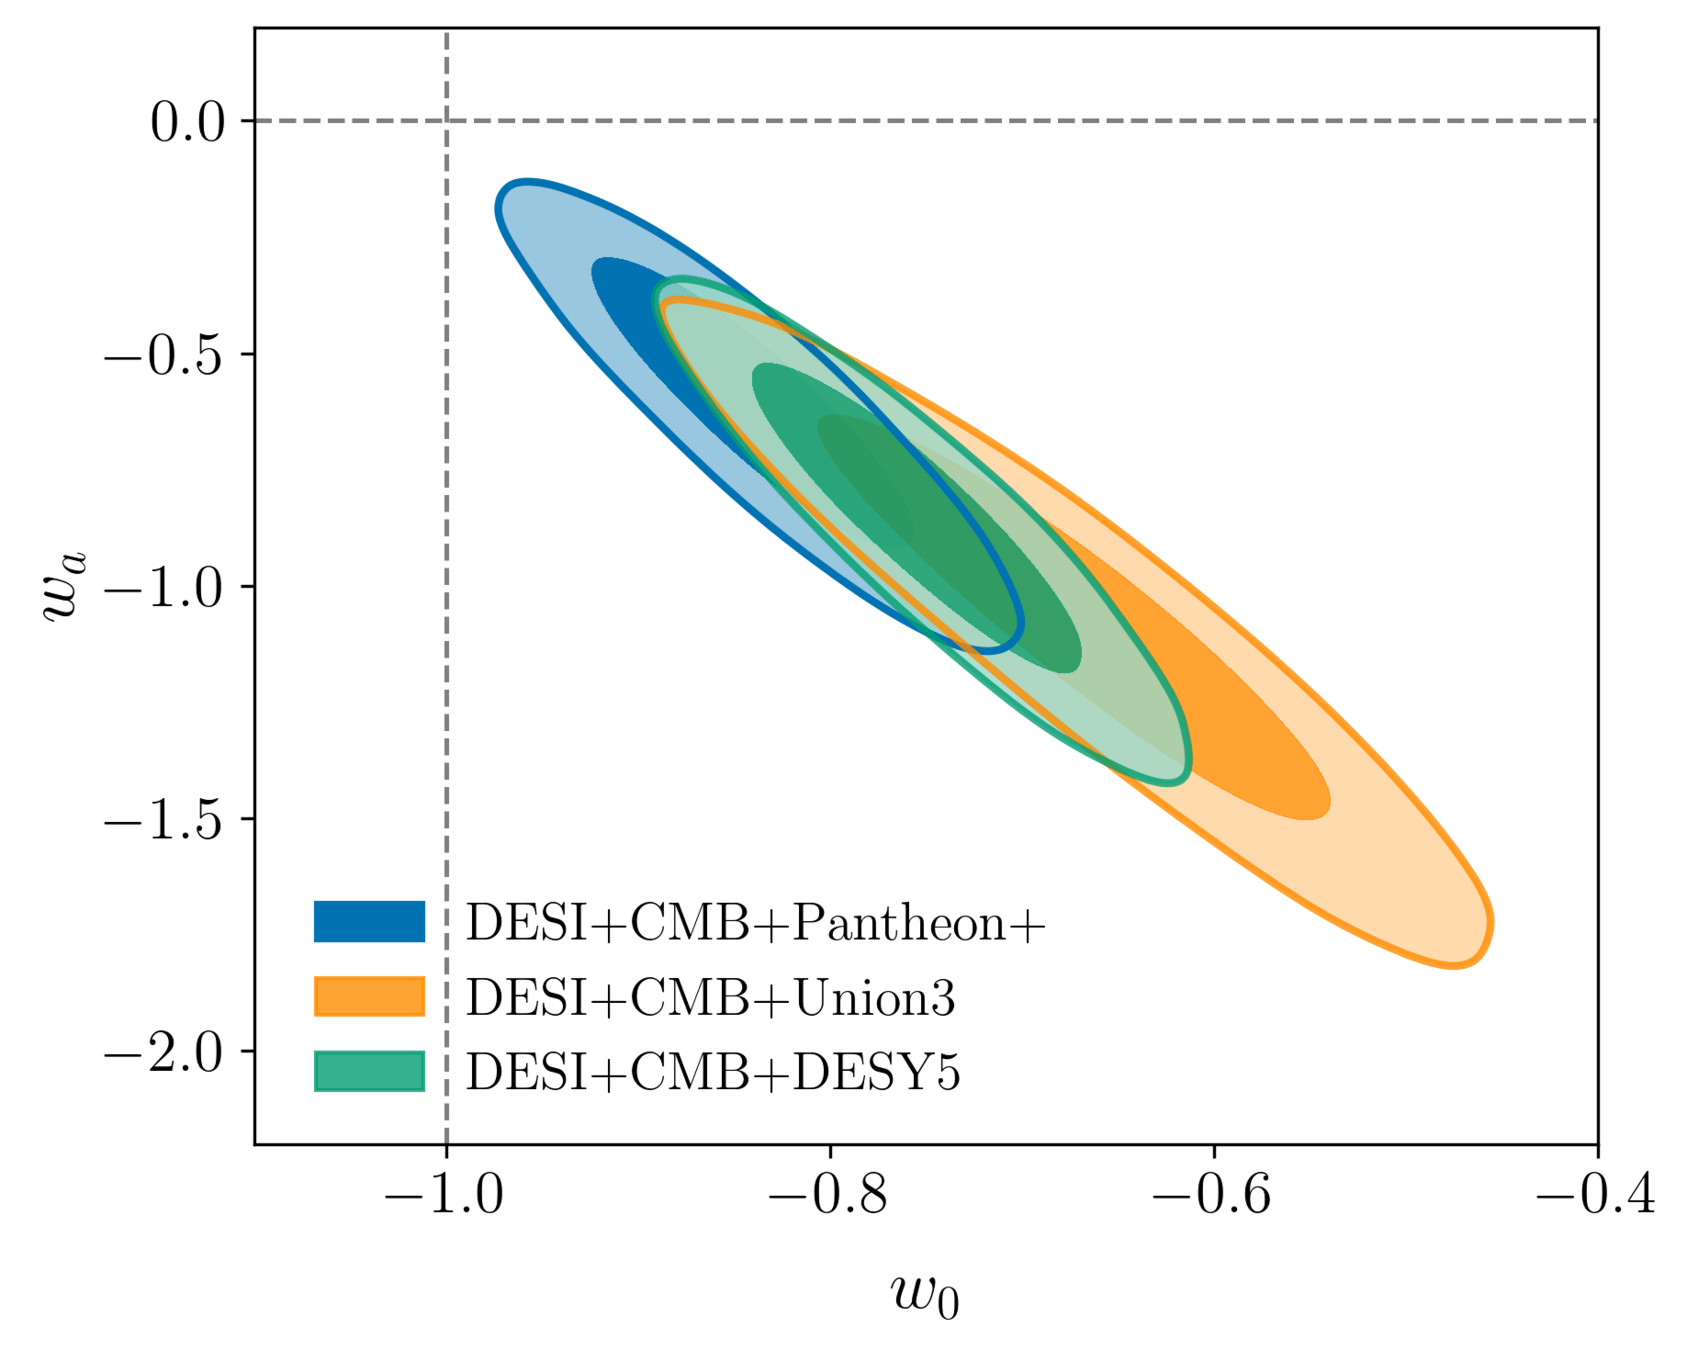
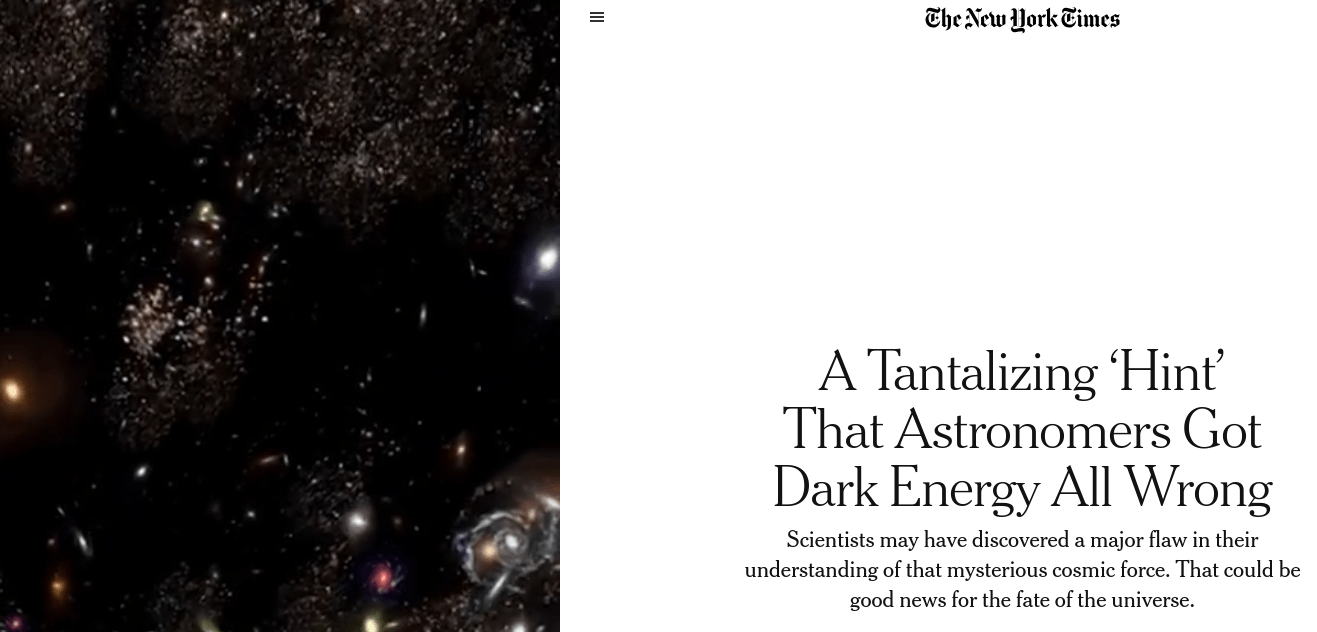
Measuring dark energy
\(\Lambda\)
2024
2025

DESI cosmological constraints
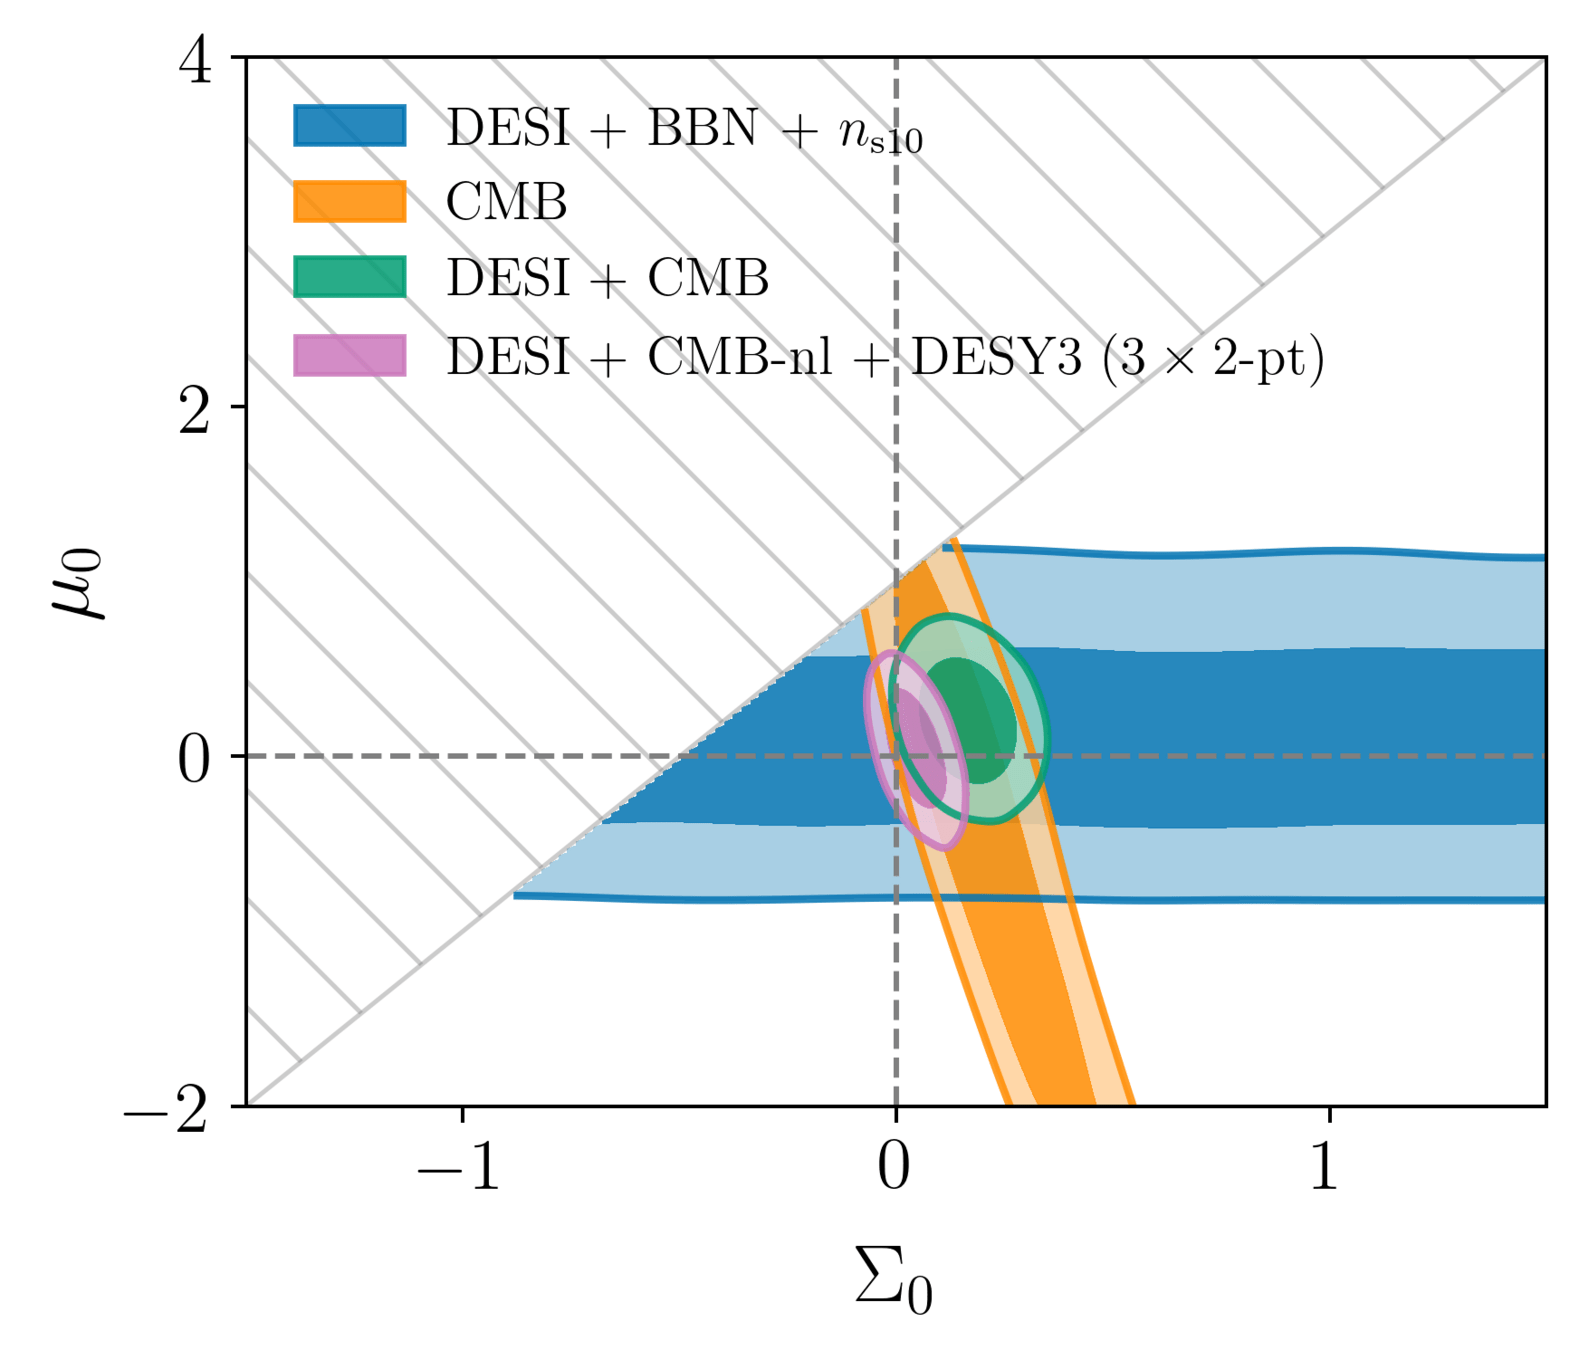
GR
Measuring dark energy
\(\Lambda\)
Testing general relativity
(Isotropic) correlation function
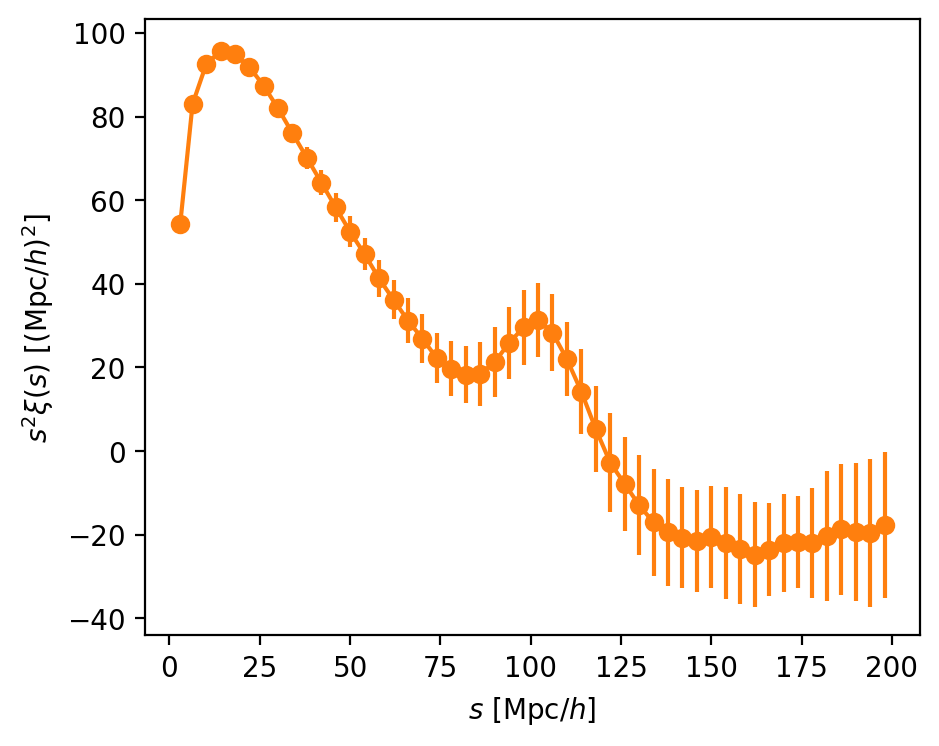
separation between galaxies
correlation function
excess probability that 2 galaxies are close
\(<0\) as \(\int d^3s \xi(s) = 0\)
excess probability that 2 galaxies are close
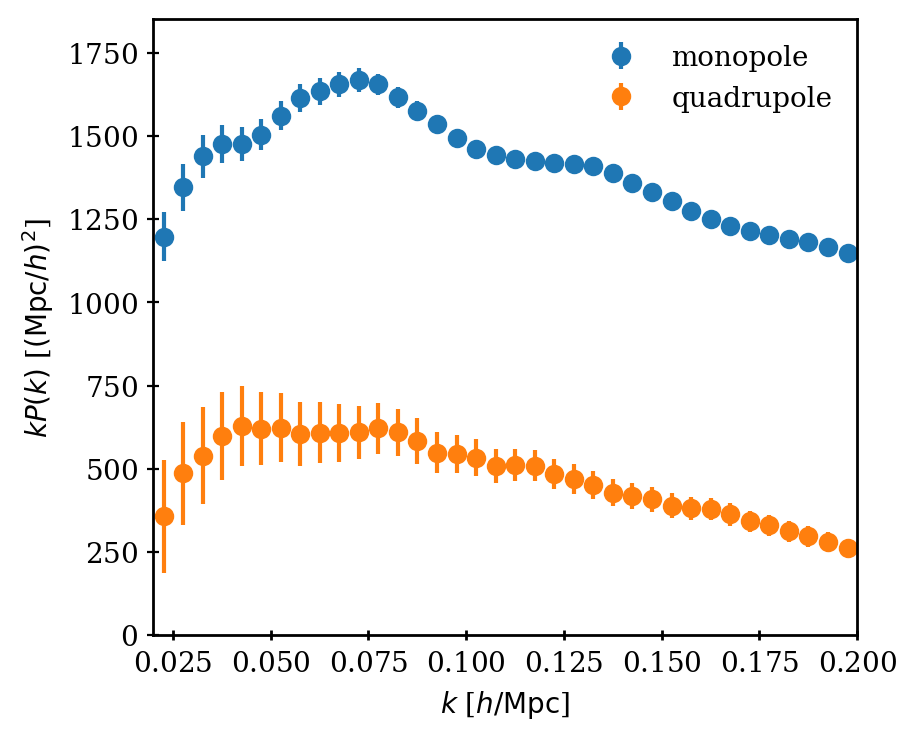
(Isotropic) power spectrum
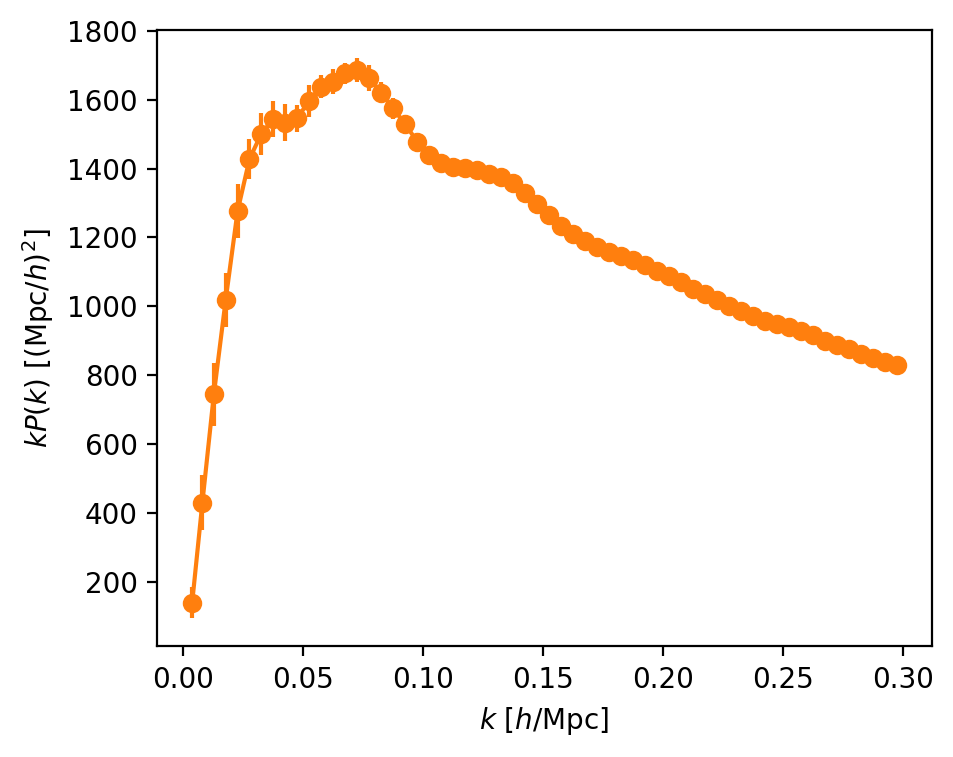
power spectrum
wavenumber
small scales
large scales
Likelihood
Taken from Zhao et al. (2020)
We usually assume a Gaussian likelihood
theory model
data vector
(\(P_\ell(k)\) or \(\xi_\ell(s)\))
parameters
covariance matrix
- Full Shape fit: \(A_\mathrm{s} \text{ or }\sigma_8, \omega_\mathrm{cdm}, h, n_\mathrm{s}\)
- BAO fit: \(\alpha_\mathrm{iso}, \alpha_\mathrm{ap}\)
+ bias or "nuisance" parameters
analytic or based on fast simulations
We sample the posterior \(p(\red{\mathbf{\theta}} | \mathbf{d}) \propto p(\mathbf{d} | \red{\mathbf{\theta}}) \red{p(\mathbf{\theta})}\)
prior
In a nutshell
Taken from Zhao et al. (2020)

galaxy catalog
galaxy power spectrum (or correlation function)
cosmological constraints

"variance of the density field as a function of scale"
Full Shape
Mega-analysis
Taken from Zhao et al. (2020)
- In addition to galaxy clustering analyses, cosmological constraints can be obtained with correlations of galaxy clustering and galaxy and CMB lensing
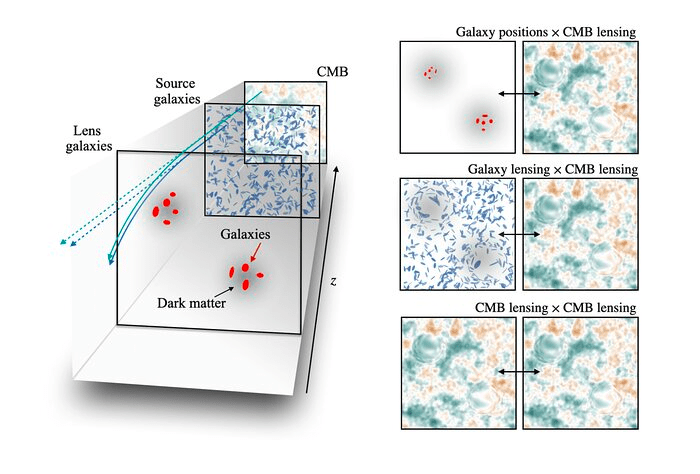
- For the DESI Y5 sample (timeline: within 2 years)
- Requires mocks simulating jointly galaxy clustering and lensing
Field-level inference
Fit the observed (discretized) field
Sample the initial cosmic density field

initial density
final density
Field-level inference (benchmark)
more efficient
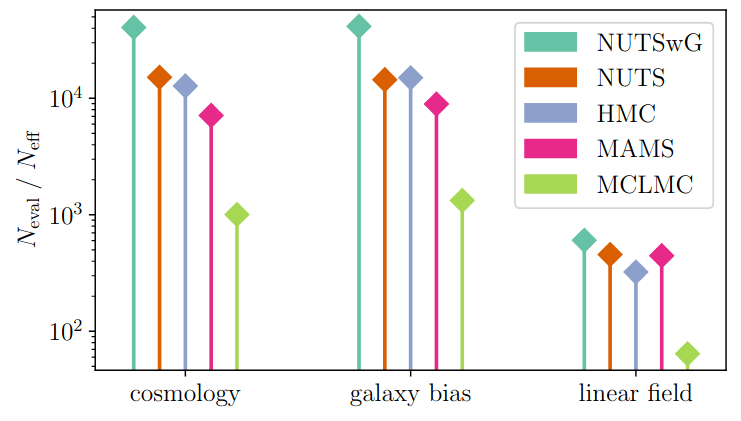
gradient-based samplers
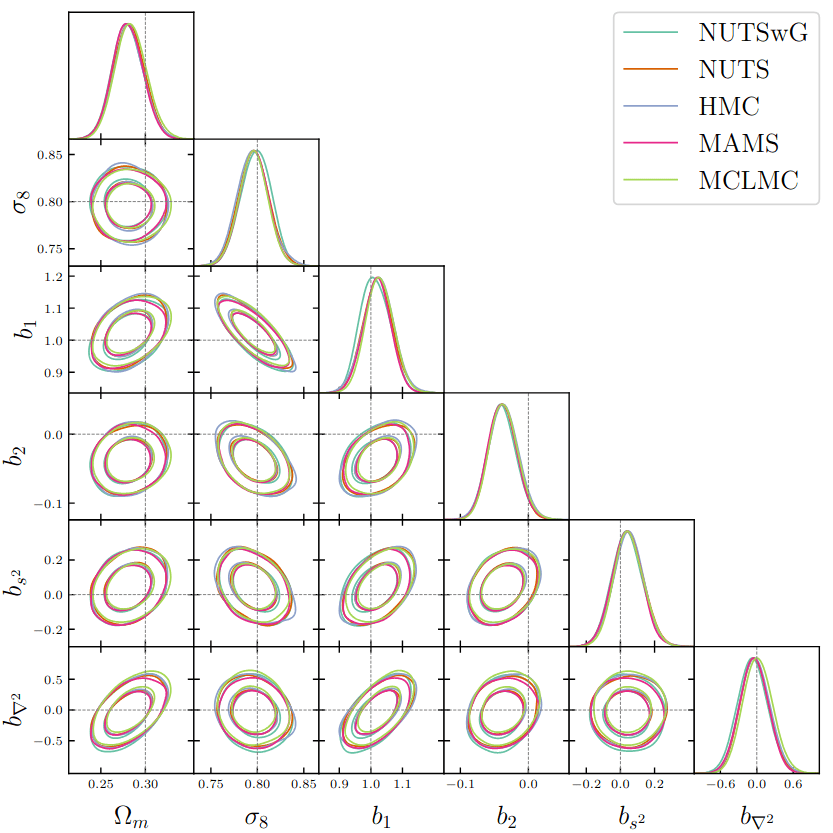
Field-level inference (benchmark)
gradient-based samplers
more efficient
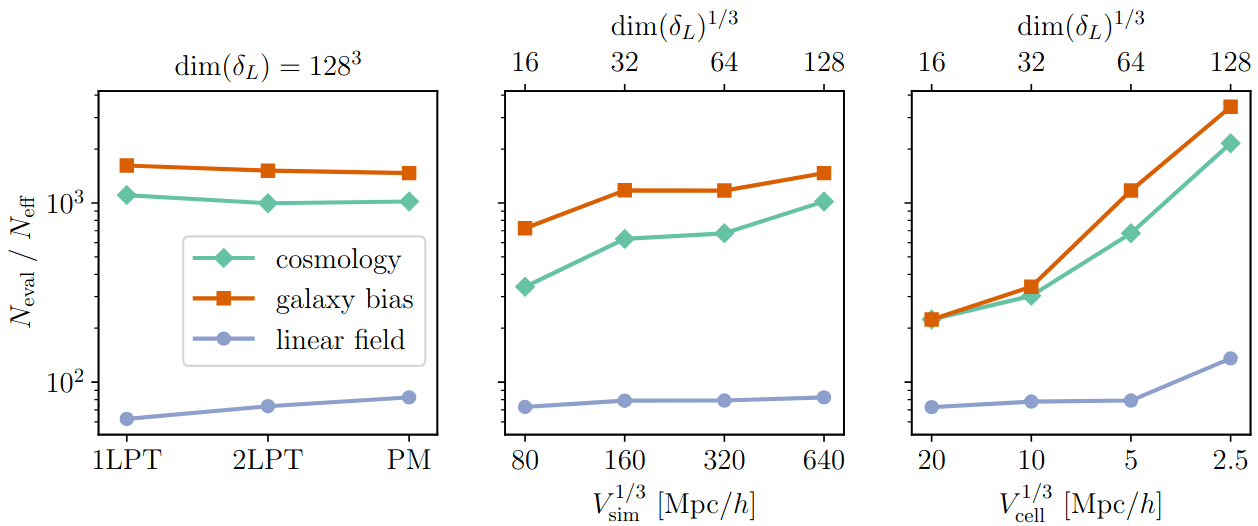
efficiency almost constant with dimension
\(10^6\) parameters \(\simeq 8\) GPU hours
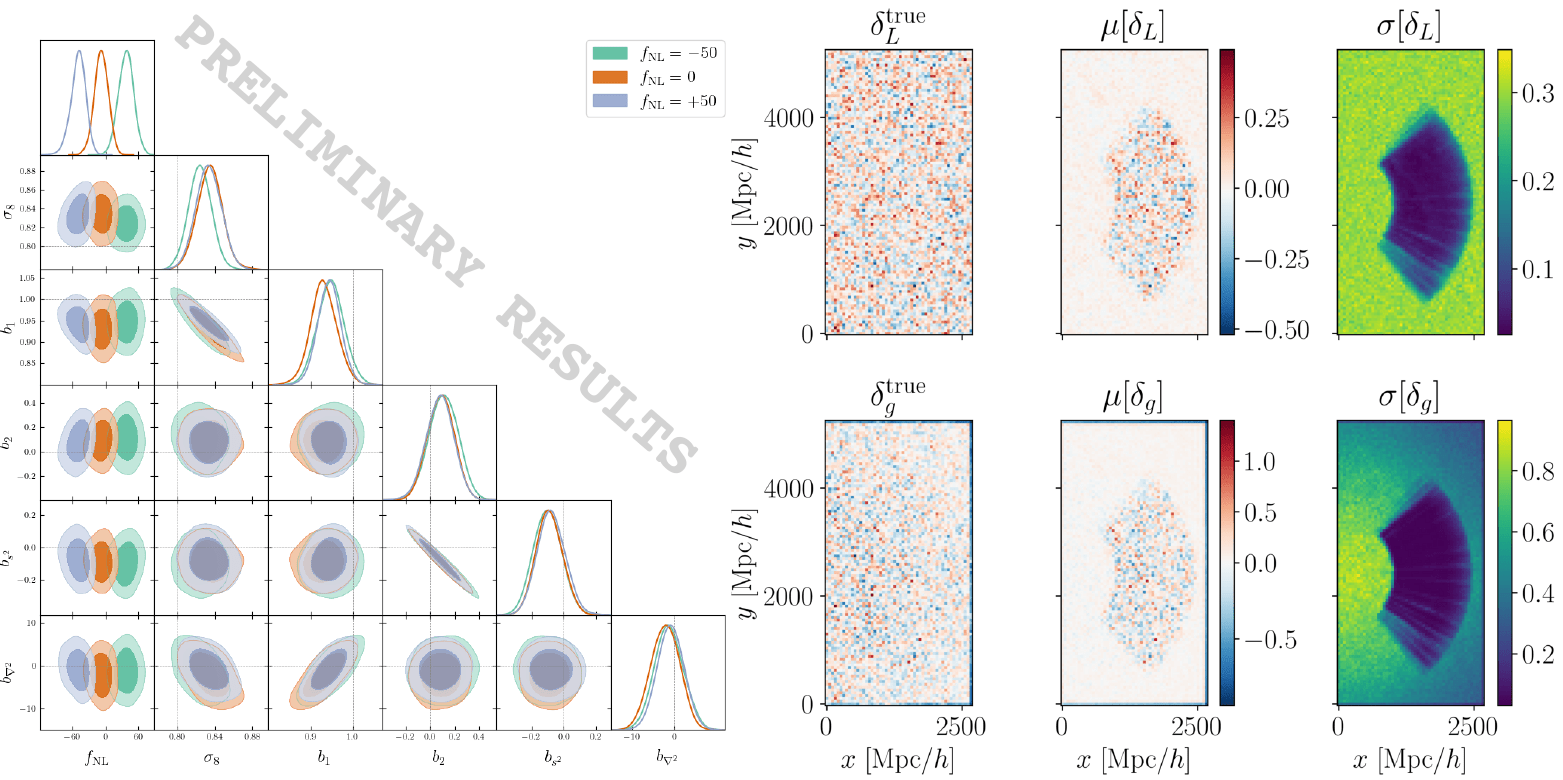
Field-level inference (PNG)
Goal: measure primordial non-Gaussianity with DESI data
Survey selection function
specify the survey selection function \(\bar{n}\) \(\Rightarrow\) account for systematic effects due to photometry/spectroscopy
Expected density without clustering = angular & radial footprint
Survey selection function \(\bar{n}\)
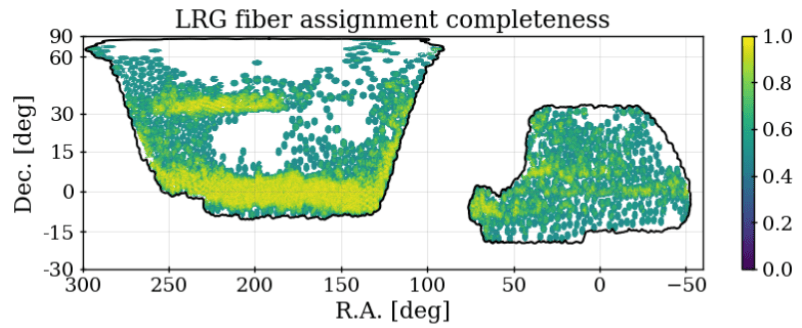
survey selection function \(\bar{n}\)
Taken from DESI Collaboration et al. 2024