The History of Information Graphics
Lesson 2
- key concepts
- information graphics and image theory
- historiography
Why we visualize information?
- Exploration/Representation
analysis, finding, seeing, understanding
- Explanation/Argumentation
highlight, enlight, demonstration, proof
W
- Data visualization is a visual rhetoric form which uses mostly abstract visual signs for highlight, demonstration, enhance, convince or debunk.
- polysemic vs. monosemic
Not how to see, but how to read the meaning of the visual signs - semiology/diagrammatology
Visual signs
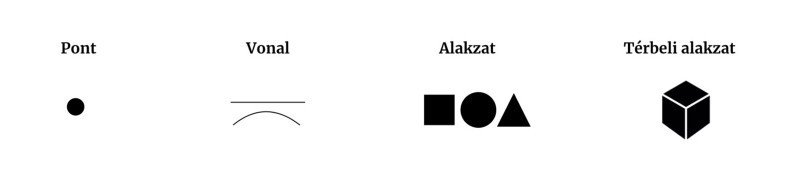
point line shape form
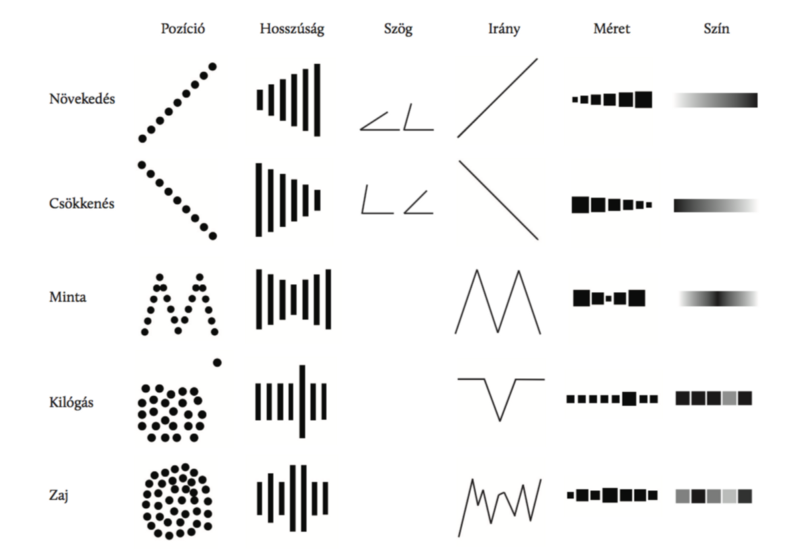
Attributes
position length direction angle

shape size colour shade
Reading
Position Length Angle Direction Size Colour
Growth
Decreasement
Pattern
Outlie
Noize
Meaning
- title
- legend
- annotation
- axis
- source
- explanation
Process
Sign
Attributes
Meaning
Representative
Narrative
Argumentation
Style
Semiotics
Diagrammatology
In the family of images
?
In the family of images
- art history
Gombrich, Elkins (epistemic image)
- visual cultural studies
Mitchell, Boehm (pictorial turn, iconic turn)
- Bildwissenschaft
Bredekamp (technical image)
In the family of images
diagrams (schematic image)
plans
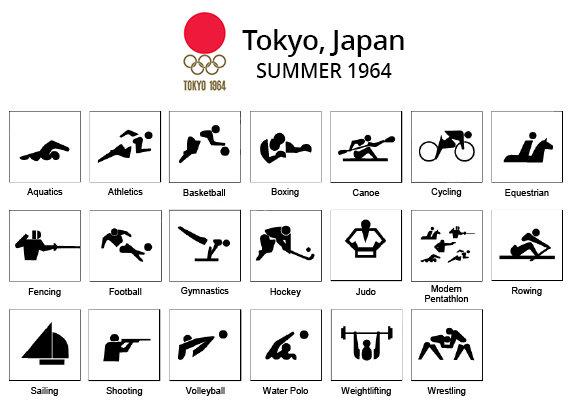
pictograms
genealogies
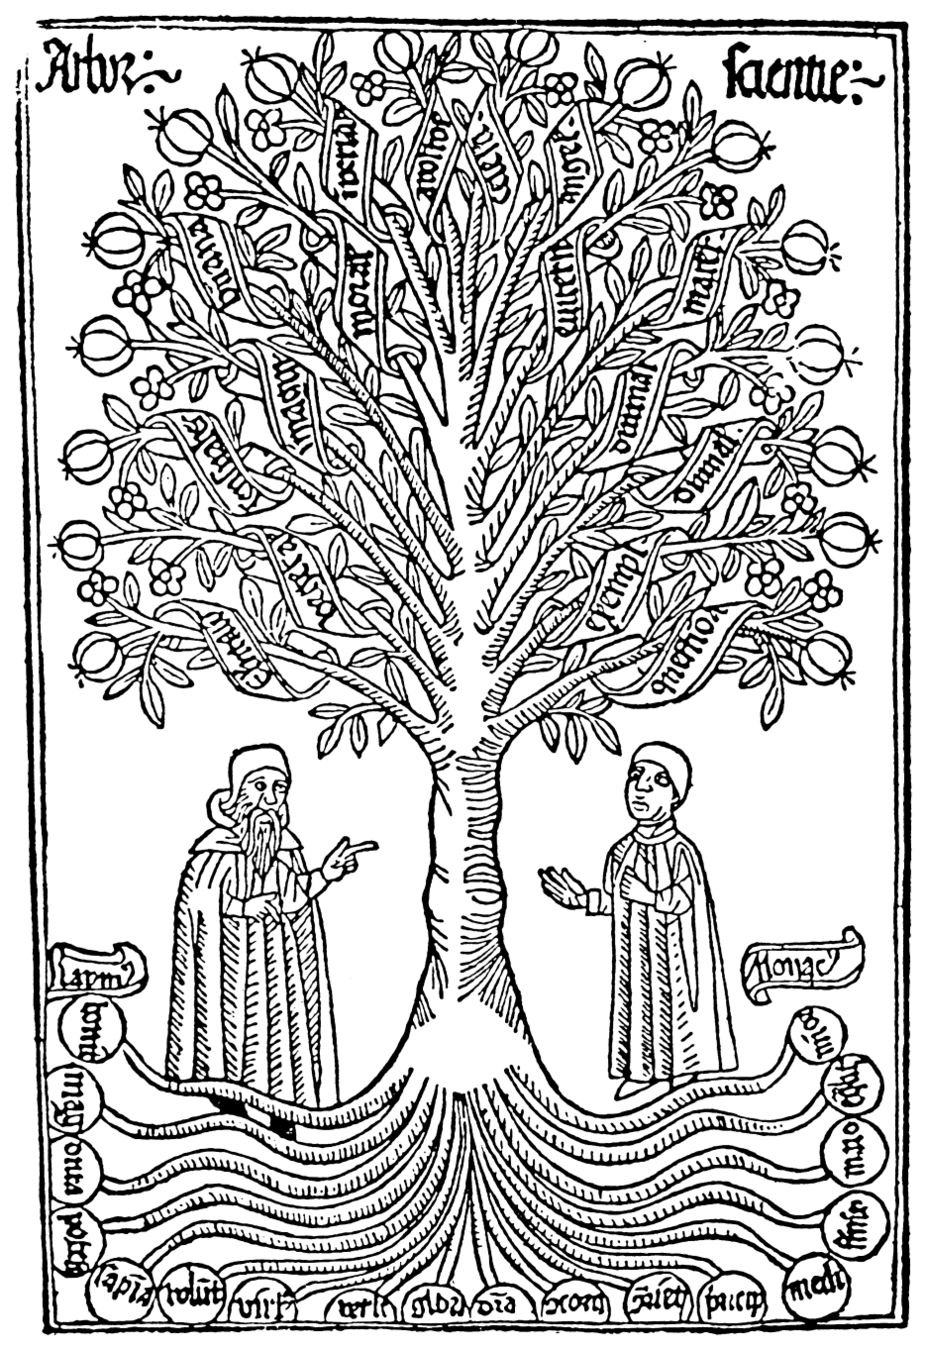
knowledge trees
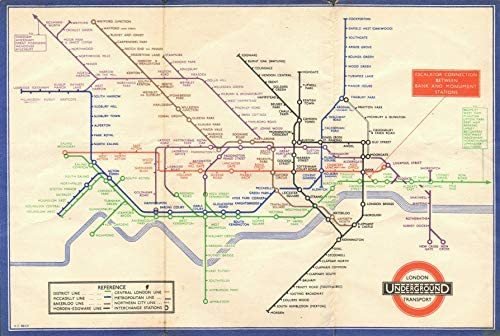
maps
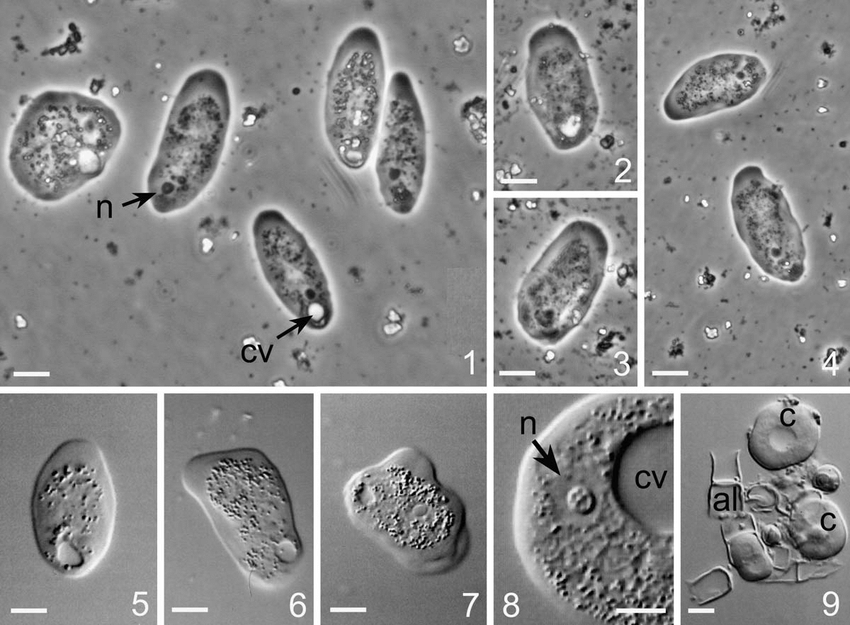
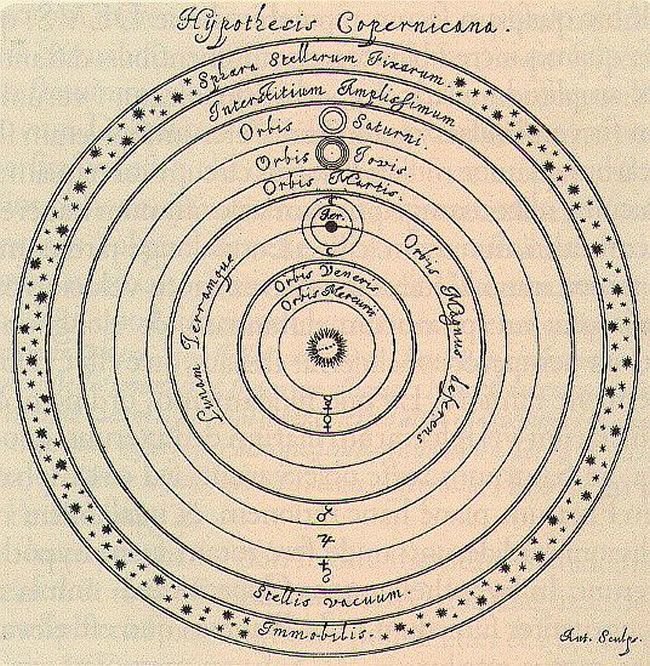
scientific images (microscope)
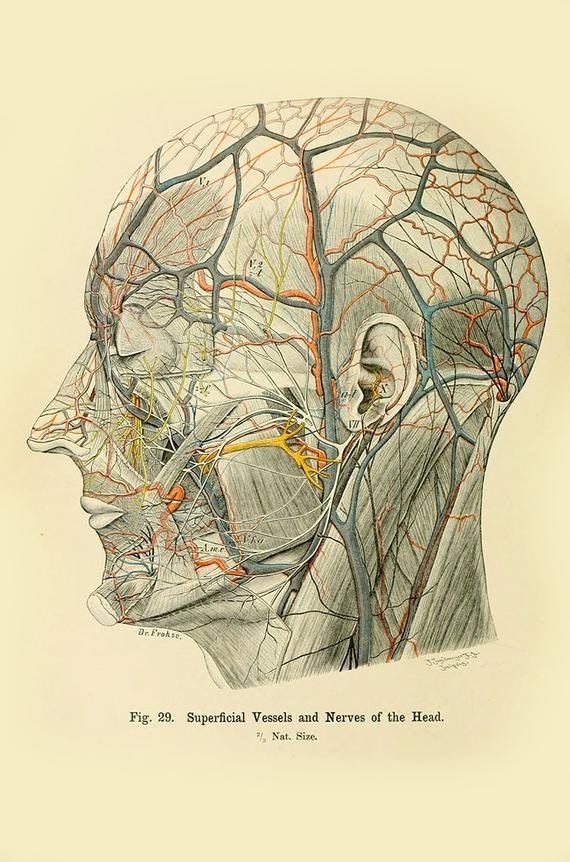
scientific illustrations (anatomical drawings)
?DATA VISUALIZATION?
Method
Brinton, engineer, 1919
Tukey, mathematician, 1970
Tufte, statistician, 1980
Cleveland, statistician, 1982
Few, statistician, 2004
Wainer, statistician, 2004, 2012
Yau, designer, 2011, 2013
Cairo, designer, 2012, 2016, 2018
Camoes, statistician, 2017
Knaflic, data scientist, 2015
Kirk, designer, 2016
Andrews, designer, 2019
History
Funkhauser, statistician, 1937
Friendly, statistician, 2000, 2002, 2020
Spence és Wainer, statisticians, 2005
Grafton és Rosenberg, historians, 2012
Rendgen, historian, 2018, 2019
Battle-Baptiste és Rusert, anthropoligists, 2018
Berkowitz, historian, 2018
Cairo, designer, 2018
Dick, information historian, 2020
History of ideas
Bender és Marrinan, historians, 2010
Lima, designer, 2012, 2013, 2017
Drucker, information theorist, 2014
Semiotics
Bertin, cartographer, 1967
Image theory
Elkins, art historian, 2001
Schmidt-Burkhardt, art historian, 2012
Bredekamp - technical image, 2015
Kemp
Gombrich
Cary
Perception
Ware, engineer, 1999
Kennedy és Hill, sociologist and data scientist, 2017
Murray Dick's classification
Mathematical-Statistical School
Funkhouser
Friendly
Methodological, graphical innovations
Heroes, firsts, innovators and villains
Focuses on the legendary
Does not take into account the mass production, the sociological and the cultural effect
Murray Dick's classification
Neurological-Psychological School
Wainer
History of seeing, values in mass production, popular infographics
Murray Dick's classification
Cultural history
Lima, Rendgen, Rosenberg and Grafton, Berkowitz, Cairo
Information graphics as cultural phenomenon
Interdisciplinary approach
Murray Dick's classification
Functionalist-Idealist discourse
Bertin, Tukey, Tufte
method and form
simplicity, abstraction
Murray Dick's classification
Pragmatist-realist discourse
Holmes, Cairo
communicative technology
Murray Dick's classification
Didactic-Persuasive discourse
Neuraths
language, propaganda, ideological
Murray Dick's classification
Expressionist-Aesthetic discourse
McCandless
art, play, fun, self-exrpession, joy, experiment
General classical history
Funkhouser, Friendly, Rendgen, Rosenberg and Grafton, Bender and Marrinan
linear storytelling
history of what the West knows
heroes, innovators, firsts, importants, gems, "golden ages", "dark ages"
History of shapes and forms
Lima - trees, circles, networks, hierarchies
linear storytelling
heroes, innovators, firsts, importants, "golden ages", "dark ages"
Monographs
Rendgen, Berkowitz, Wainer and Spence, Baptiste and Rusert
Focus on the heroes - Playfair, Minard, WEB Dubois, Humboldt, Neuraths
History of communication
Cairo, Dick
News communication, media, information technology
General critique
History of what the West knows about the West
'Art historians' disease'