
/anon

@staff
#help
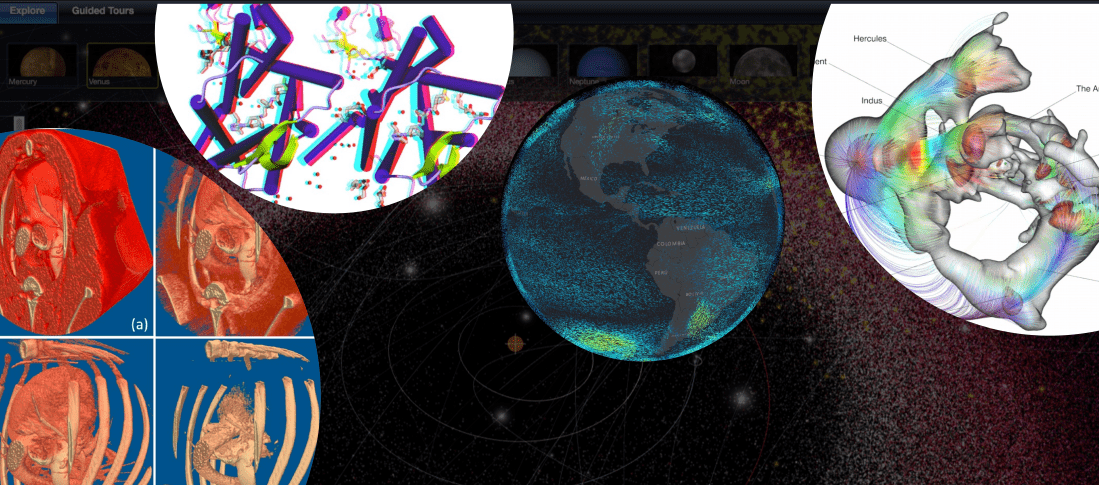
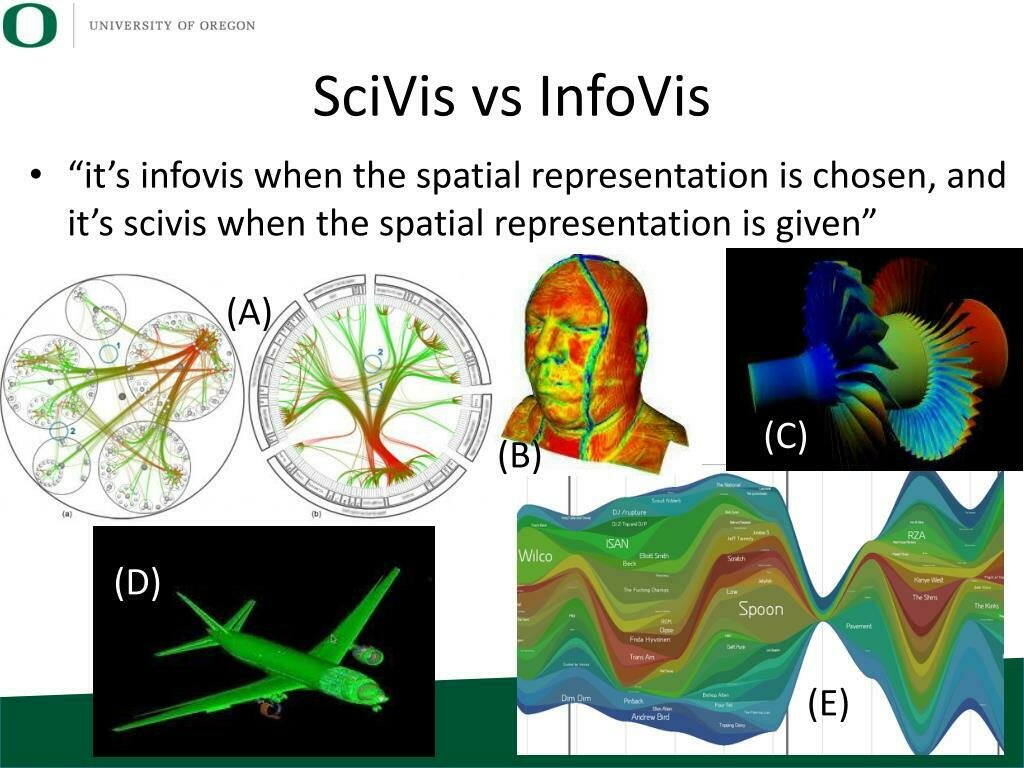
Scientific Visualization
Information Visualization
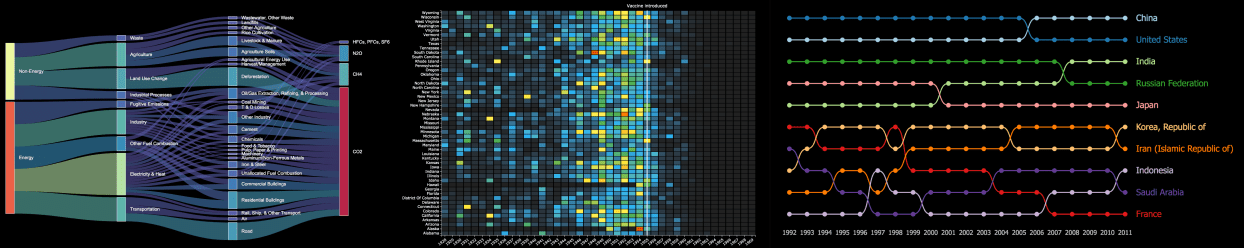
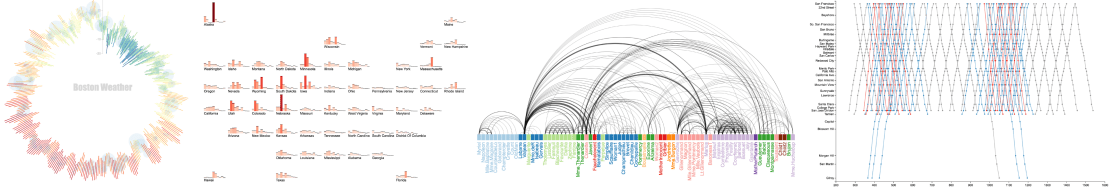
Data Visualization
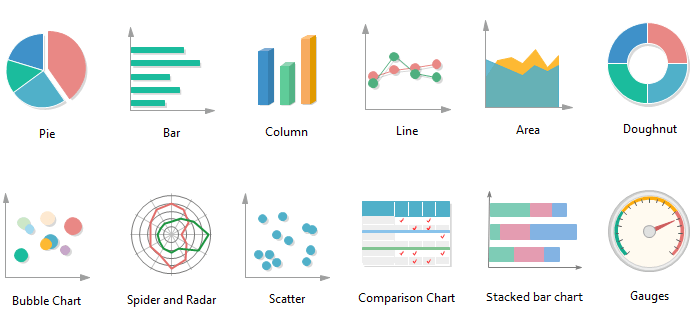
Charts
as building blocks
Homework

Which technologies are used by FT and BI?

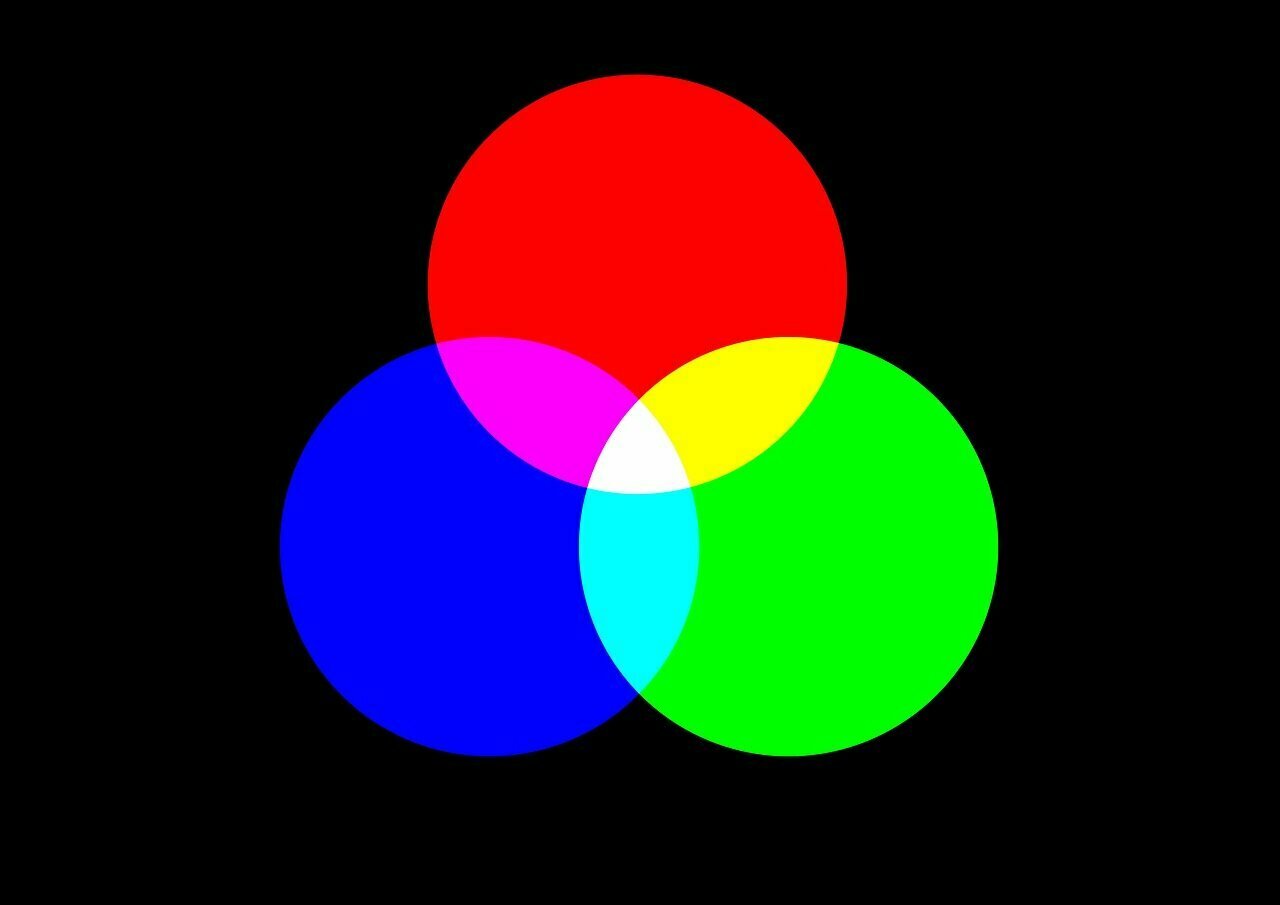
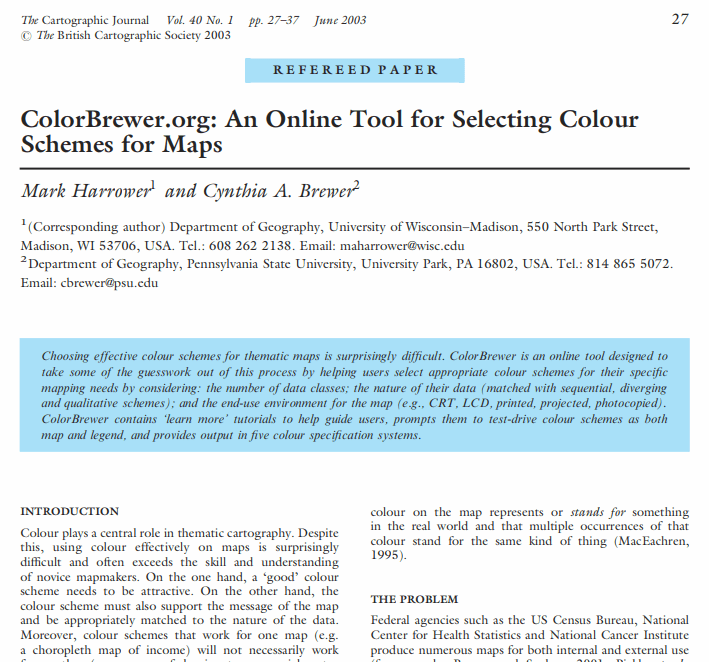
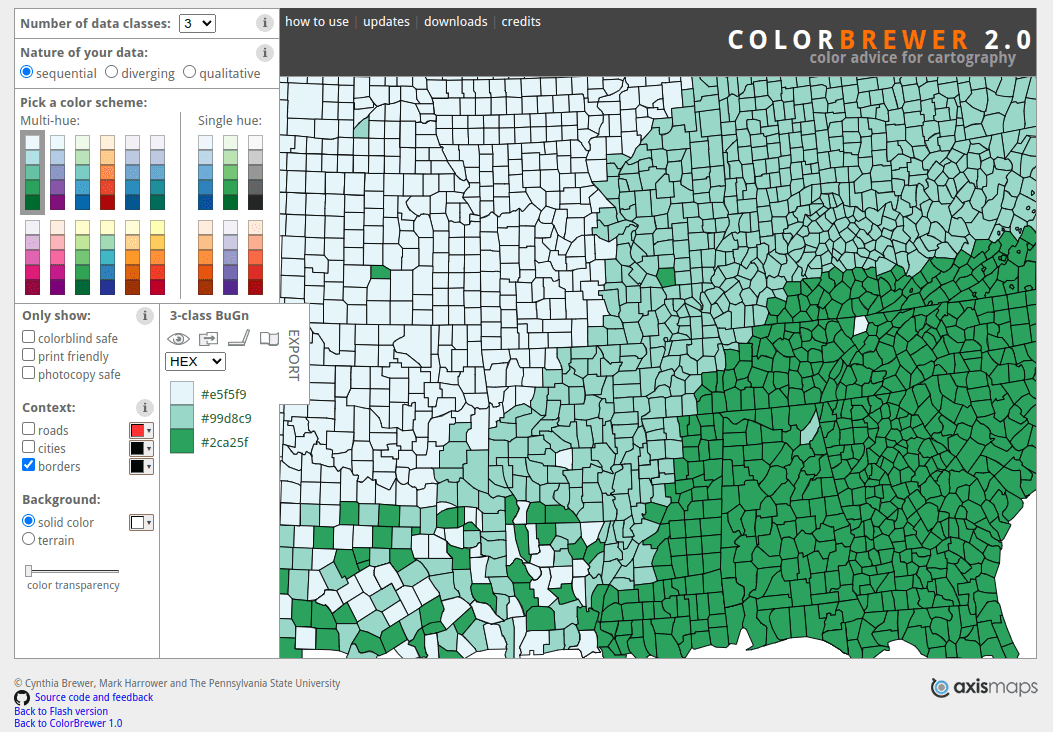
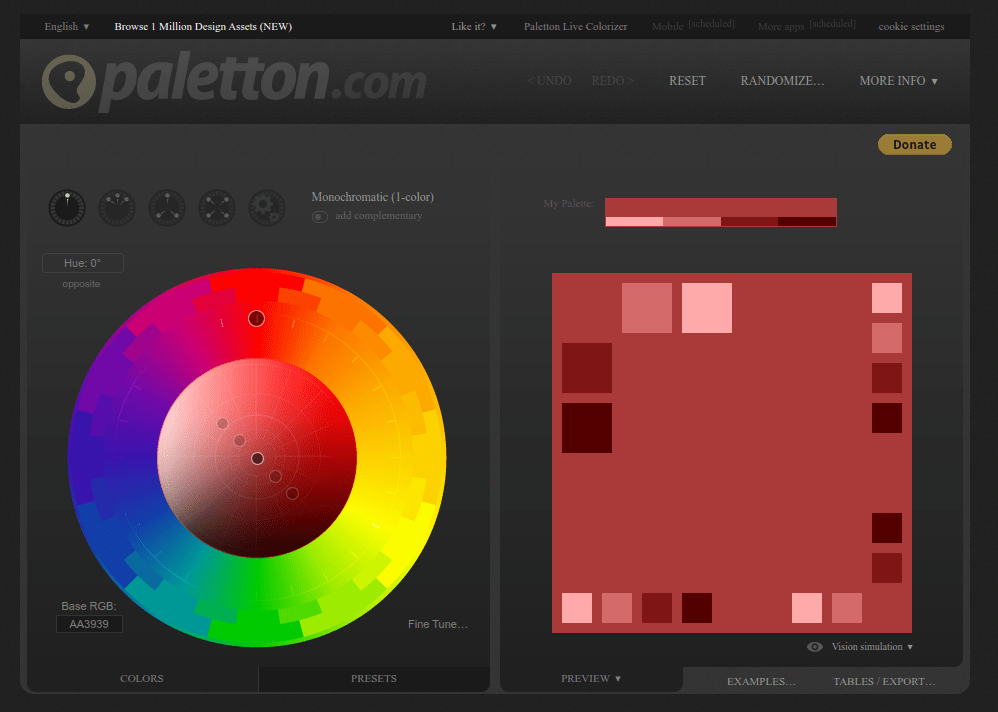
How to choose colors?
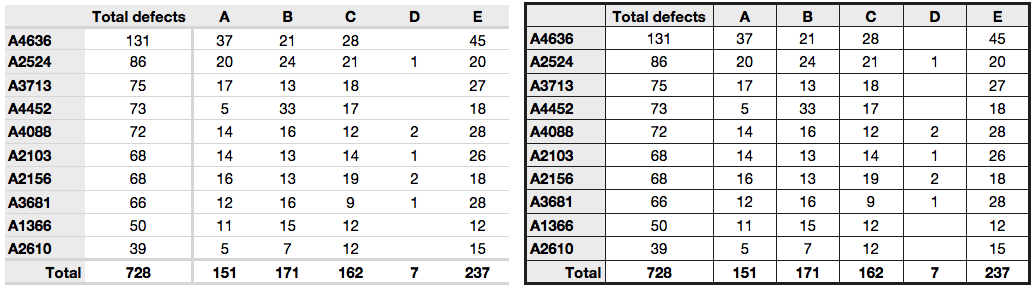
Tables are visualizations too!
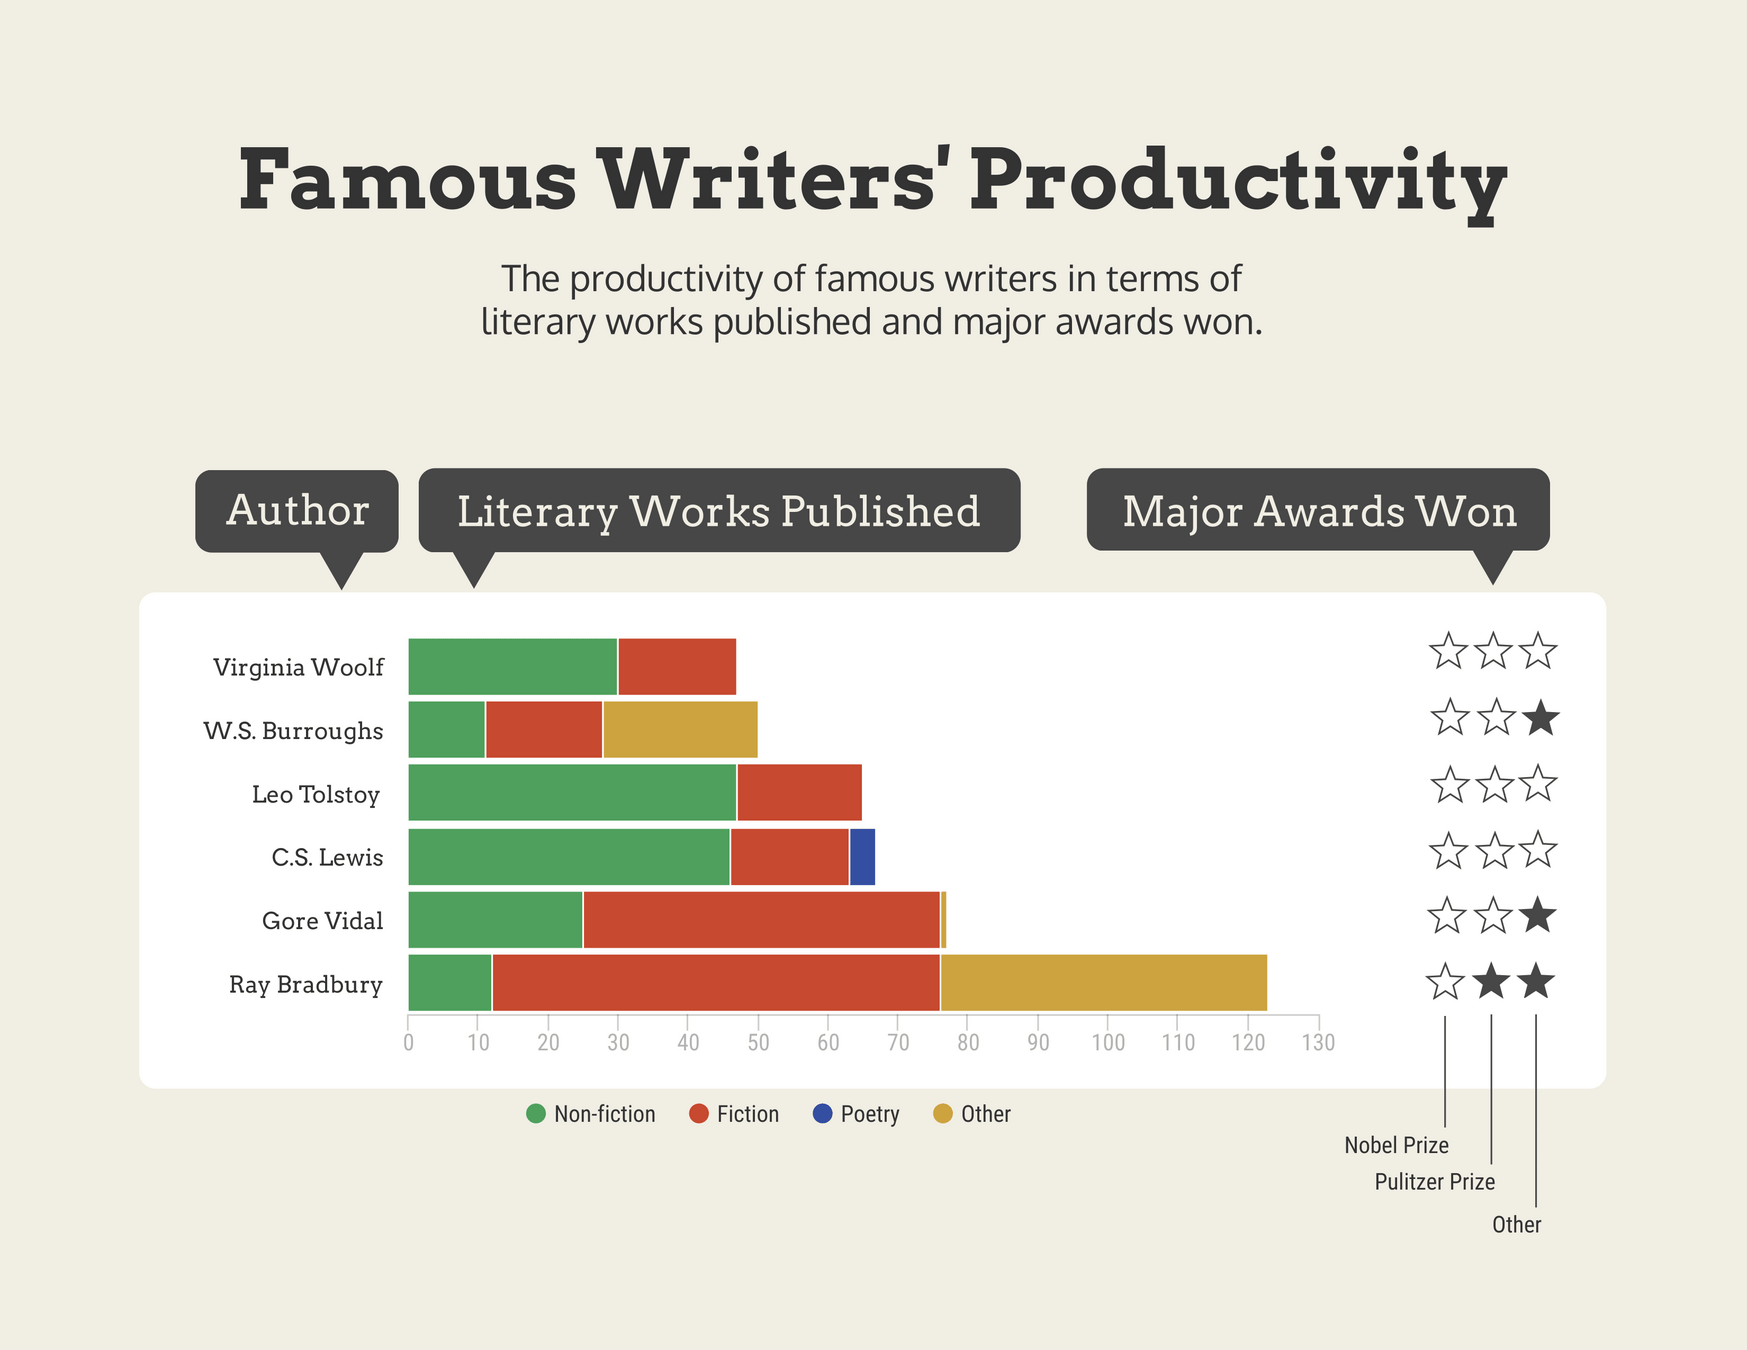
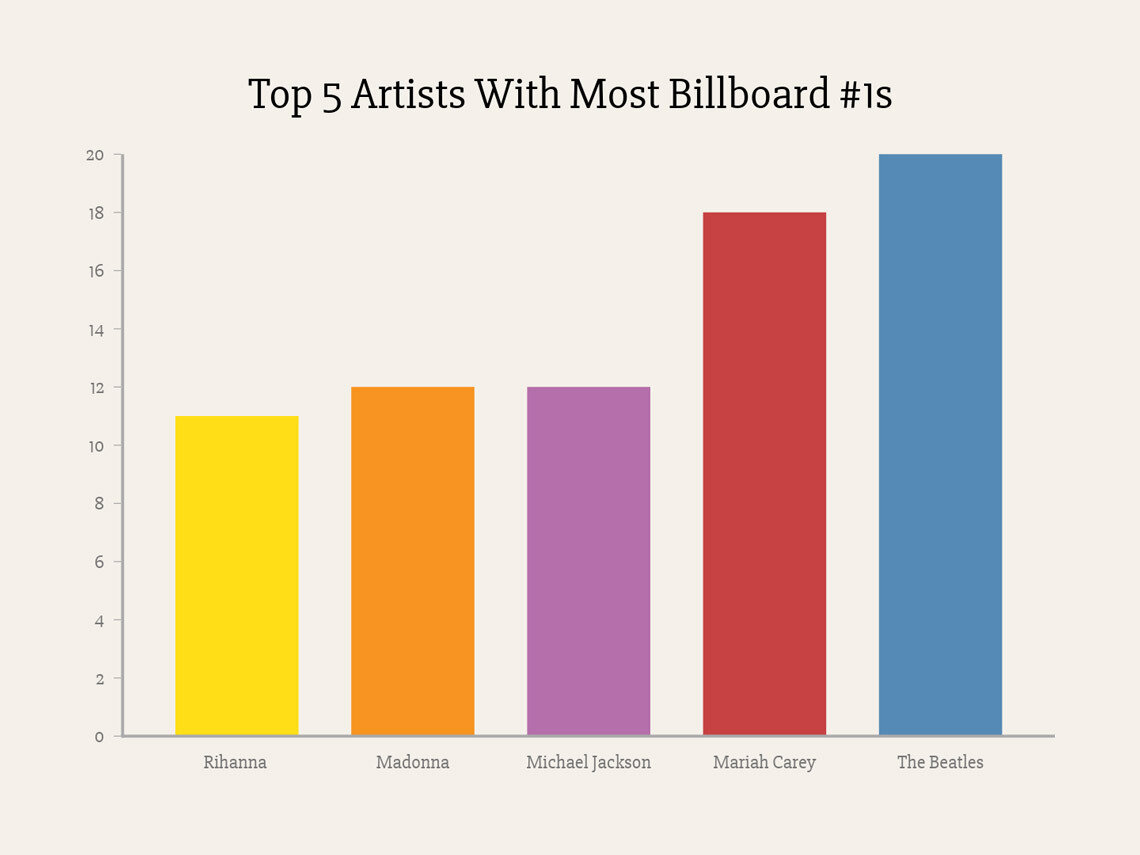
this is one is better
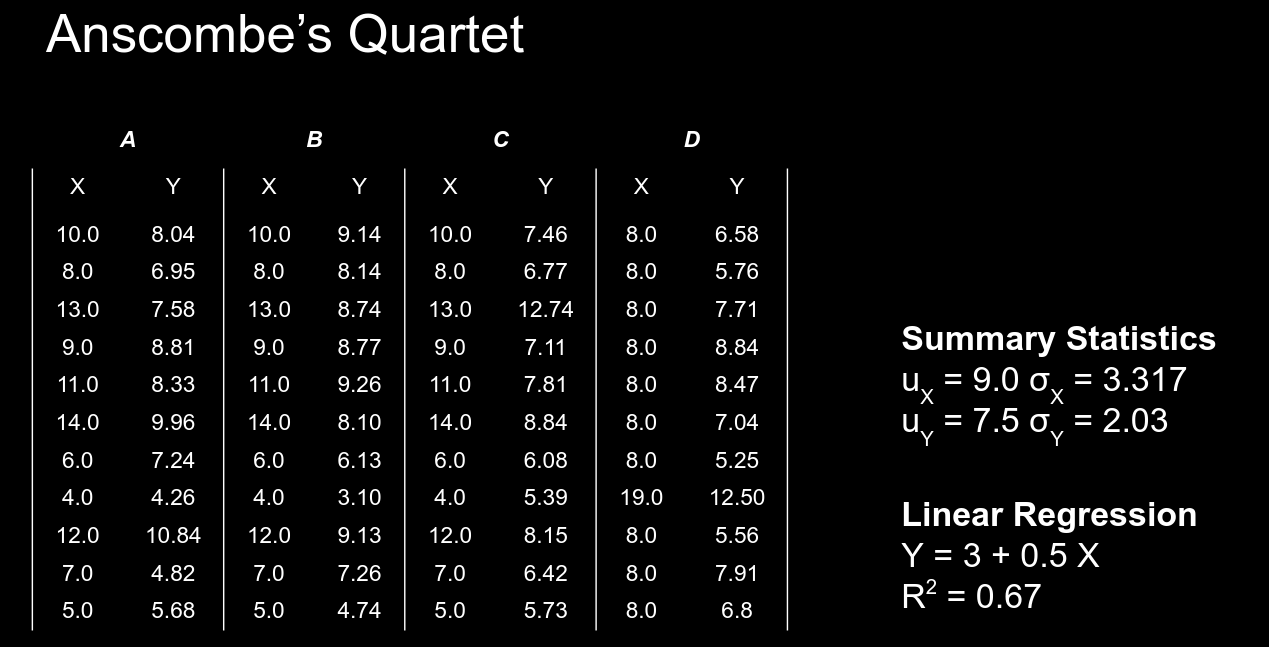
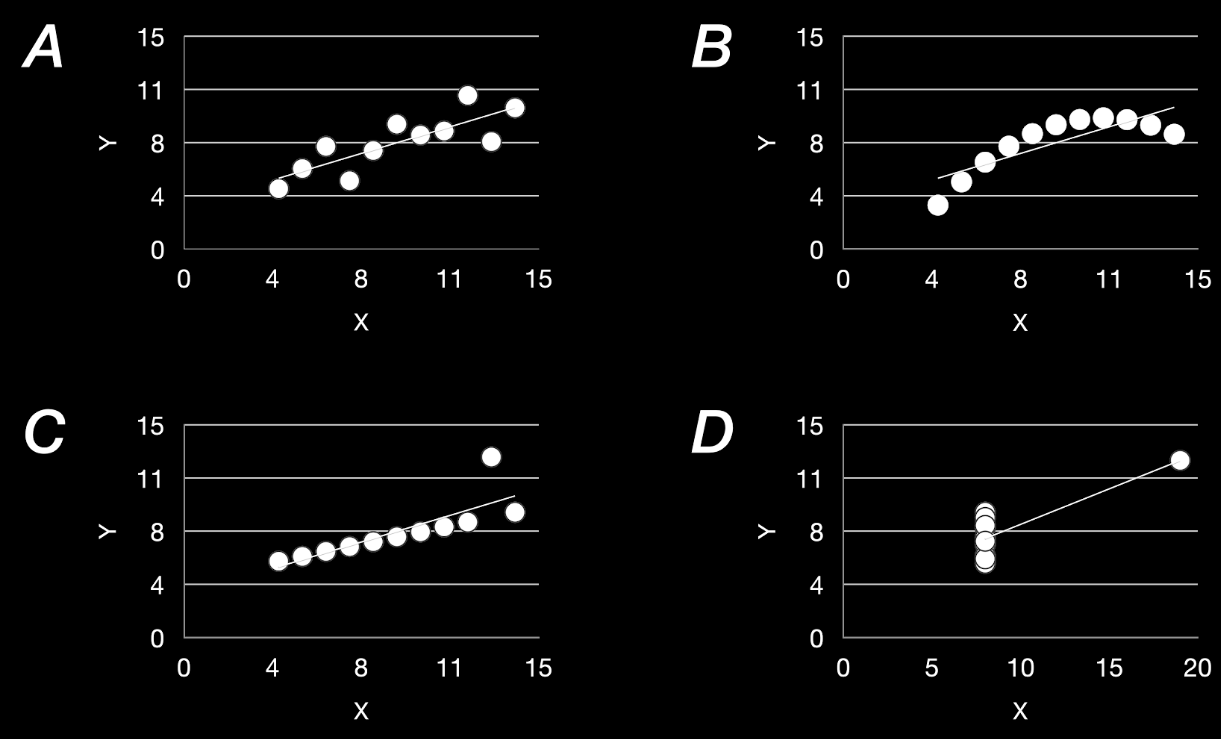

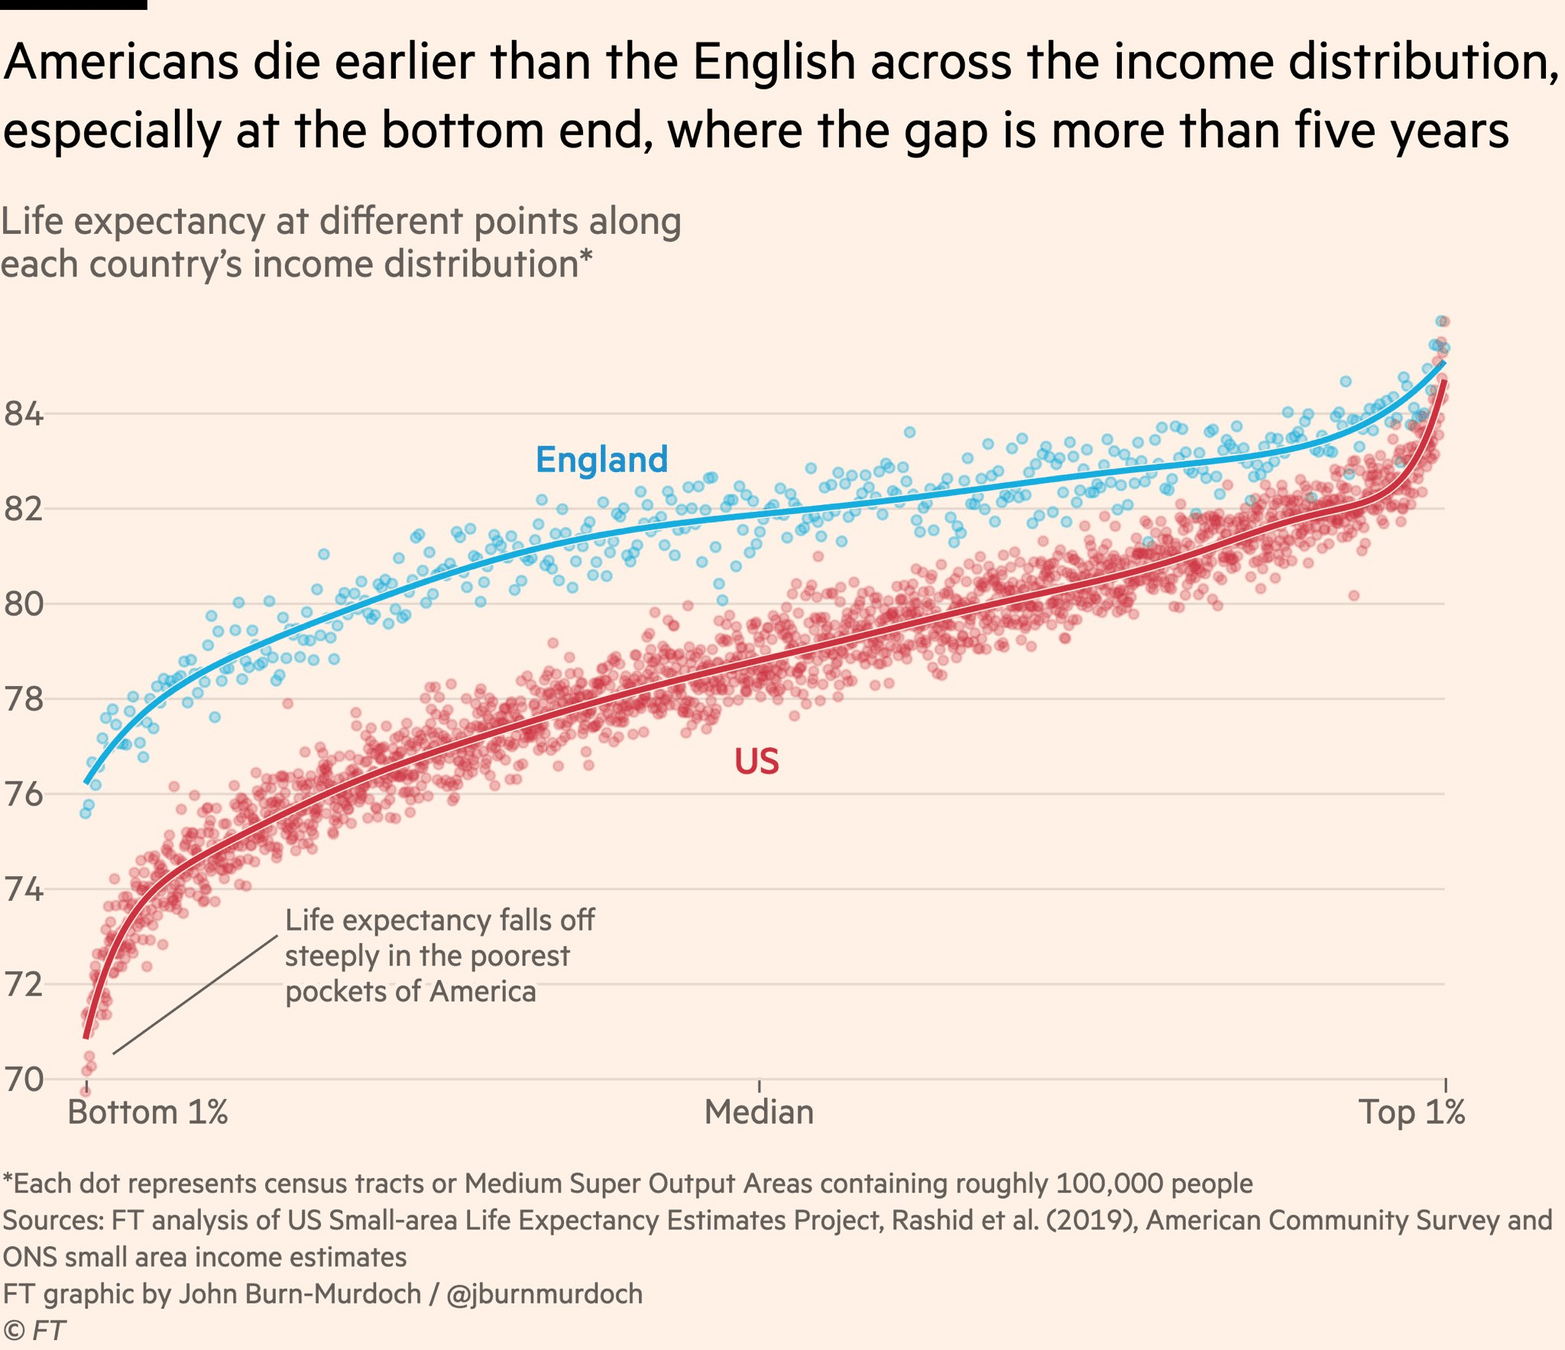
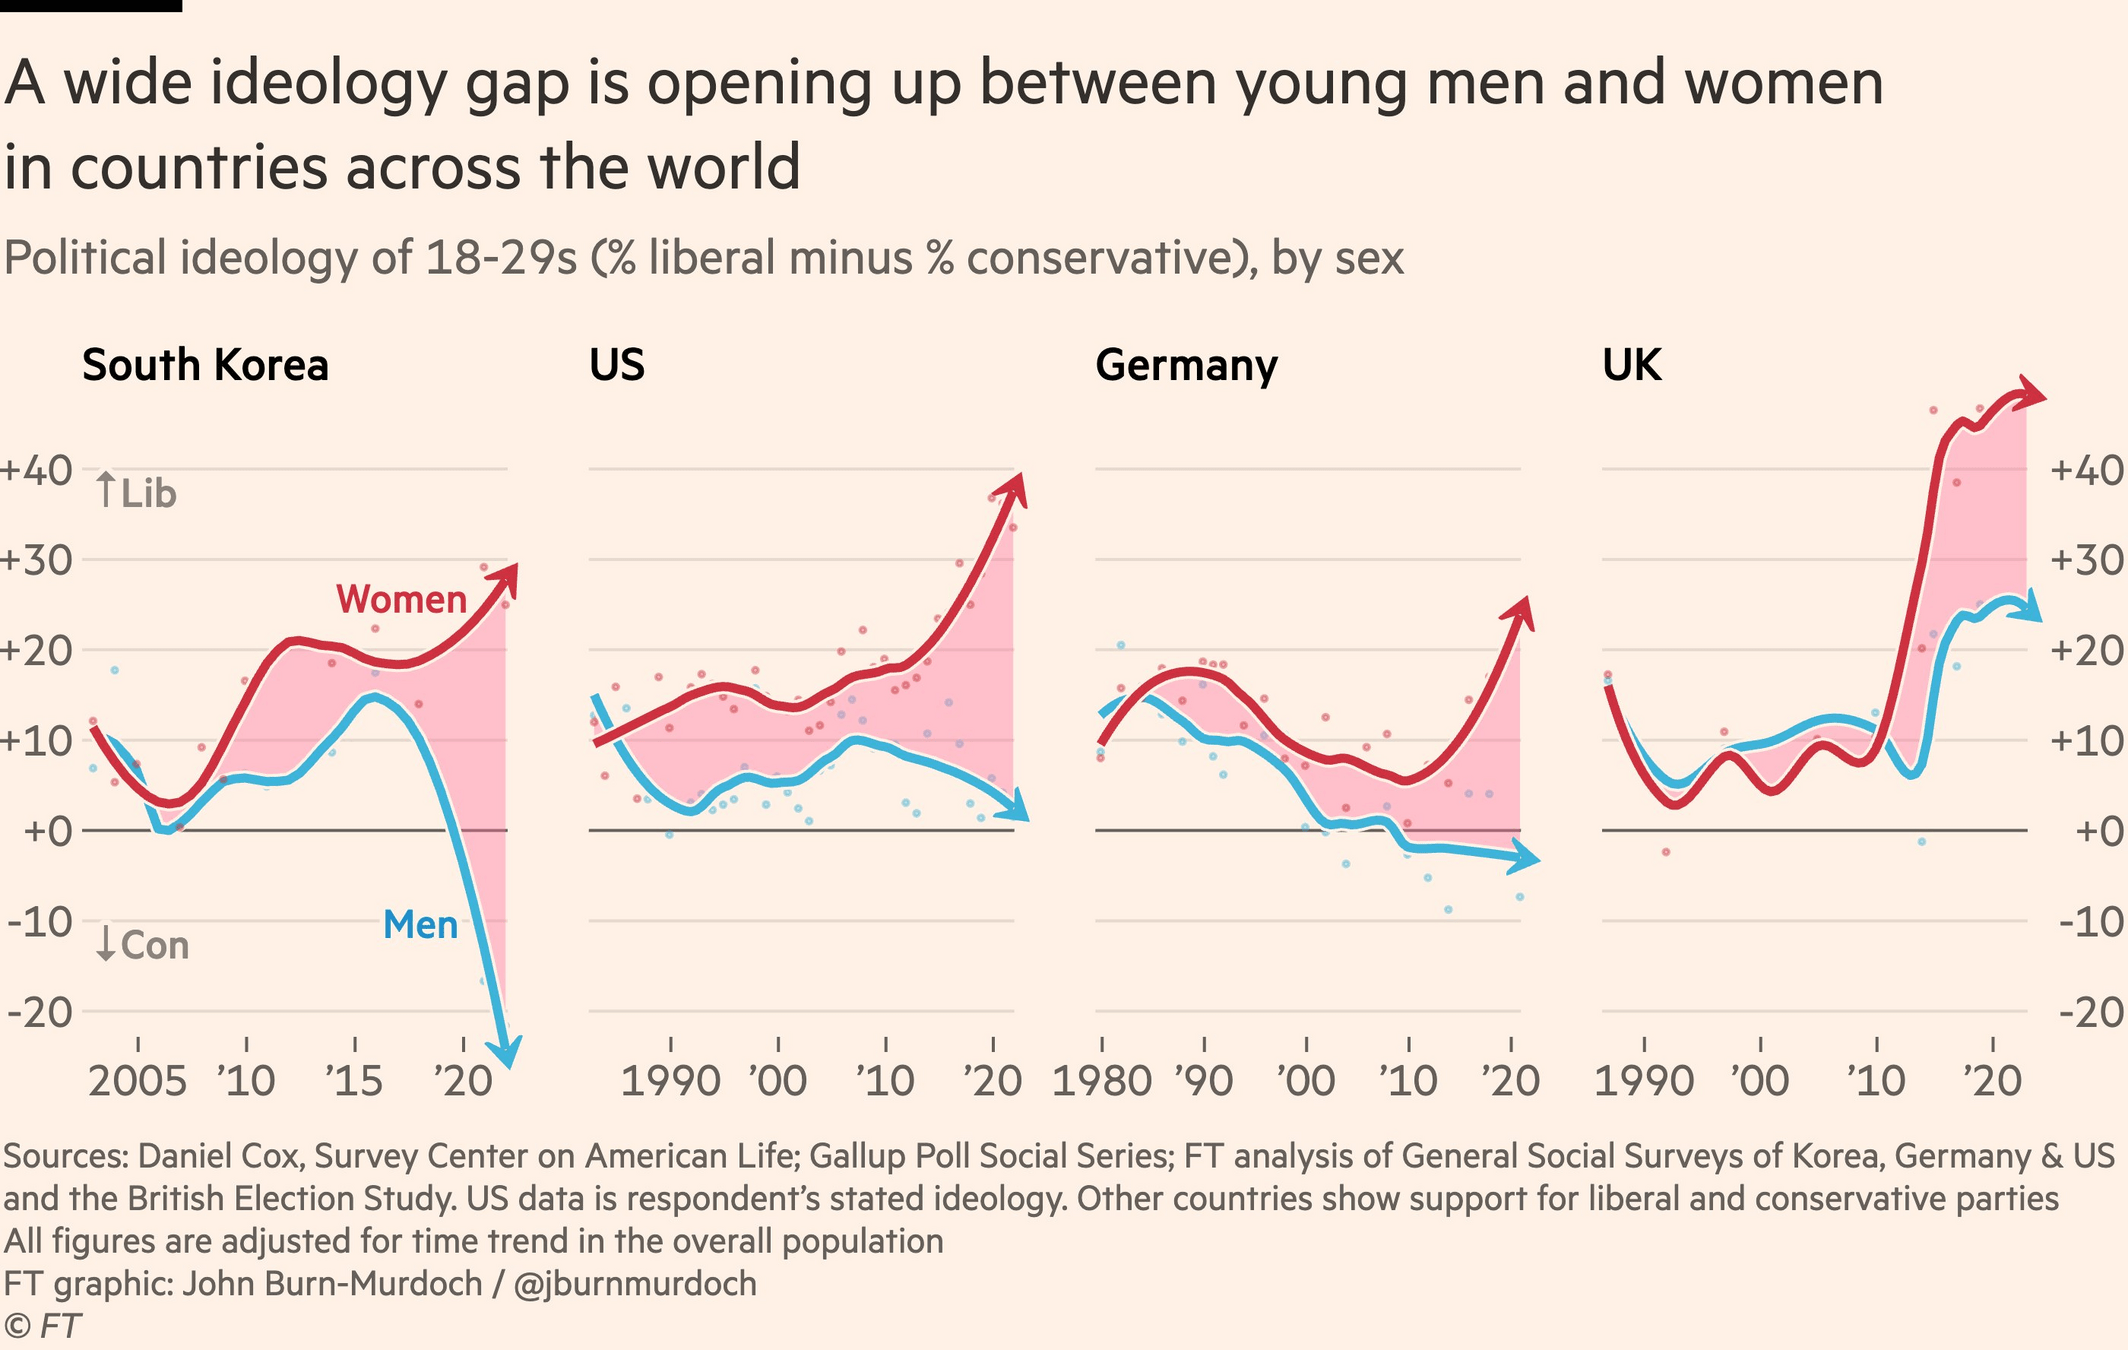
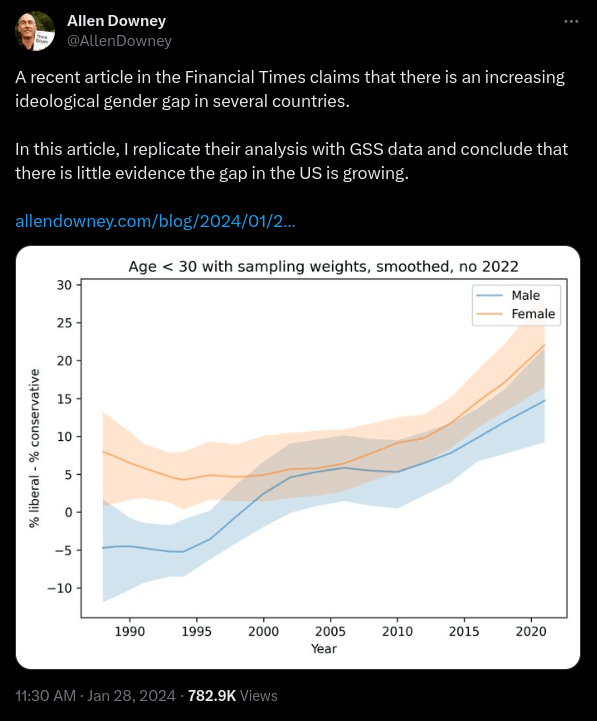
Visualizations should reduce the cognitive load when looking at data!


Visualizations show patterns in data!

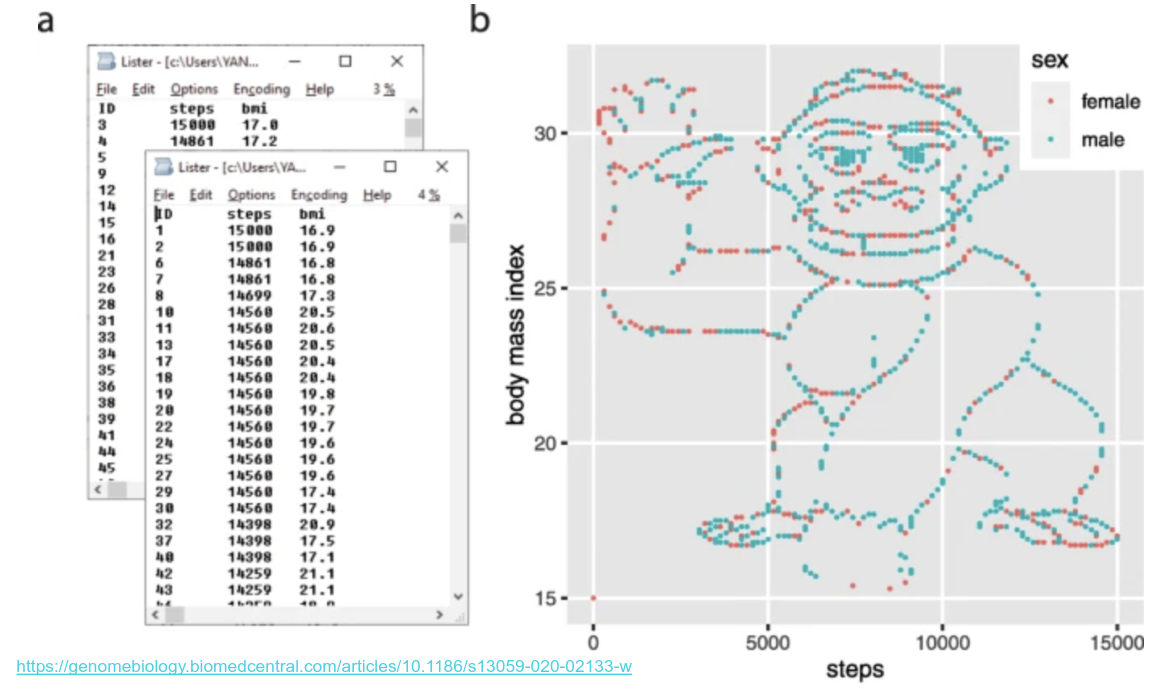
How would you plot this?
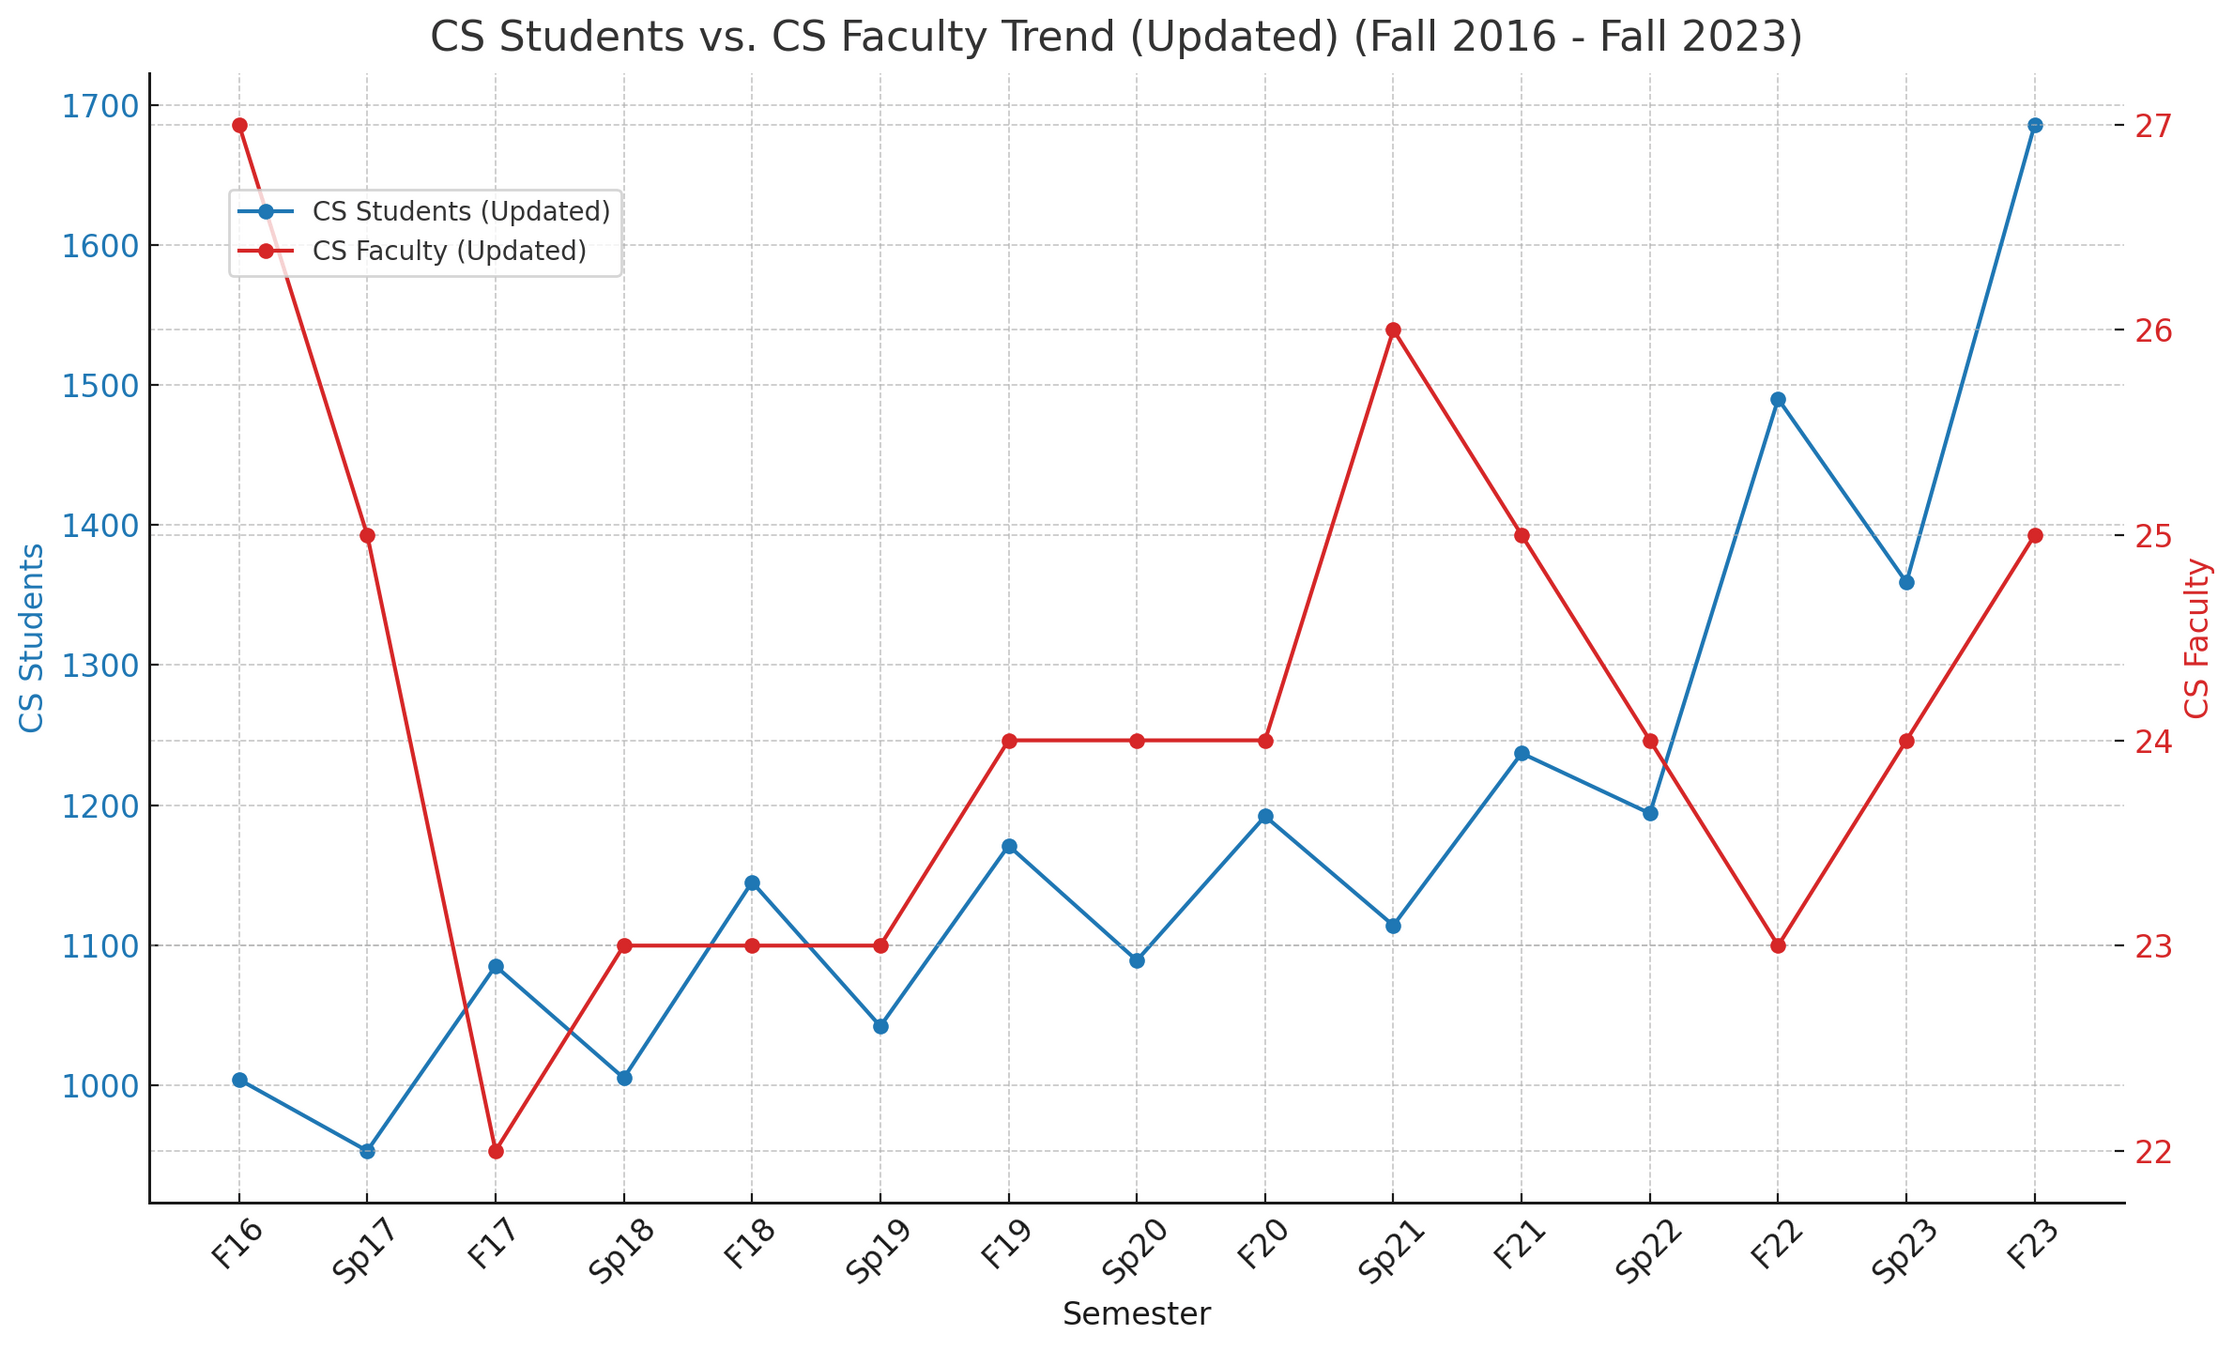

Dual-Axis Trend Chart
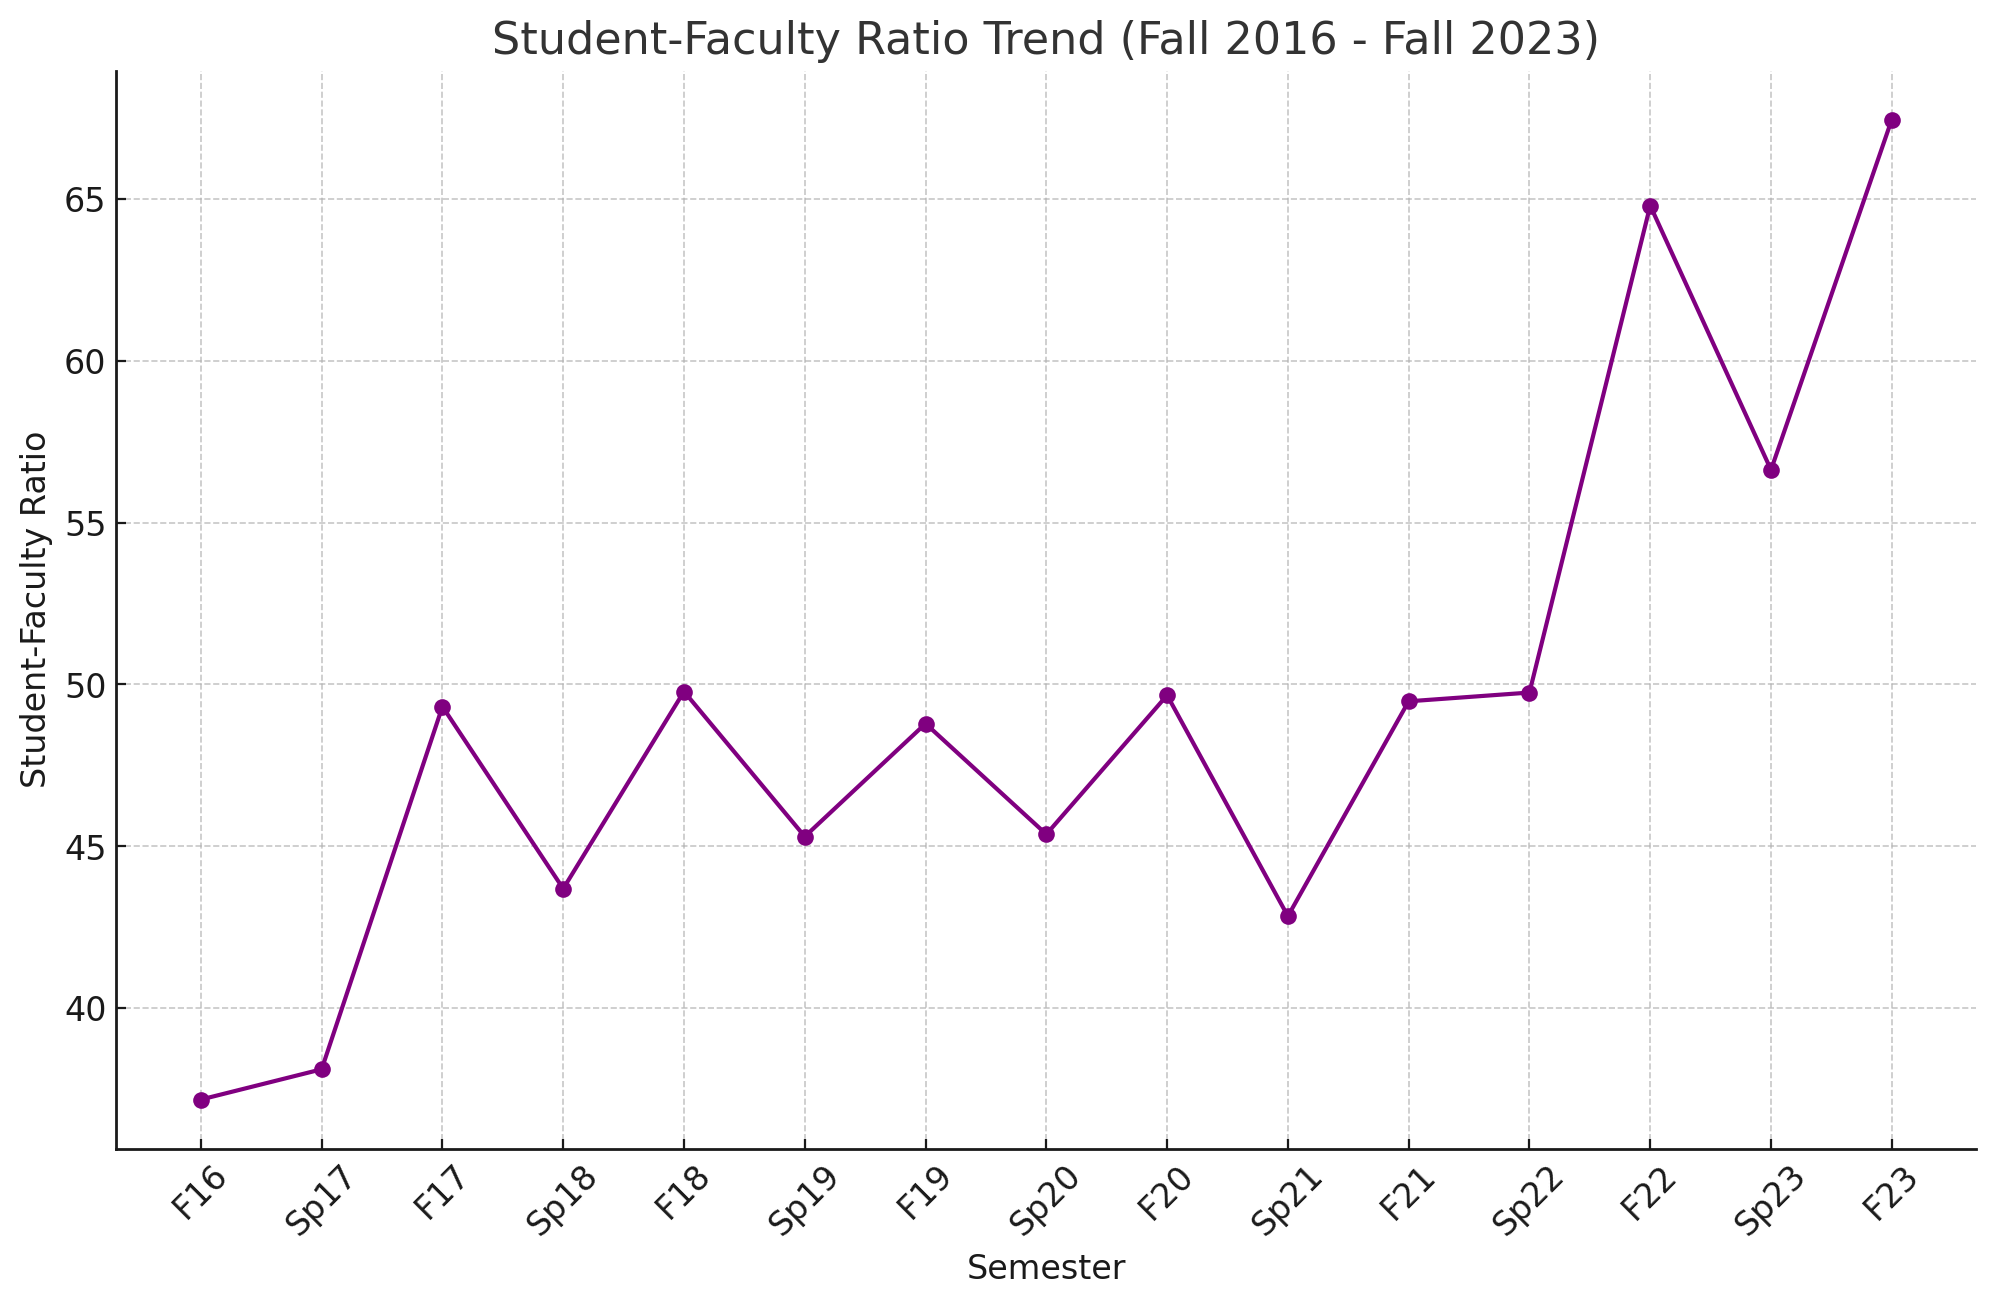

From Dual-Axis to Ratio Chart
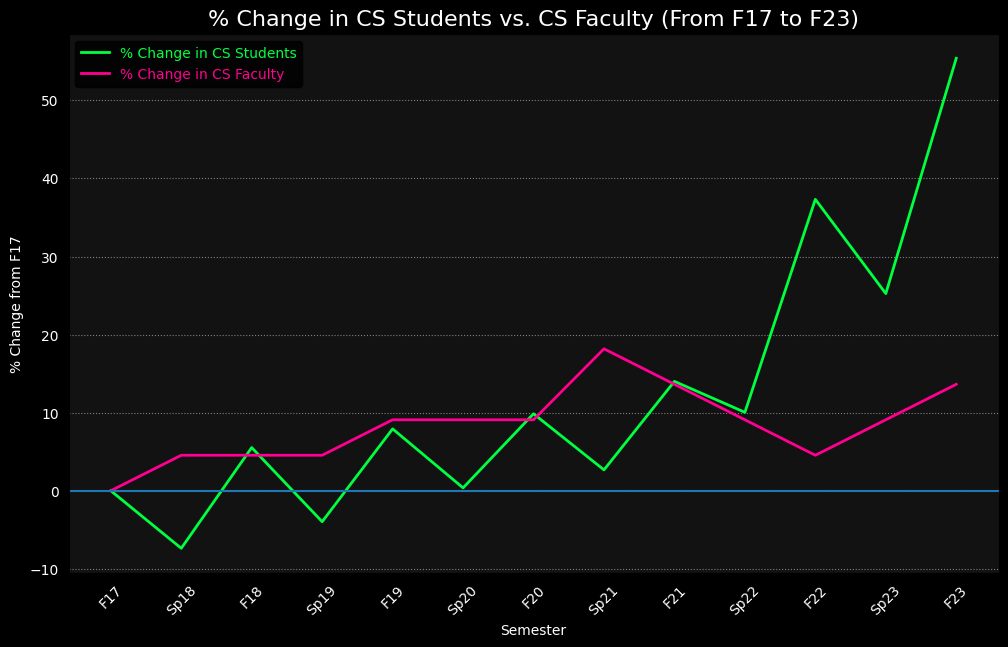


From Dual-Axis to Indexed Chart
Before
Before
Before
Before
After
BEFORE
BEFORE
AFTER

Is this the Tobin Bridge?

No! This is the Tobin Bridge!
Homework
Find fun facts about the Zakim bridge!