Performance Profiling Using Chrome Code Snippets
Dr. Gleb Bahmutov PhD
Kensho
- Personal site http://glebbahmutov.com/
- Blog http://glebbahmutov.com/blog/
- Twitter @bahmutov
Kensho app

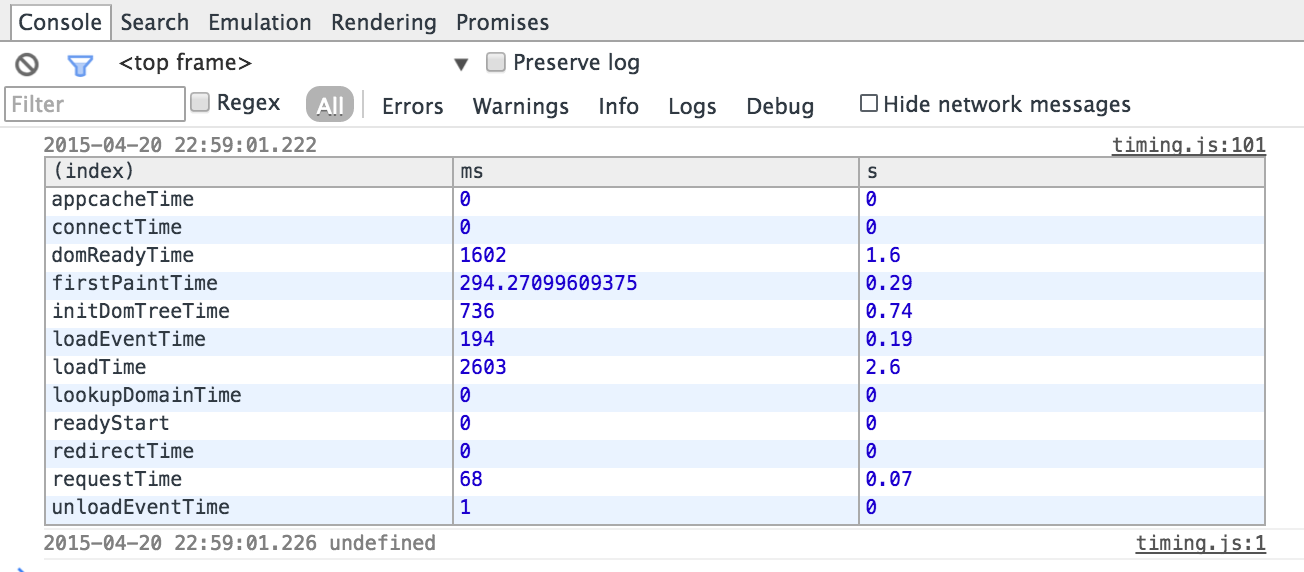
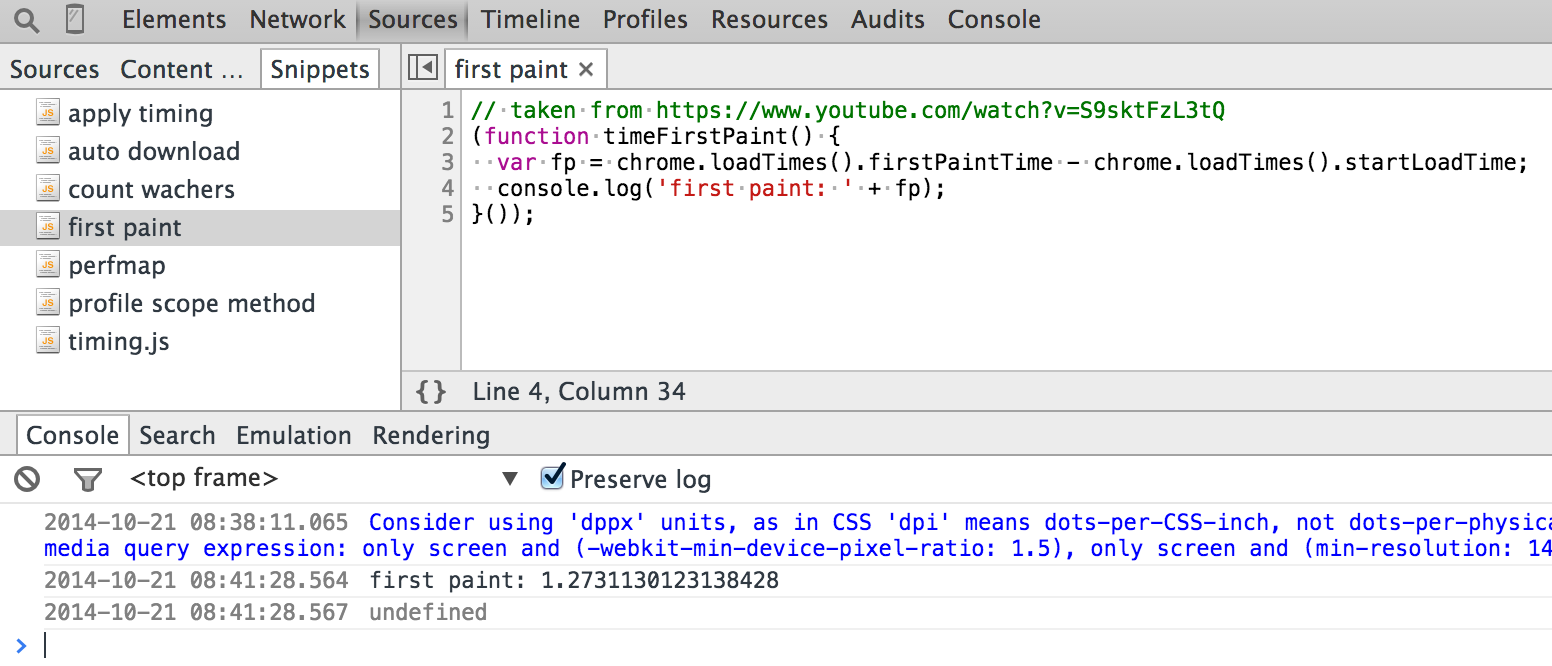
When does the page start painting?
(function timeFirstPaint() {
  var fp = chrome.loadTimes().firstPaintTime -
    chrome.loadTimes().startLoadTime;
  console.log('first paint: ' + fp);
}());
How long does the page load?
Code Snippets
find Expensive images

Include missing styles
<h1>
    <i class="fa fa-flag"></i> Include missing styles
    <i class="fa fa-heart"></i>
</h1>
(function addFontAwesomeCssLink() {
var ss = document.createElement('link');
ss.type = 'text/css';
ss.rel = 'stylesheet';
ss.href = '//maxcdn.bootstrapcdn.com/font-awesome/4.3.0/css/font-awesome.min.css';
document.getElementsByTagName("head")[0].appendChild(ss);
}());wrapping javascript
function add(a, b) {
  return a + b;
}
function doSomething() {
  console.log(add(2, 3));
}
doSomething();
// 5
wrapping javascript
function add(a, b) {
  return a + b;
}
function doSomething() {
  console.log(add(2, 3));
}
// replace add
var _add = add;
add = function () {
  console.log('adding', arguments);
  return _add.apply(null, arguments);
}
doSomething();
// adding { '0': 2, '1': 3 }
// 5
wrapping javascript
function add(a, b) {
  return a + b;
}
function doSomething(add) {
  console.log(add(2, 3));
}
setTimeout(doSomething.bind(null, add), 1000);
// replace add
var _add = add;
add = function () {
  console.log('adding', arguments);
  return _add.apply(null, arguments);
}
doSomething();
// 5
Prefer wrapping methods
function add(a, b) {
  return a + b;
}
var calc = {
  add: add
};

function doSomething(calc) {
  console.log(calc.add(2, 3));
}
setTimeout(doSomething.bind(null, calc), 1000);

var _add = calc.add;
calc.add = function () {
  console.log('adding', arguments);
  return _add.apply(calc, arguments);
}
// adding { '0': 2, '1': 3 }
// 5
Works in Angular
var selector = 'load';
var methodName = 'load';
var el = angular.element(document.getElementById(selector));
var scope = el.scope() || el.isolateScope();
var fn = scope[methodName];
var $timeout = el.injector().get('$timeout');
var $q = el.injector().get('$q');
scope[methodName] = function () {
console.profile(name);
console.time(name);
// method can return a value or a promise
var returned = fn();
$q.when(returned).finally(function finishedMethod() {
console.timeStamp('finished', methodName);
$timeout(function afterDOMUpdate() {
console.timeStamp('dom updated after', methodName);
console.timeEnd(name);
console.profileEnd();
scope[methodName] = fn;
}, 0);
});
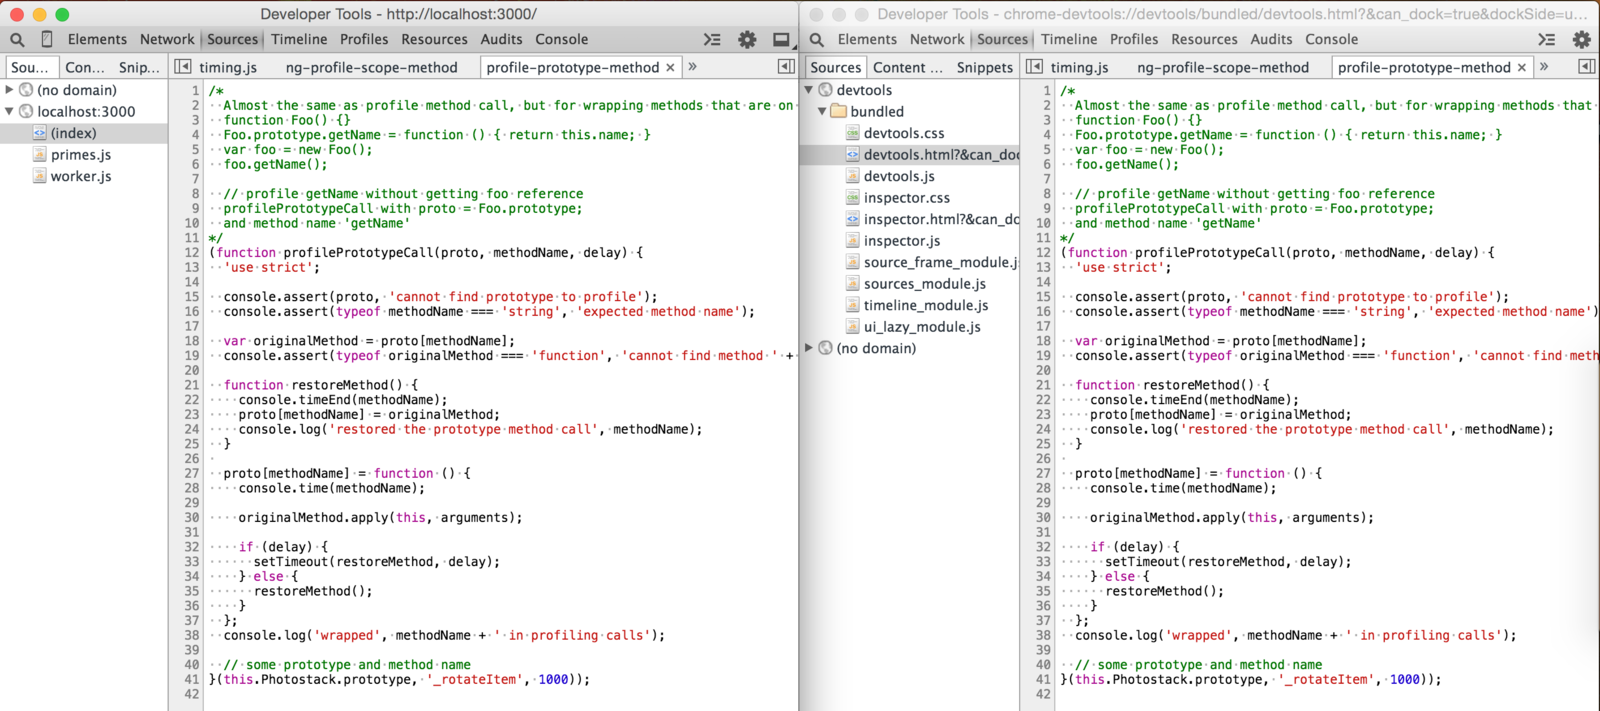
};Works with prototypes
// tough cases like jQuery plugins
new Photostack(document.getElementById('photostack-3');
function profile(proto, methodName) {
var originalMethod = proto[methodName];
function restoreMethod() {
console.timeEnd(methodName);
proto[methodName] = originalMethod;
}
proto[methodName] = function () {
console.time(methodName);
originalMethod.apply(this, arguments);
restoreMethod();
};
}
// where we want to profile Photostack.prototype._rotate
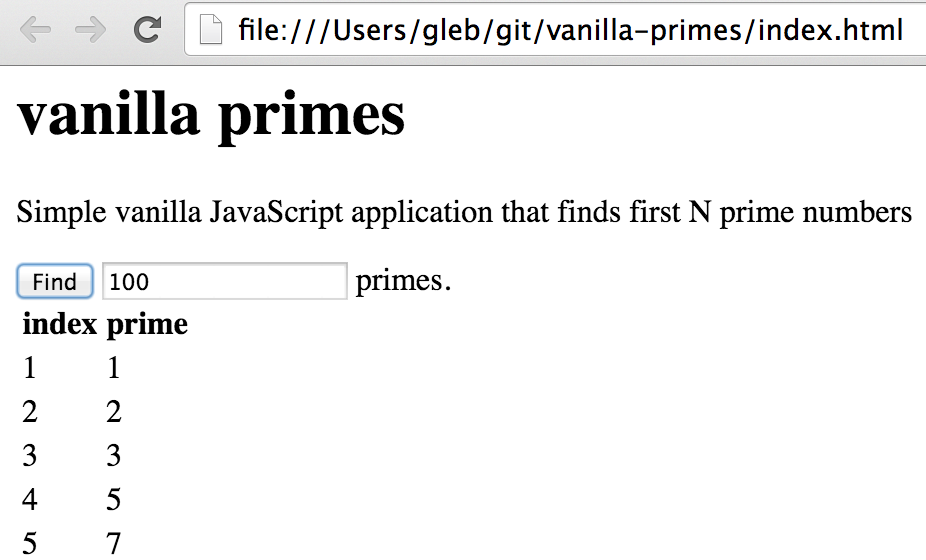
profile(Photostack.prototype, '_rotate');js profiling example
example: github.com/bahmutov/vanilla-primes
my profiling rules
-
Profile in a "clean" browser
-
profile actual application
-
optimize top bottleneck first
Warning signs
- try - catch blocks
- modifying arguments
-
arguments = arguments || []
-
- deleting / adding properties
-
delete foo.bar
-
- calling function with different argument types
function add(a, b) {
    return a + b;
}
add(2, 3);
add('foo', 'bar');Will not be optimized
- eval
- debug
- long functions!
iojs 1.8.1 has more than 300 switches. A lot related to performance tuning
iojs --v8-options
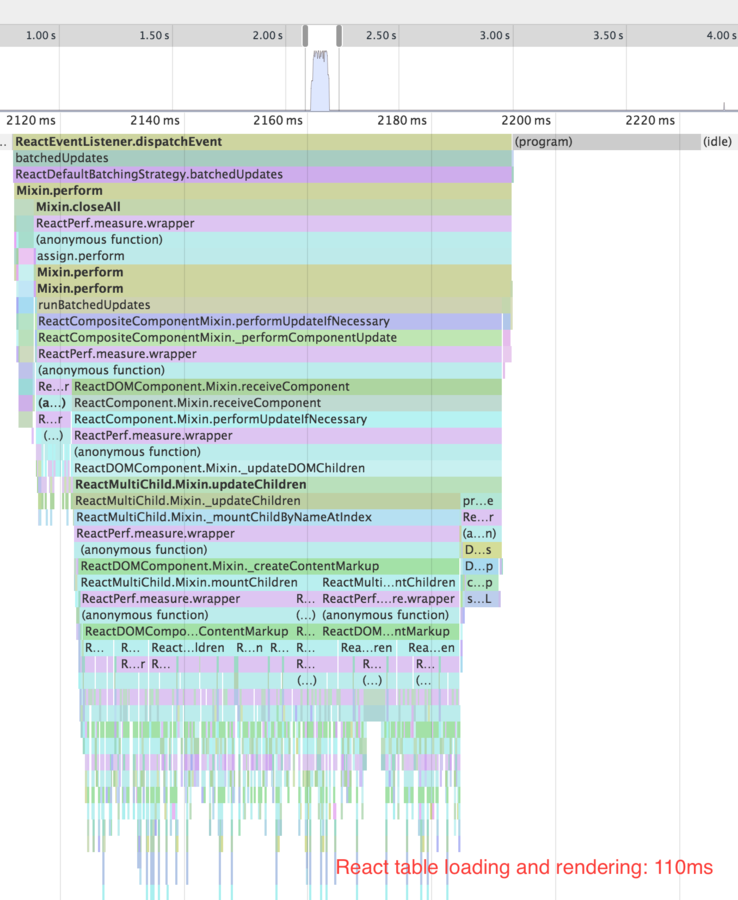
bad flame chart
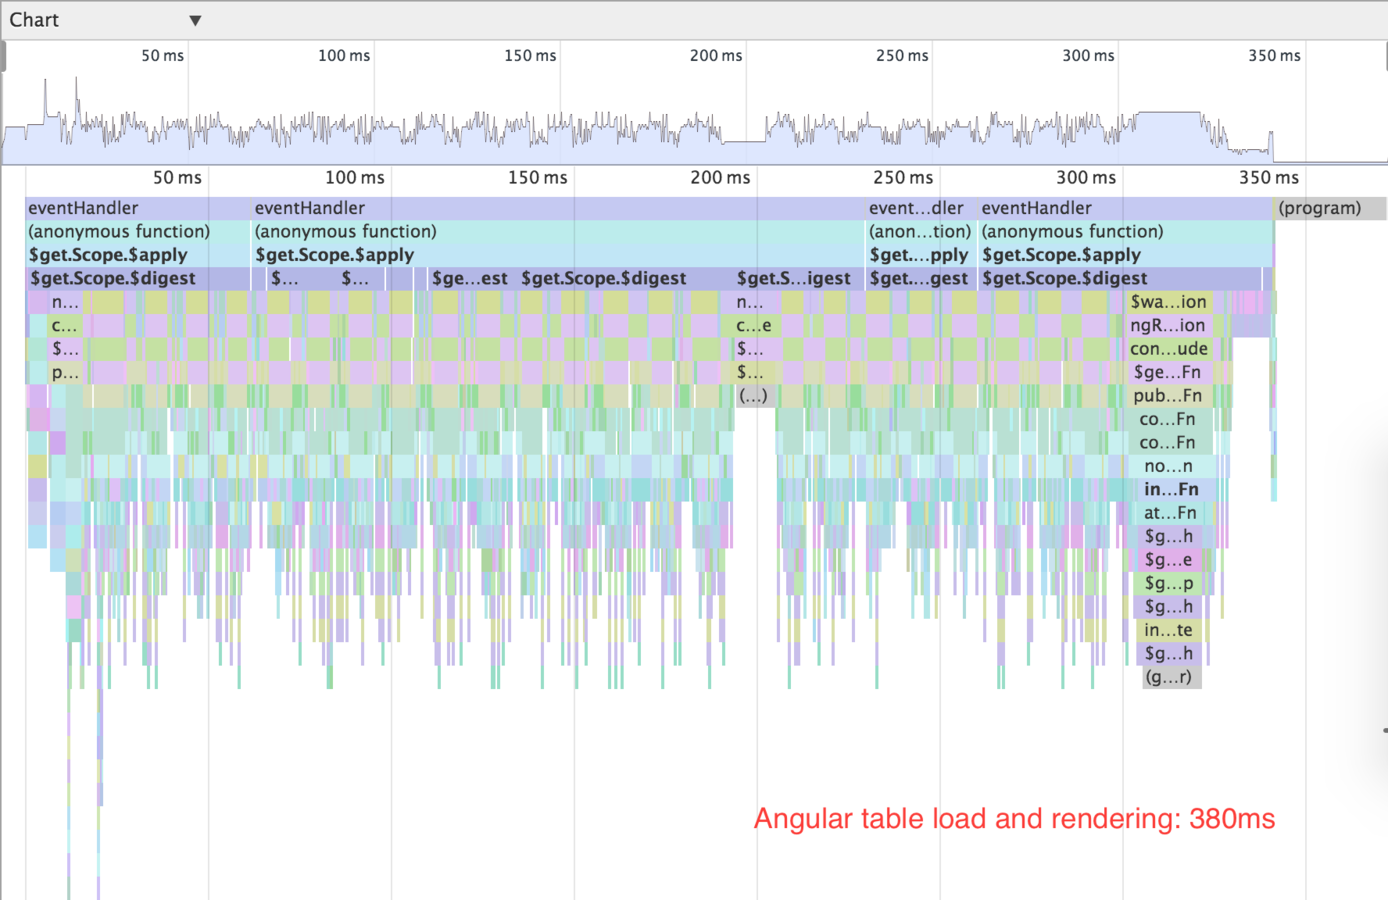
good flame chart
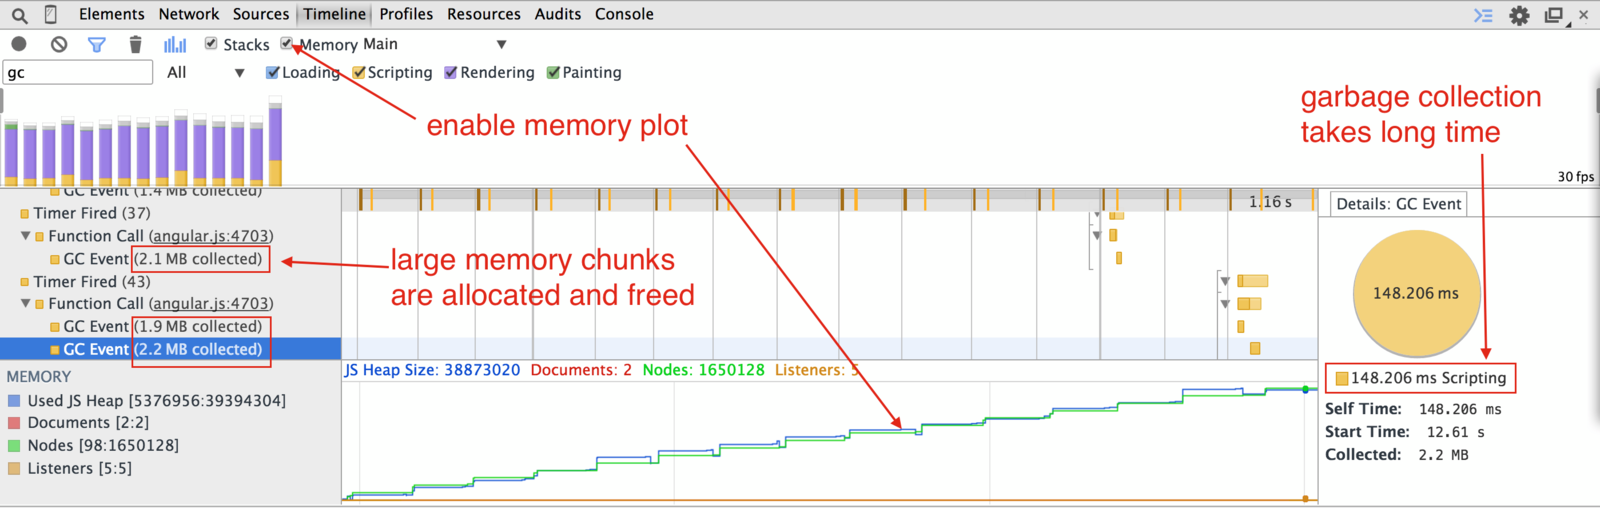
Find GC evets
var list = [], k;
for (k = 0; k < N; k += 1) {
  list.push( ... );
}
Profile memory
avoid gc events
Preallocate memory
// bad
var list = [], k;
for (k = 0; k < N; k += 1) {
list.push( ... );
}
// better
var list = [], k;
list.length = N;
for (k = 0; k < N; k += 1) {
list[k] = ...;
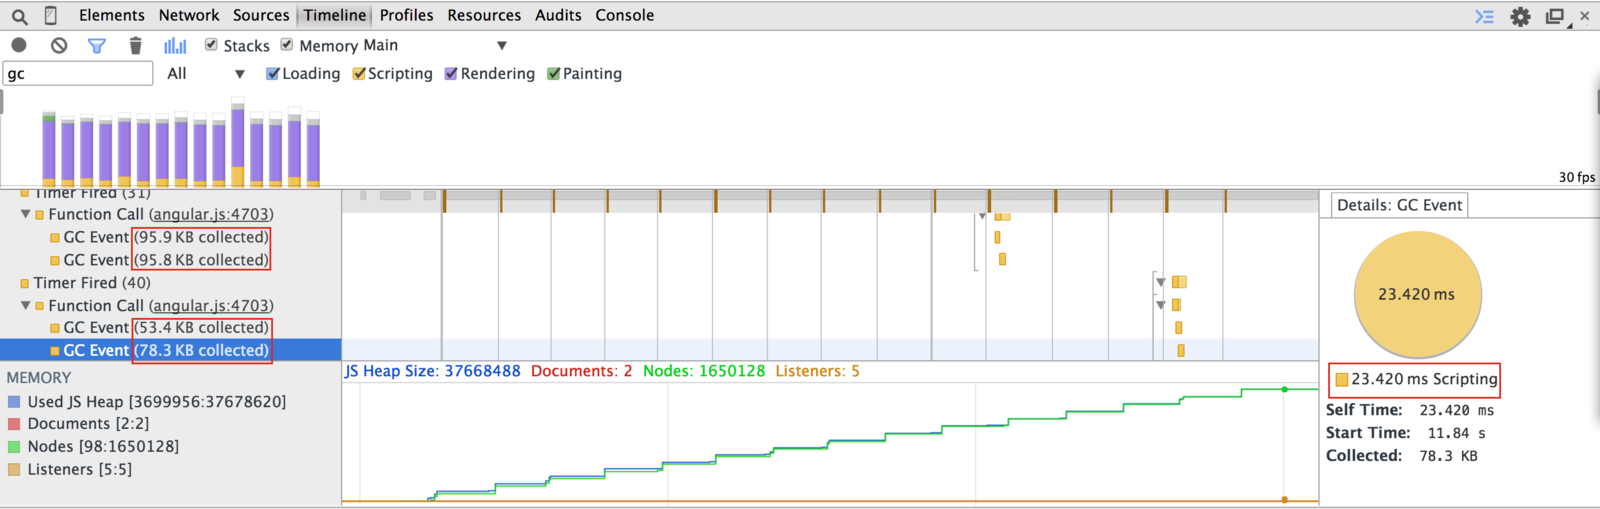
}Profile memory
avoid gc events with preallocated arrays
time web worker
var worker = new Worker('worker.js');
function renderPrimes(primes) {
    var html = primes.map(primeToRow).join('\n');
    document.querySelector('#results').innerHTML = html;
}
worker.onmessage = function (e) {
    console.log('worker has finished');
    renderPrimes(e.data);
};
var primesApp = {
    worker: worker,
    findFirstPrimes: function (n) {
        console.log('finding first', n, 'primes');
        worker.postMessage({ cmd: 'primes', n: n });
    }
};
document.querySelector('#find').addEventListener('click', function () {
    var n = Number(document.querySelector('#n').value);
    primesApp.findFirstPrimes(n);
});
Need to time separate actions
var m1 = obj1[methodName1];
var m2 = obj2[methodName2];

obj1[methodName1] = function () {
    console.profile('separate');
    console.time('separate');
    m1.apply(obj1, arguments);
};

obj2[methodName2] = function () {
    console.timeEnd('separate');
    console.profileEnd('separate');
    m2.apply(obj2, arguments);
};

// call with
// obj1 = primesApp.worker, methodName1 = 'postMessage'
// obj2 = primesApp.worker, methodName2 = 'onmessage'
Starting profiler manually seems to severely affect the
performance
What about timeline?
Layout profiler
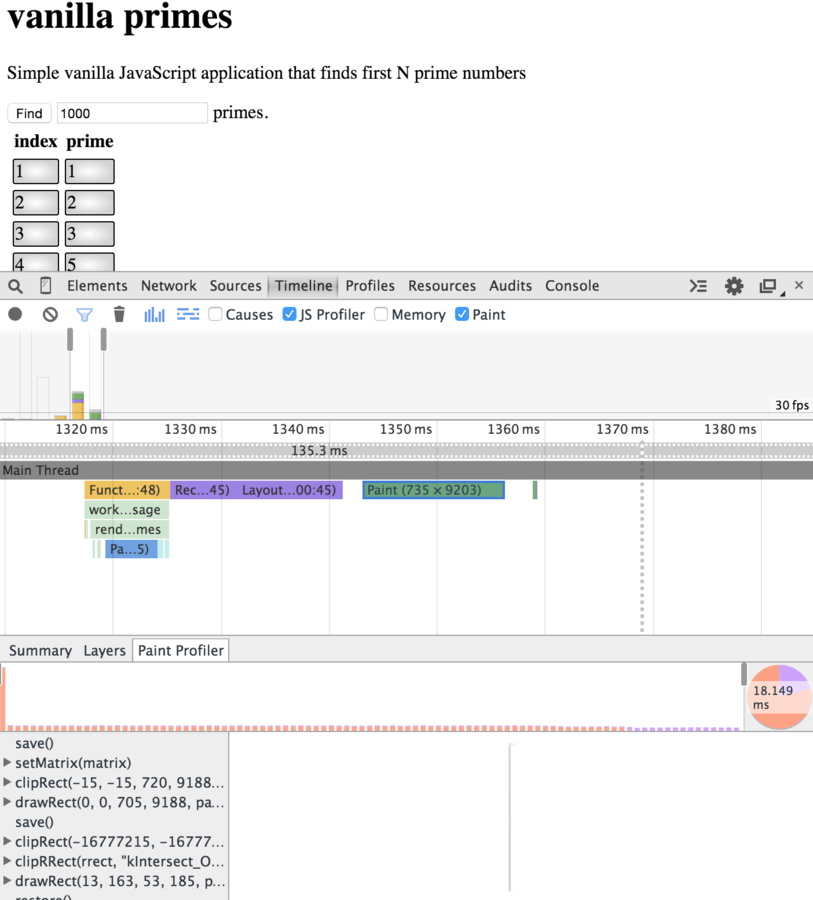
Paint profiler
Observe paint
Can code snippets be updated?
YES, inception-style
Related
- Angular performance using code snippets
- @bahmutov and glebbahmutov.com/blog/tags/performance/
- calendar.perfplanet.com/2014/
- @igrigorik, @addyosmani and @paul_irish
- Any talk on performance by John-David Dalton @jdalton (lodash)
MUST watch: "DevTools: State of the Union" by @addyosmani
performance matters
this presentation at slides.com/bahmutov/code-snippets
Event plug: Great League of Engineers
"What makes a team productive?" talks and panel
April 30th, at Brightcove office
http://www.eventbrite.com/e/great-league-of-engineers-tickets-16657822997