Perceived warmth and competence predict callback rates in meta-analyzed North American labor market experiments
Carina I. Hausladen*, Marcos Gallo*, Ming Hsu, Adrianna C. Jenkins, Vaida Ona, Colin F. Camerer




* contributed equallyWhy is the employment gap for people with disabilities so consistently wide?
Forbes, October 2022
How discrimination leads to a motherhood penality in the labor market
Forbes, September 2021
For Black workers age discrimination strikes twice
The Washington Post, May 2021



Correspondence Studies
Lakisha
Bertrand M, Mullainathan S.
Are Emily and Greg more employable than Lakisha and Jamal? A field experiment on labor market discrimination.
American economic review. 2004
Emily
Lippens L, Vermeiren S, Baert S.
The state of hiring discrimination: A meta-analysis of (almost) all recent correspondence experiments.
European Economic Review. 2023
- 169 studies analysed
- various grounds of discrimination:
race, ethnicity
gender
motherhood
age
religion
disability
sexual orientation
physical appearance
wealth
marital status
military service
How to systematize this literature?
change in callback
🌍
🚻
🤱
👶👴
🛐
♿
🏳️🌈
👤
💰
💍
🎖️
How to systematize this literature?
Correspondence Studies
"[...] for the resume case, we had to set up a little clandestine spy operation. [...] It's hard to identify biases in human systems."
Is there an easier way to measure and/or predict labour market discrimination?
Social Perception
- Decades of social psychology literature have investigated the semantic dimensions that perceivers use to predict the character and intentions of other people.
- Some attributes are of greater importance for effectively coordinating social behavior than others and thus serve as fundamental dimensions of social perception.
- According to the Stereotype Content Model (Fiske et al. 2002), the most relevant criteria are the
- persons’ intentions
- and their ability to carry out their plans
Stereotype Content Model
Warmth
Competence
Stereotype Content Model
Warmth
Competence
surgeon
parent
🔆 💯 🌞 💖 🤝 😊
😊 friendly
🤝 trustworthy
💖 well-intentioned
🌞 good-natured
💯 sincere
🔆 warm
💪
🎯
🧠
⚙️
✅
🚀
capable
skilled
intelligent
efficient
competent
confident
Warmth
Competence
Hiring
Manager
☎
Callback
-
How to systematize this literature?
-
Is there an easier way to measure and/or predict labour market discrimination in humans?
Hiring
Manager
☎
Callback
Lakisha
In your opinion, what does the
average American think about this person?
Even if you disagree.
Warm
0 · · · · · · · · · 50 · · · · · · · · 100
Competent
0 · · · · · · · · · 50 · · · · · · · · 100
Prolific
Participant
Lakisha
Warm
Competent
Prolific
Participant
☎
Callback

Hiring
Manager
Data
Sincerely,
Lakisha Washington
Lakisha
Washington
Hello, I am active in an organisation as
Treasurer of the Gay and Lesbian Alliance, and I am a
member of the Jewish Student Alliance.
Experience
2017–2020 Front Desk Manager
Education
2010 B. Sc. in Public Relations
Community Service
2008–2010 Coordinator
Hobbies
Sailling, Polo, Classical Music
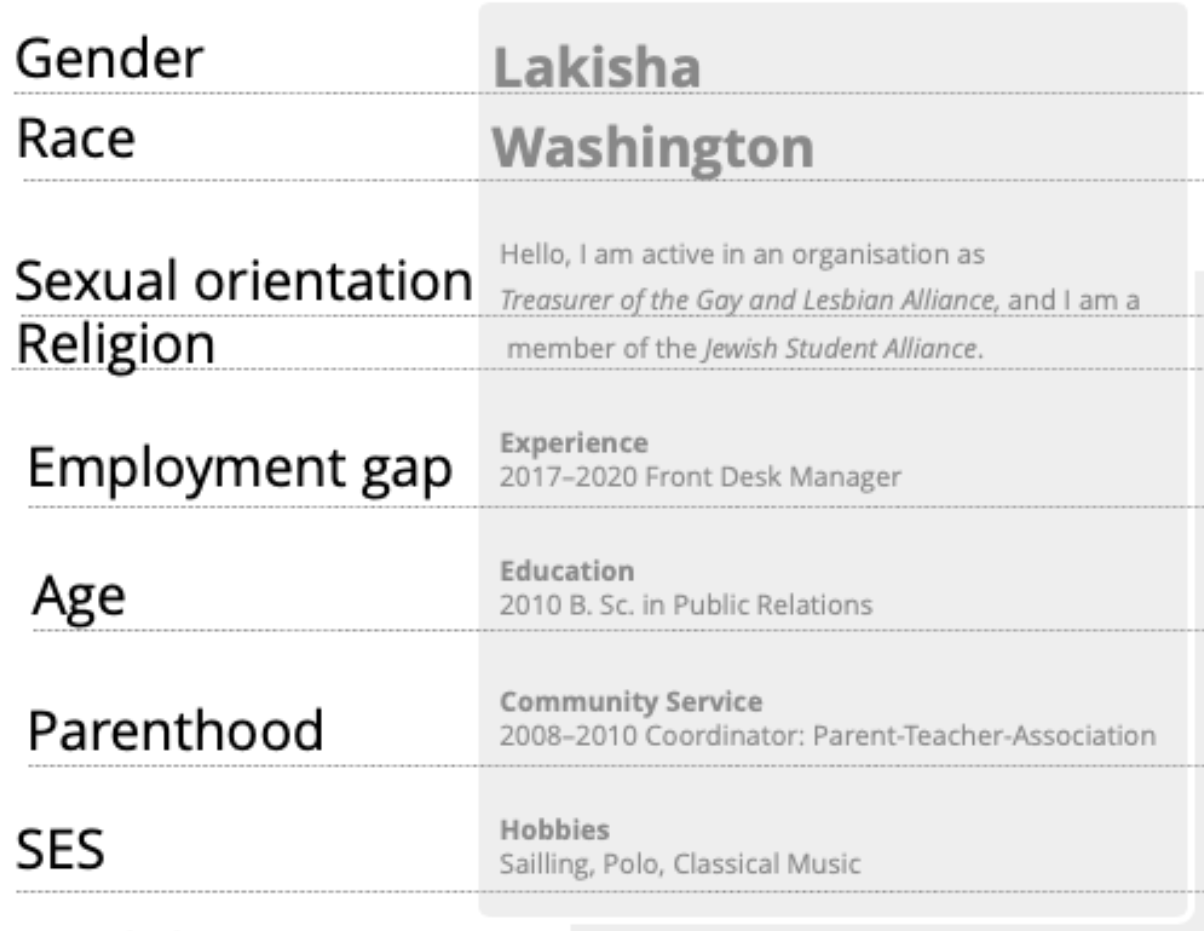
Names
Gender
Race
Sexual orientation
Religion
Employment gap
Age
Parenthood
SES
Disability
Nationality
8
4
1
1
2
2
2
2
2
TOTAL
21
Studies
CATEGORY
| study | name | callback |
|---|---|---|
| Bertrand | Aisha | 1 |
| Bertrand | Anne | 1 |
| Bertrand | Anne | 0 |
Hiring
Manager
☎
Callback
Random Effects Model
\[ \hat{\theta}_k = \mu + \zeta_k + \epsilon_k \]
observed effect size
mean of
distribution of true effect sizes
sampling error of observed effect size
sampling error of true
effect size
Gender
Race
Gender
Race
Hiring
Manager
☎
Callback
\[ \hat{\theta}\]
| lower | upper | p-value | SE | ||
| Female | 1.02 | -0.03 | 0.06 | 0.36 | 0.01 |
| Black | 0.79 | –0.51 | 0.04 | 0.07 | 0.09 |
95% CI
Gender
Race
Hiring
Manager
☎
Callback
\[ \hat{\theta}\]
| lower | upper | p-value | SE | ||
| Female | 1.02 | -0.03 | 0.06 | 0.36 | 0.01 |
| Black | 0.79 | –0.51 | 0.04 | 0.07 | 0.09 |
95% CI
Gender
Race
Hiring
Manager
☎
Callback
\[ \hat{\theta}\]
| lower | upper | p-value | SE | ||
| Female | 1.02 | -0.03 | 0.06 | 0.36 | 0.01 |
| Black | 0.79 | –0.51 | 0.04 | 0.07 | 0.09 |
95% CI
These findings align with Lippens et al., (2023).
Hiring
Manager
☎
Callback
Prolific
Participant
Warm
Competent
- 787 raters in total
- 85.9 per name
Prolific
Participant
Warm
Competent
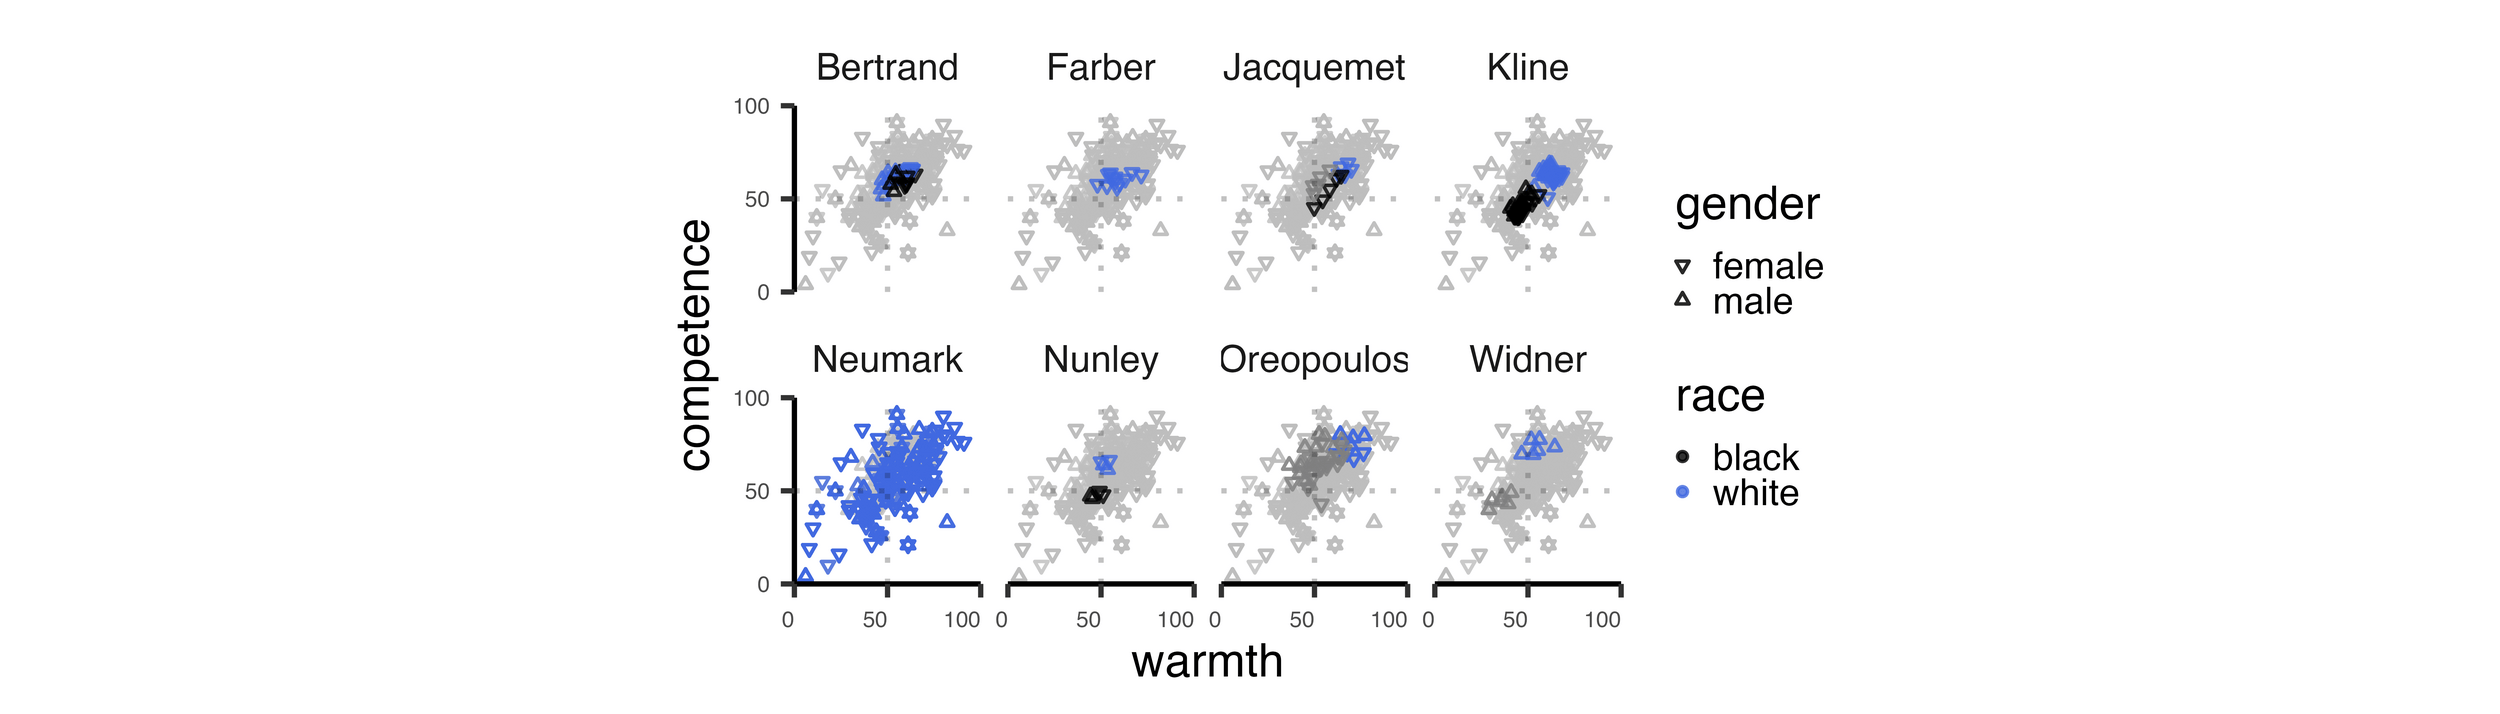
Gender
female
male
Race
Black
White
Prolific
Participant
Warm
Competent
ICC (3,1)
Intraclass Correlation Coefficient
How reliable are those ratings?
-
Single Rating
-
Fixed Set of Raters
-
Consistency of Rating
-
How much do the ratings for the same name vary across different raters?
-
Warm
Competent
ICC (3,1)
excellent
good
moderate
Gender
Race
female
male
Black
White
Warm
Competent
Gender
Race
Prolific
Participant
| lower | upper | p-value | SE | ||
| Female | 2.88 | –4.39 | 10.16 | 0.40 | 3.27 |
| Black | –6.72 | –19.19 | 5.76 | 0.19 | 3.92 |
95% CI
\[ \hat{\theta}\]
Prolific
Participant
Warm
Competent
Gender
Race
Competent
0 · · · · · · · · · 50 · · · · · · · · 100
| lower | upper | p-value | SE | ||
| Female | –3.07 | –9.56 | 3.42 | 0.32 | 2.91 |
| Black | –11.52 | –23.74 | 0.71 | 0.06 | 3.84 |
95% CI
\[ \hat{\theta}\]
Prolific
Participant
Warm
Competent
How correlated are warmth and competence?
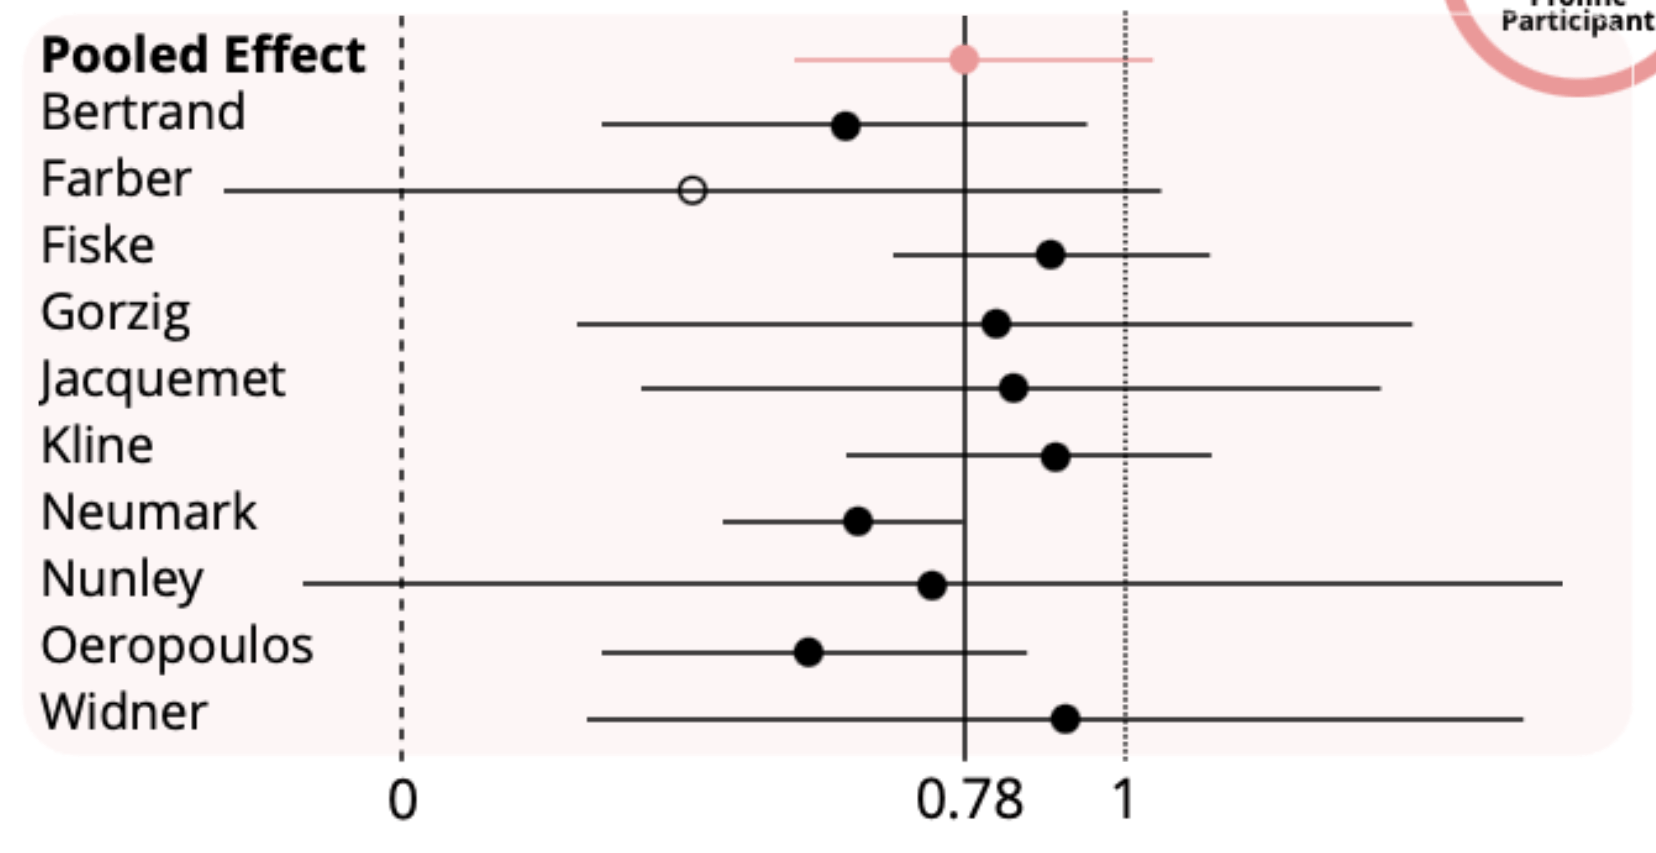
Pooled Effect
0
0.78
1
Bertrand
Farber
Fiske
Gorzig
Jacquemet
Kline
Neumark
Nunley
Oeropoulos
Widner
Prolific
Participant
Warm
Competent
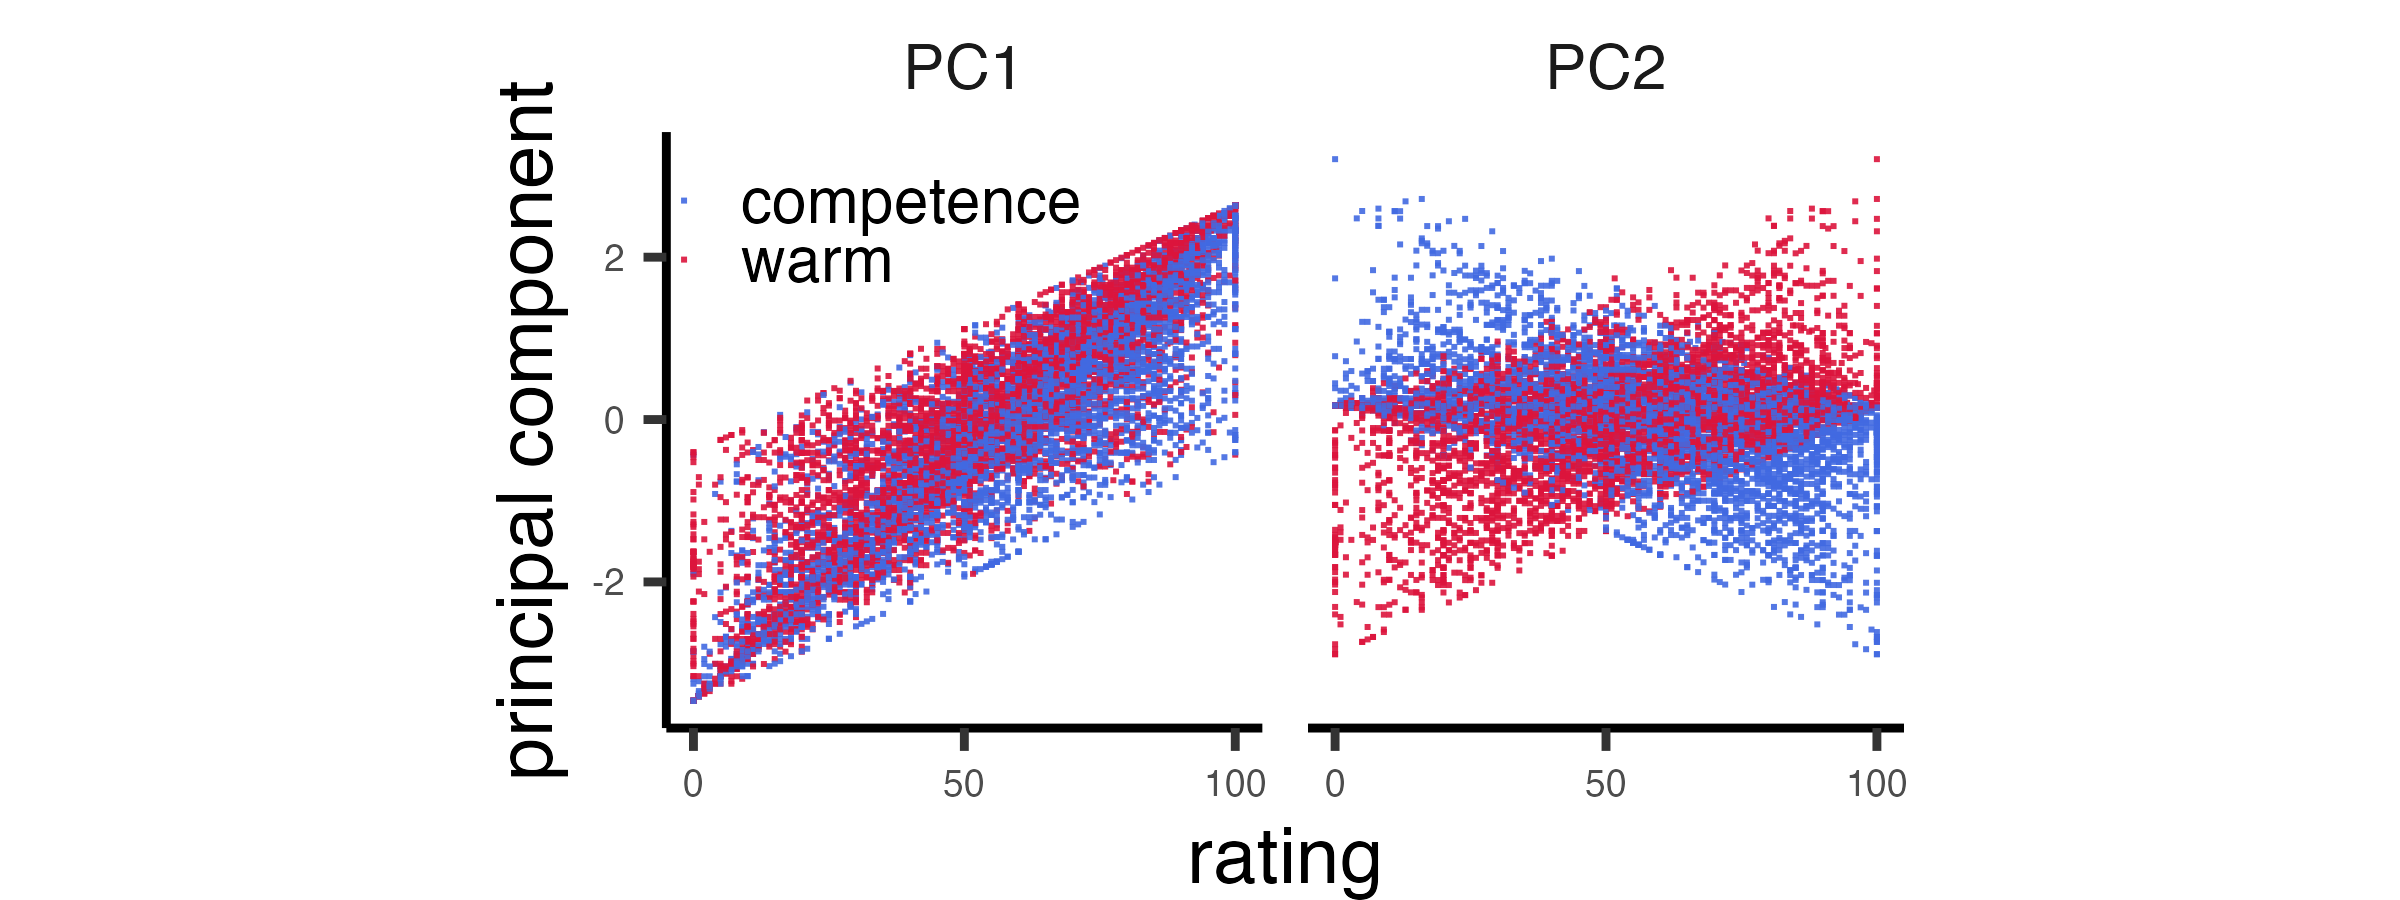
PC1
explains 79.3%
of the variance.
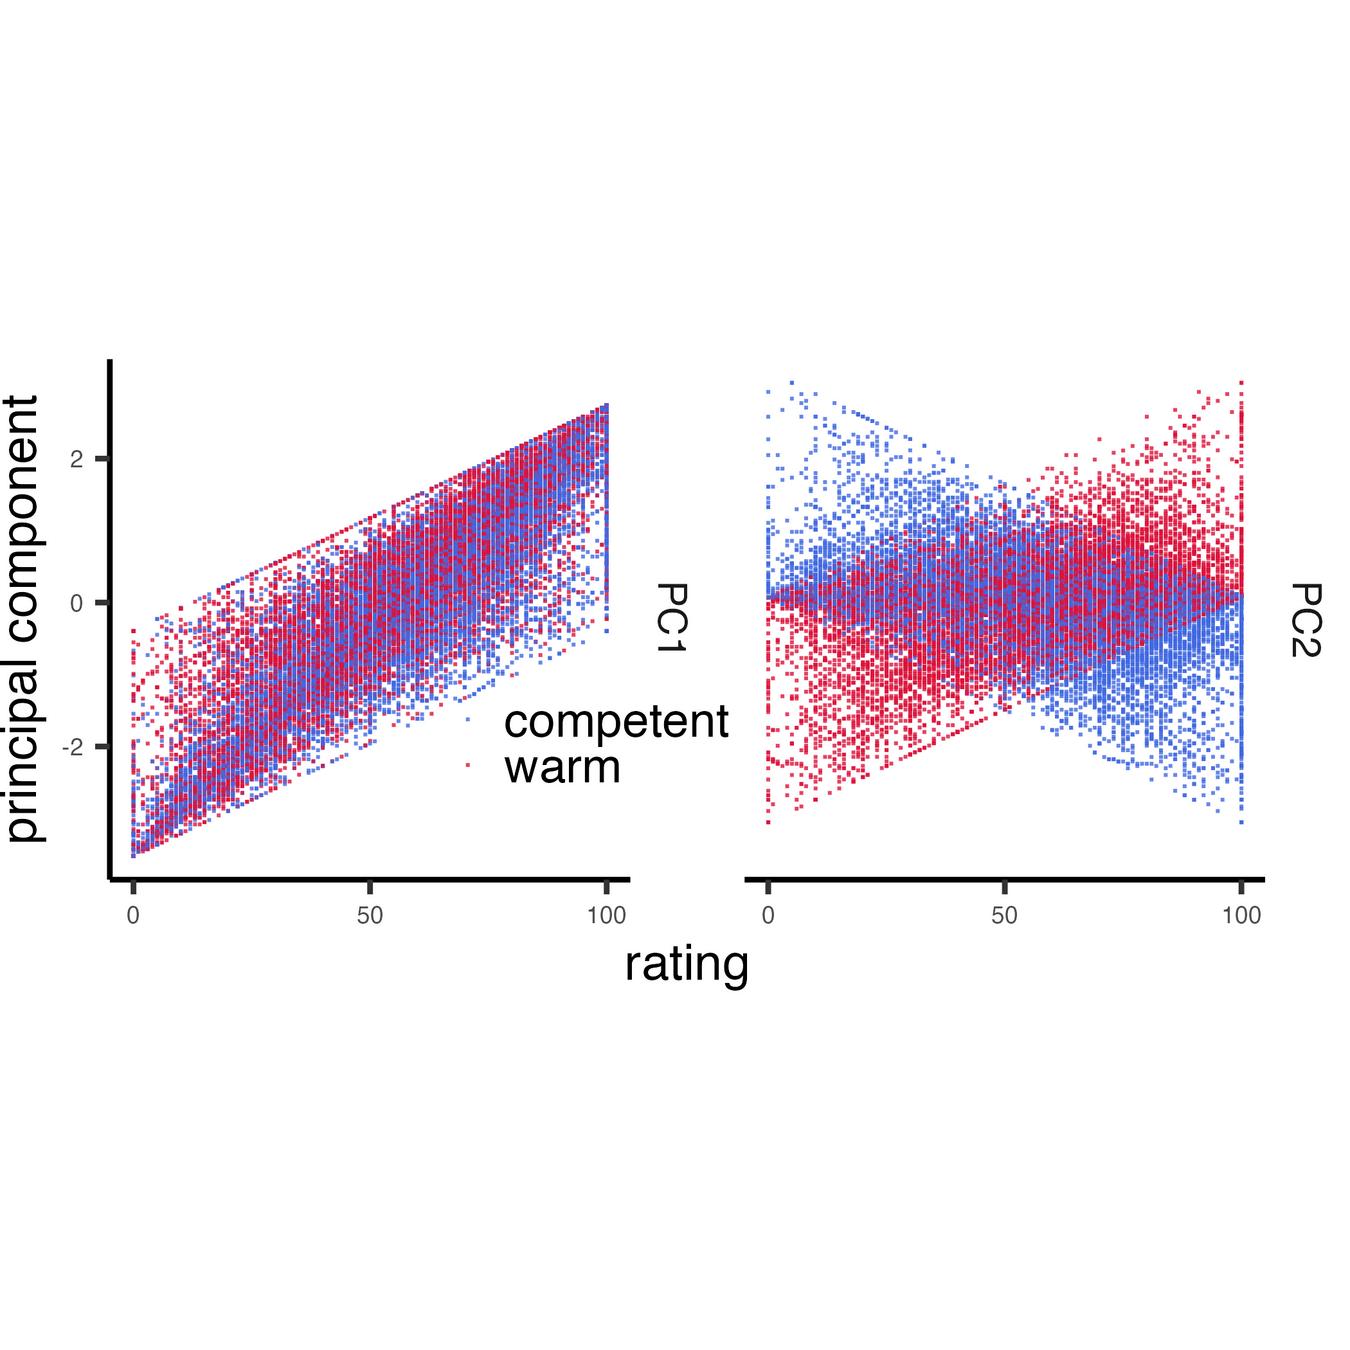
PC2
explains 20.7%
of the variance.
Principal Component Analysis
PC1
PC1
Prolific
Participant
PC1
Hiring
Manager
☎
Callback
PC1
| Name | Study | ||
|---|---|---|---|
| Aisha | Bertrand | 2.22 | 0.48 |
| Allison | Bertrand | 9.48 | 0.52 |
Callback
Effect Size \(\rho\)
| Study | |
|---|---|
| Bertrand | 0.01 |
| Farber | 0.06 |
.
.
.
.
.
.
.
.
.
.
.
.
\(\hat{\rho}\)
.
.
.
.
.
.
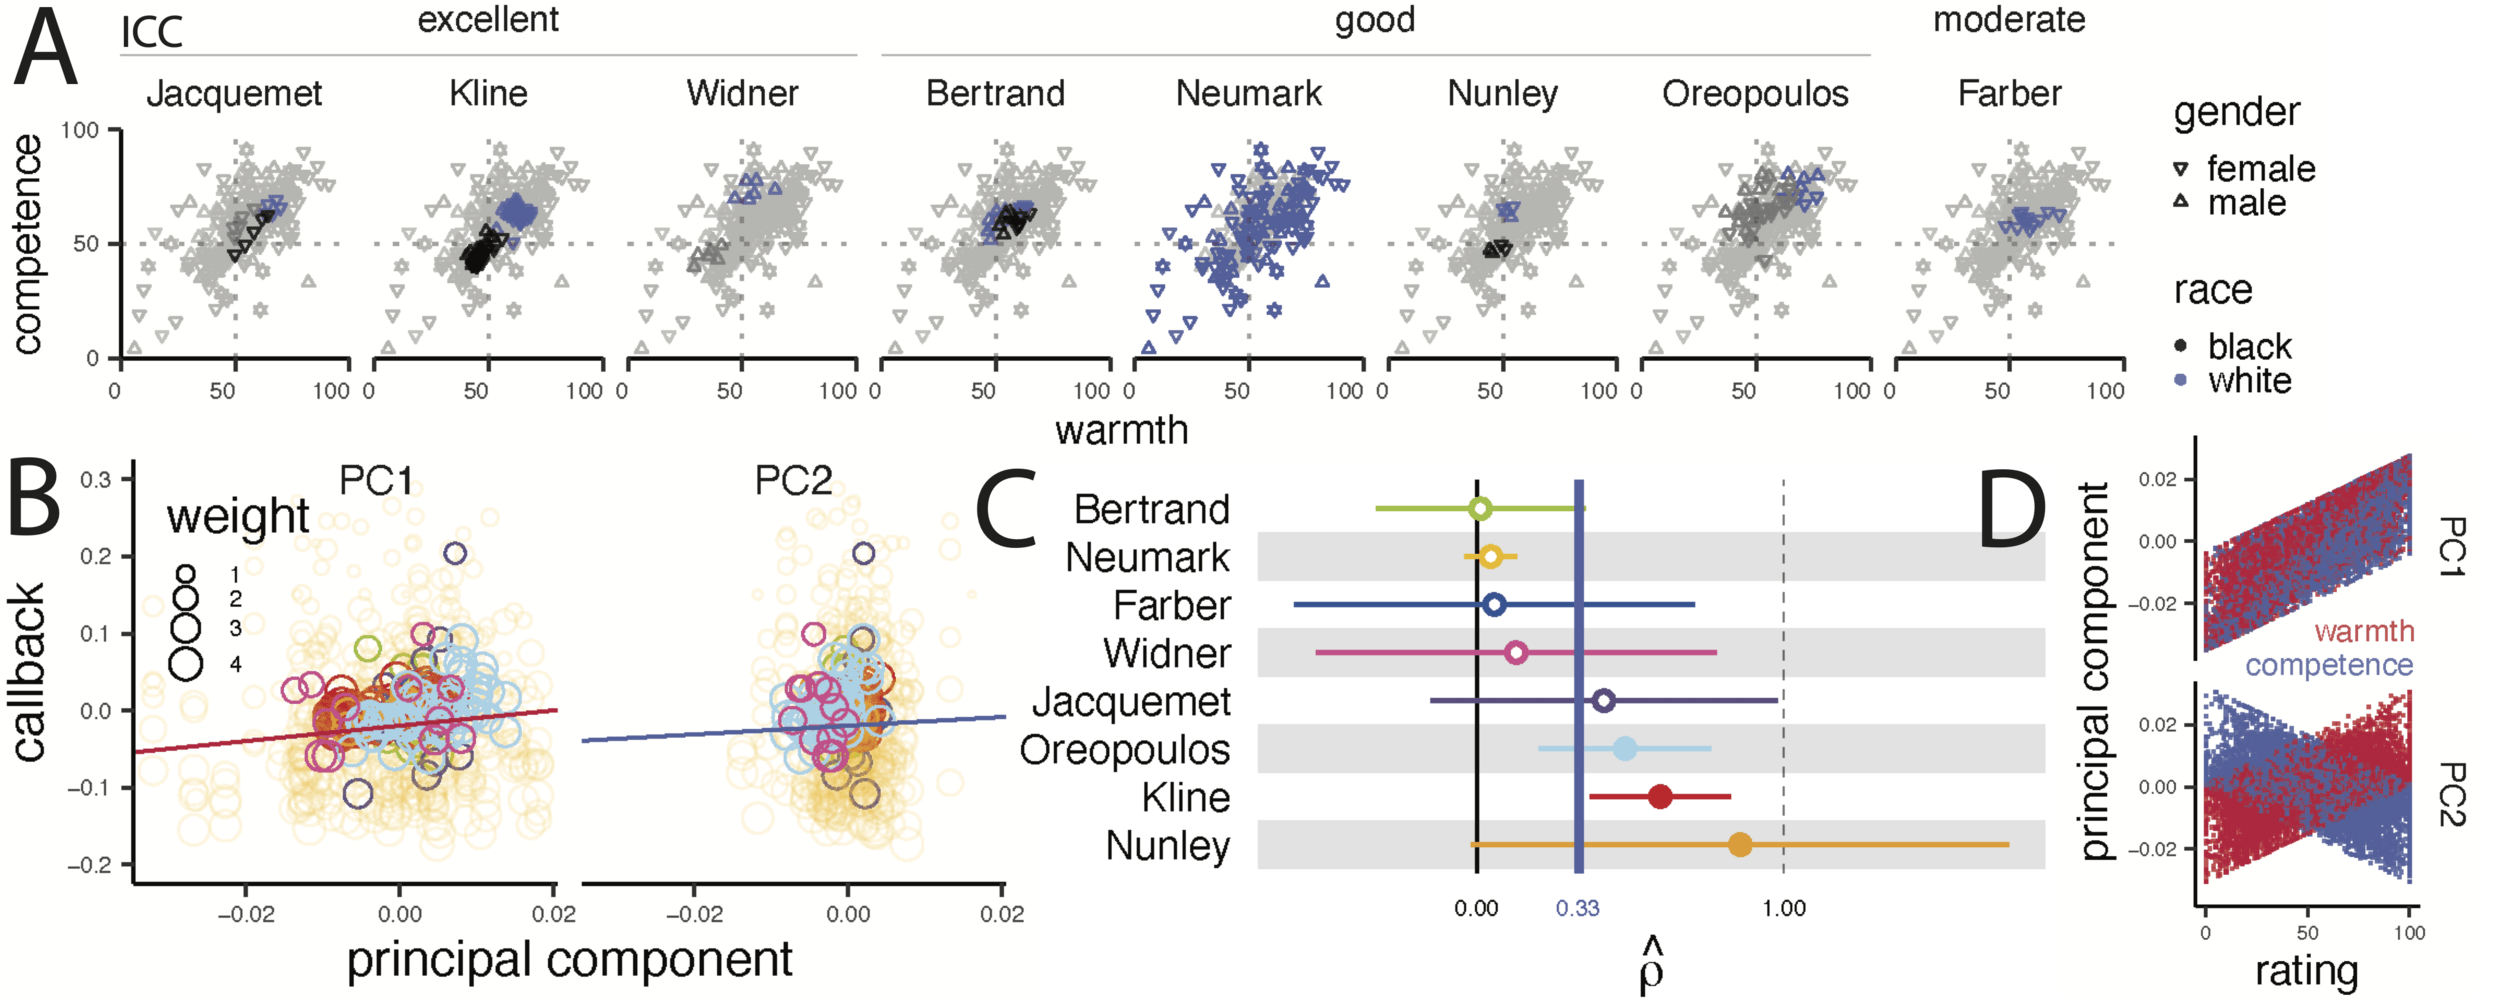
study
0
0.33
1
Bertrand
Neumark
Farber
Widner
Jacquemet
Oeropoulos
Kline
Nunley
| lower | upper | p-value | SE | ||
| PC1 | 0.33 | 0.03 | 0.66 | 0.03 | 0.13 |
95% CI
\(\hat{\rho}\)
\(\hat{\rho}\)
study
0
0.33
1
Bertrand
Neumark
Farber
Widner
Jacquemet
Oeropoulos
Kline
Nunley
\(\hat{\rho}\)
Predictive Power
- \[ \text{callback}_i = \beta_0 + \beta_1 \text{PC1}_i + \beta_2 \text{PC2}_i + \epsilon_i \]
- trained a linear model on all names except one
- predict the callback for the left-out name
competence
warmth
median
58.2
median
61.8
black
Lakisha Jonesforeign
white
Laurie Andersoncompetence
warmth
median
58.2
black
Lakisha Jonesforeign
white
Laurie Anderson11–15%
16–20%
21–26%
median
61.8
callback %
Alternative Specification: Meta-Regression
\[ \hat{\theta}_k = \theta + \beta x_k + \epsilon_k + \zeta_k \]
observed effect size
sampling error of observed
effect size
coefficient
sampling error of true
effect size
fixed effect
random effect
Meta-Regression
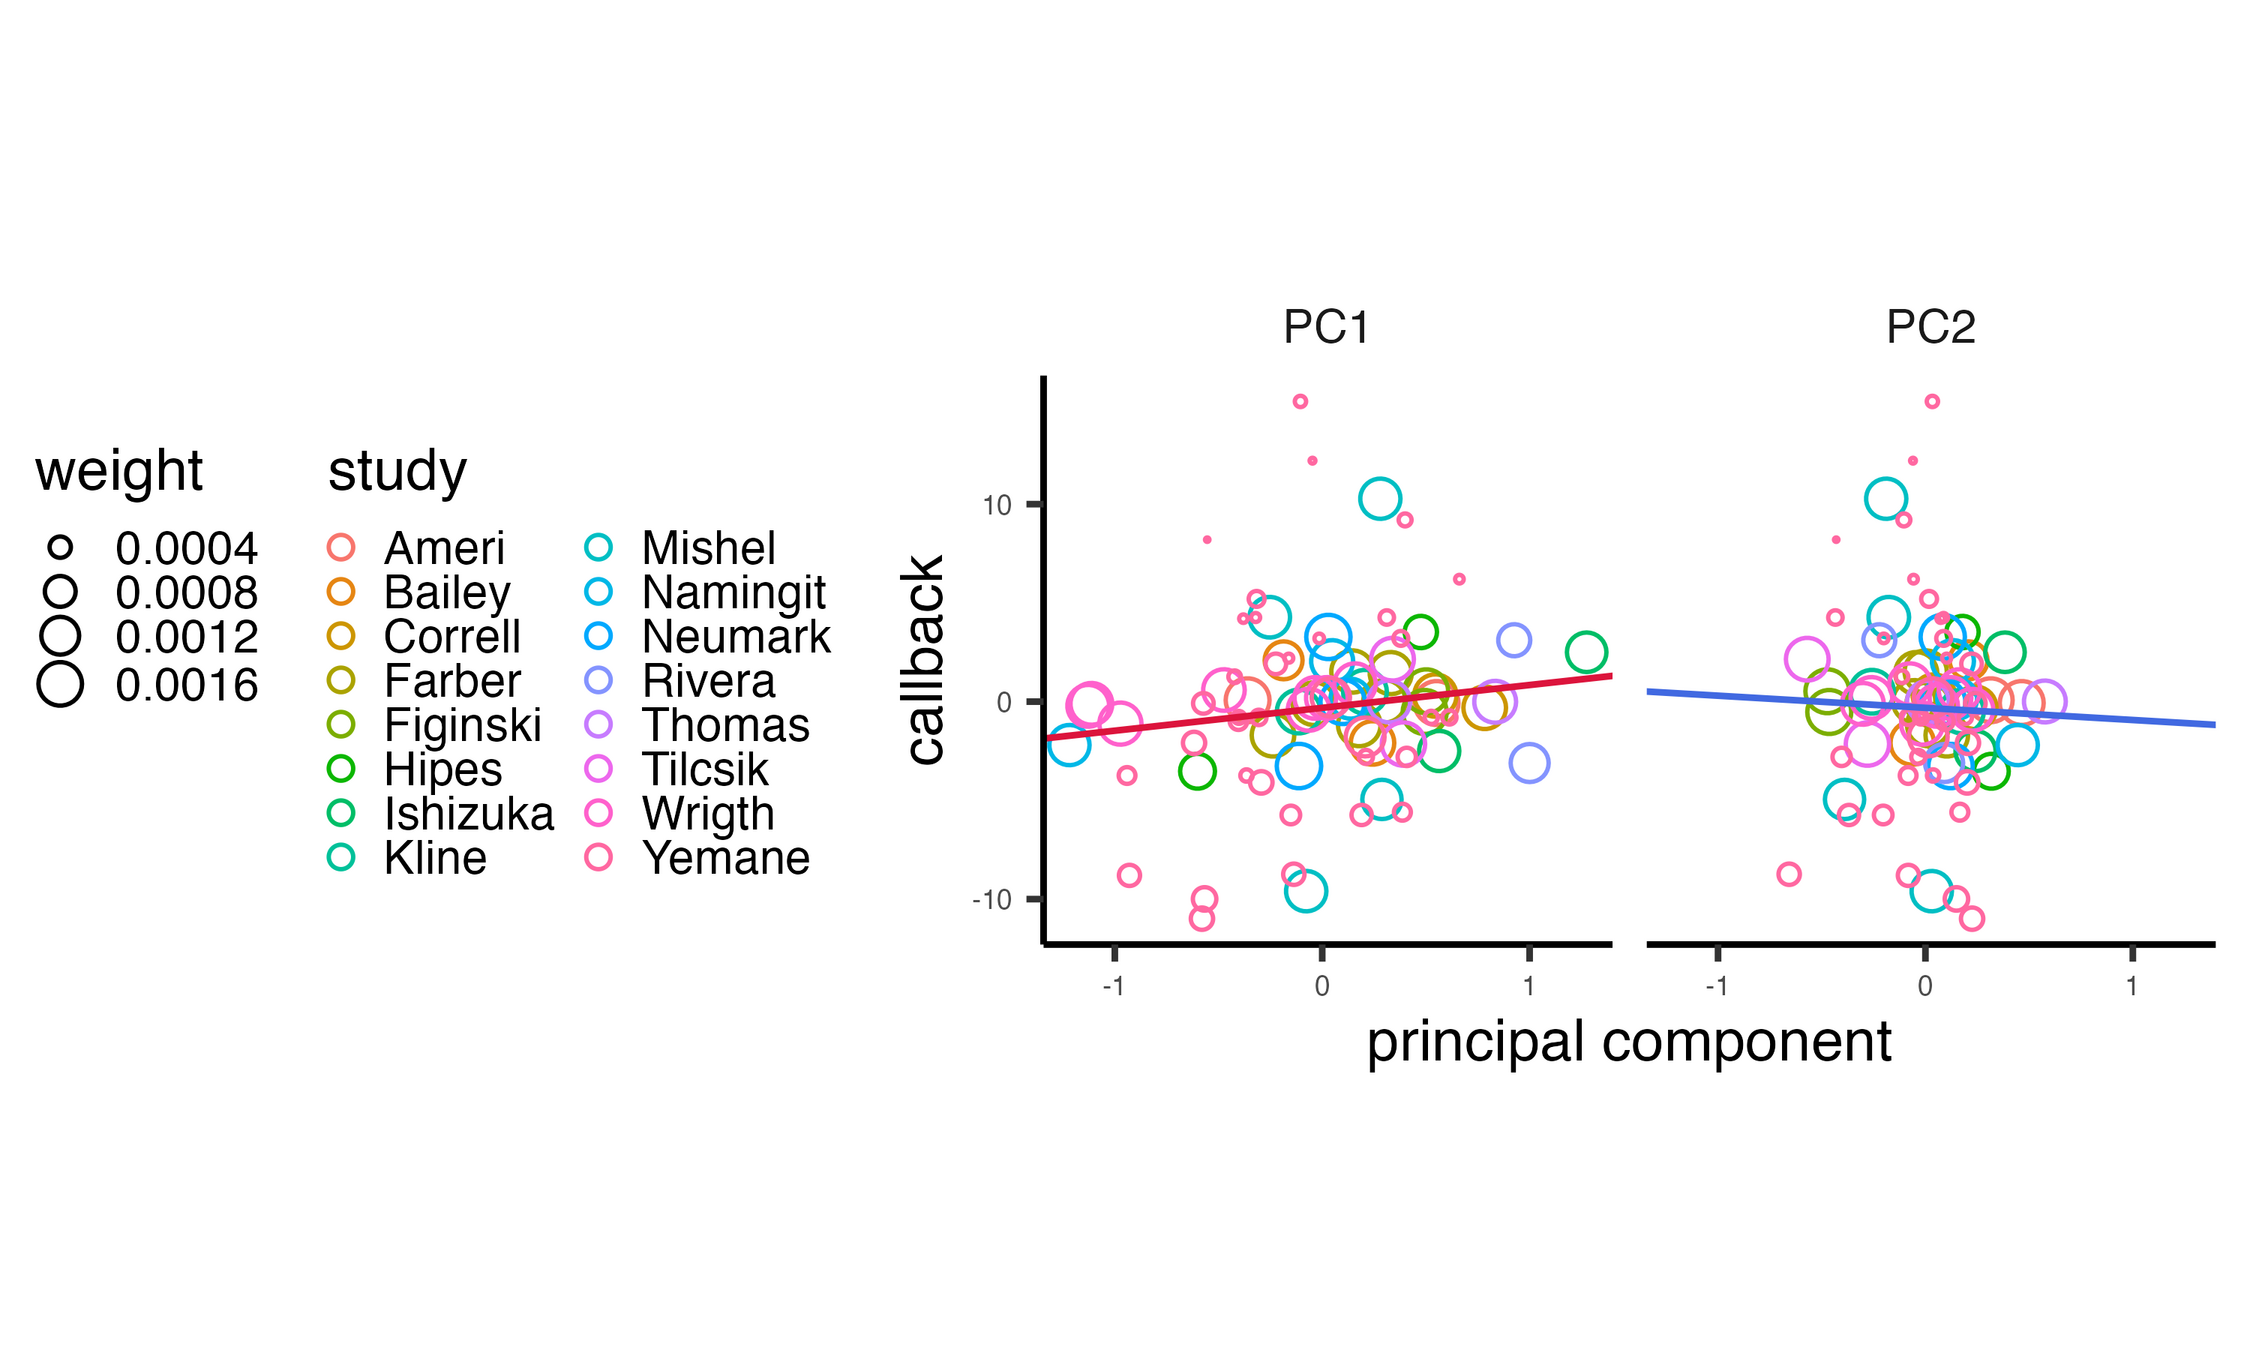
\[ \hat{\theta}_k = \theta + \beta_1 PC1_k + \beta_2 PC2_k + \epsilon_k + \zeta_k \]
coefficients
| lower | upper | p-value | SE | ||
| PC1 | 1.00 | 0.41 | 1.58 | 0.00 | 0.30 |
| PC2 | 0.56 | -0.83 | 1.96 | 0.43 | 0.71 |
95% CI
Sincerely,
Lakisha Washington
Lakisha
Washington
Hello, I am active in an organisation as
Treasurer of the Gay and Lesbian Alliance, and I am a
member of the Jewish Student Alliance.
Experience
2017–2020 Front Desk Manager
Education
2010 B. Sc. in Public Relations
Community Service
2008–2010 Coordinator: Parent-Teacher-Association
Hobbies
Sailling, Polo, Classical Music
Names
Categories
Gender
Race
Sexual orientation
Religion
Employment gap
Age
Parenthood
SES
Disability
Nationality
8
4
1
1
2
2
2
2
2
TOTAL
21
Studies
CATEGORY
Prolific
Participant
Warm
Competent
- 200 raters in total
- 99.11 per category
Warm
Competent
ICC (3,1)
Intraclass Correlation Coefficient
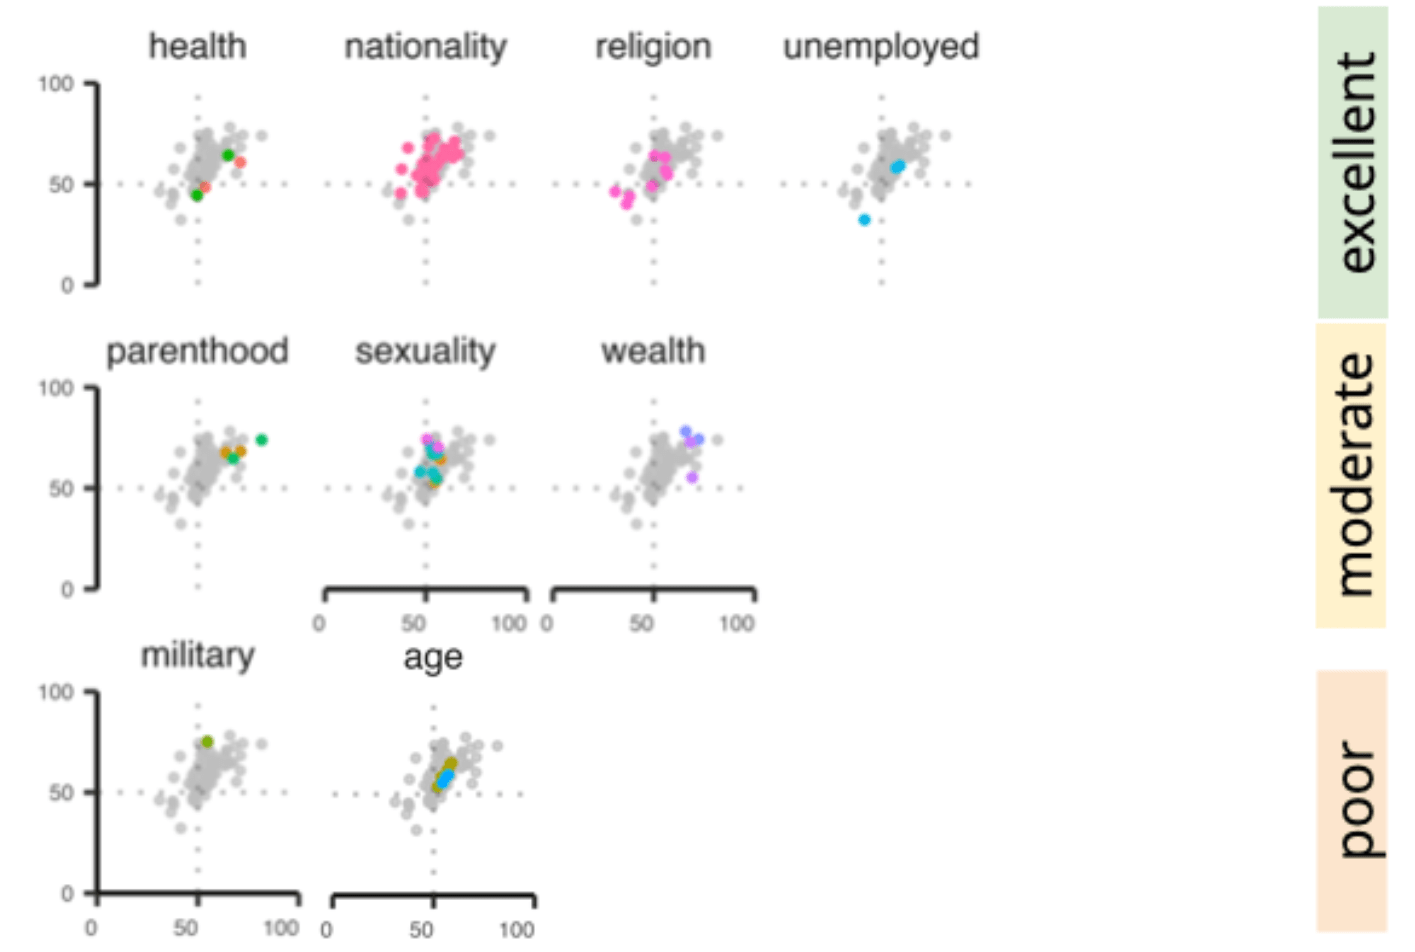
excellent
moderate
poor
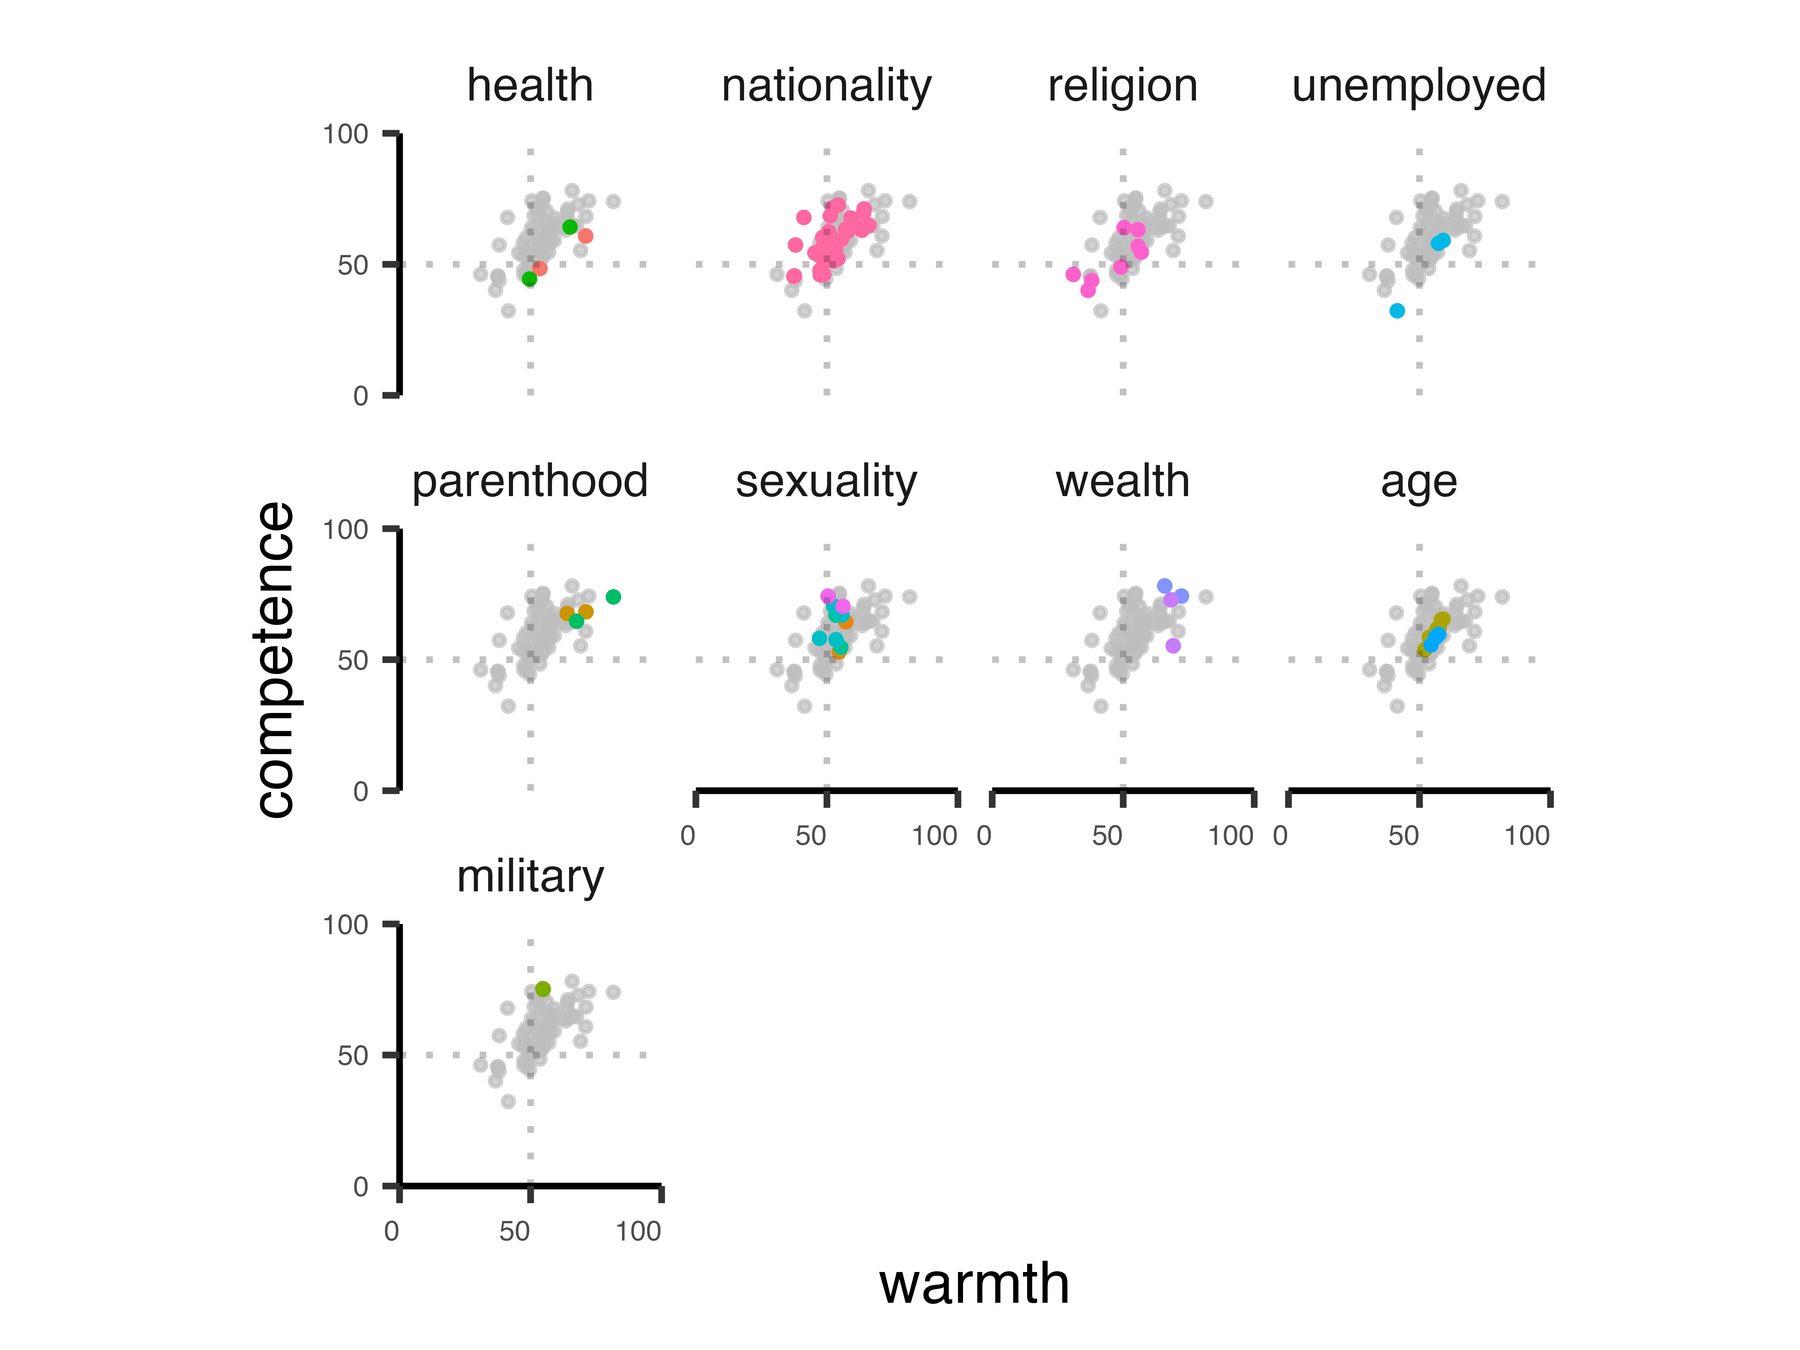
Prolific
Participant
Warm
Competent
PC1
explains 80.7%
of the variance.
PC2
explains 19.3%
of the variance.
Principal Component Analysis
PC1
Prolific
Participant
Hiring
Manager
☎
Callback
| Study | Category Level | Callback Ratio |
|---|---|---|
| Ameri | German | 0.049 |
| Ameri | French | 0.048 |
| Bailey | Gay | 0.16 |
.
.
.
.
.
.
.
.
.
Warm
Competent
Meta-Regression
\[ \hat{\theta}_k = \theta + \beta x_k + \epsilon_k + \zeta_k \]
observed effect size
sampling error of observed
effect size
coefficient
sampling error of true
effect size
fixed effect
random effect
Meta-Regression
\[ \hat{\theta}_k = \theta + \beta_1 PC1_k + \beta_2 PC2_k + \epsilon_k + \zeta_k \]
coefficients
\[ PC1 PC2 \]
Callback
\[ PC1 PC2 \]
Callback
| lower | upper | p-value | SE | ||
| PC1 | 1.16 | –0.28 | 2.59 | 0.12 | 0.72 |
| PC2 | –0.62 | –3.58 | 2.35 | 0.69 | 1.49 |
95% CI
\[ \hat{\theta}\]
Category membership could probably not be effectively signalled.
Lakisha
Washington
Experience
2017–2020 Front Desk Manager
Education
2010 B. Sc. in Public Relations
Community Service
2008–2010 Coordinator
Hobbies
Sailling, Polo, Classical Music
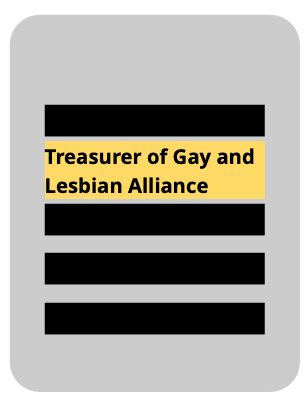
Reduced variation in signals.
Moderate and poor ICC for most categories.
Fewer studies.
Conclusion
- PC1 explains 80% of the variance.
-
Names: Warmth and competence perception predicted callback.
- Categories: The effects of social perception on callback rates are ambiguous.
Implications
- Overarching framework to both
- explain and
- systematise the large body of correspondence studies.
- The framework allows for the generalisation of underexplored stereotypes (intersectionality).

Theories of Discrimination
- Statistical Discrimination
- Employers use observable characteristics as proxies for unobservable traits.
- Process is inefficient if characteristics are weakly correlated with job performance but strongly correlated with social perceptions.
-
Taste-Based Discrimination
- Personal prejudices/tastes held by employers
- Observable characteristics elicit subjective judgements of warmth and competence.
- Institutional Discrimination
- National context shapes the behaviour of social actors.
- We can not add to this theory as we only focus on the North American labour market and, therefore, have no comparison.
Marcos
Gallo






Ming
Hsu
Adrianna C.
Jenkins
Vaida
Ona
Colin F.
Camerer
carinah@ethz.ch

slides.com/carinah


Appendix
\(\tau^2\)
-
\(\tau^2 = 0.08\)
-
95% CI [0.03–0.66]
\(I^2\)
$$ I^2 = \frac{Q - (K - 1)}{Q} $$
Cochran's Q:
weighted sum of squares
total number of studies
- \(I^2 = 0.83\)
- 95% CI [0.69–0.91]
Prediction Interval
$$ \hat{\mu} \pm t_{K-1, 0.975} \sqrt{\hat{SE}^2_{\hat{\mu}} + \hat{\tau}^2} $$
standard error
of the
pooled effect
Prediction Interval: [-0.40; 0.80]
Exercise
-
Assign Ratings:
Warmth Rating=45,Competence Rating=10Warmth=45,Competence=10 -
PCA Loadings for PC1 and PC2:
-
PC1 Loadings=(−0.70 −0.70) -
PC2 Loadings=(−0.70 0.70)
PC1 Loadings=(−0.7071−0.7071)
PC2 Loadings=(−0.70710.7071)
-
-
Calculate PC1 Score:
PC1X Æ A-12=(45×−0.7071)+(10×−0.7071)=−38.89PC1X Æ A-12=(45×−0.70)+(10×−0.70)=−38.89 -
Calculate PC2 Score:
PC2X Æ A-12=(45×−0.7071)+(10×0.7071)=−24.75PC2X Æ A-12=(45×−0.70)+(10×0.70)=−24.75
-
Formula Used:
θ^X Æ A-12=θ+β1×PC1X Æ A-12+β2×PC2X Æ A-12+ϵX Æ A-12+ζX Æ A-12θ^X Æ A-12=θ+β1×PC1X Æ A-12+β2×PC2X Æ A-12+ϵX Æ A-12+ζX Æ A-12 -
Given Values:
θ=−1.97,β1=1,β2=0.56θ=−1.97,β1=1,β2=0.56PC1X Æ A-12=−38.89,PC2X Æ A-12=−24.75PC1X Æ A-12=−38.89,PC2X Æ A-12=−24.75 -
Calculation:
θ^X Æ A-12=−1.97+(1×−38.89)+(0.56×−24.75)θ^X Æ A-12=−1.97+(1×−38.89)+(0.56×−24.75)θ^X Æ A-12=−1.97−38.89−13.86=−54.72θ^X Æ A-12=−1.97−38.89−13.86=−54.72 -
Interpretation:
The predicted callback rate for "X Æ A-12" is -54.72%, indicating a very low likelihood of receiving a callback.The predicted callback rate for "X Æ A-12" is -54.72%, indicating a very low likeli
Theoretical Models
Statistical discrimination (Arrow, 1998)
Unfair treatment of ethnic minorities can result from rational actions executed by profit-maximizing actors who are confronted with the uncertainties accompanying selection decisions.
Taste-based discrimination (Becker, 2010)
Discriminatory behavior is the result of people’s unfavorable attitudes toward ethnic minorities.
\[\tau^2\]
\[ \tau^2 \] is a measure of the variance of true effect sizes across studies. \[ \tau^2 \] =0.08 suggests that there is variability in the effect sizes across the studies that cannot be attributed to sampling error alone. This variability could be due to differences in study designs, populations, interventions, or other factors.
Confidence Interval (CI): The confidence interval provides a range in which we are fairly confident that the true value of \[\tau^2\] lies. In our case, the 95% CI ranges from 0.03 to 0.66. This wide range indicates considerable uncertainty about the precise value of the variance. The lower bound (0.03) suggests that there is at least some heterogeneity, while the upper bound (0.66) indicates that the heterogeneity could be quite substantial.
Significance of Heterogeneity: The fact that the confidence interval does not include zero suggests that the heterogeneity is statistically significant. This means that the variance of true effect sizes is likely greater than zero, indicating that the effect sizes are not consistent across all studies.
Implications for Meta-Analysis: Significant heterogeneity, as indicated by our results, means that caution should be exercised in interpreting the overall effect size obtained from the meta-analysis. It suggests that the included studies are not estimating the same underlying effect size and that there may be subgroup differences or moderating variables that need to be explored.
Cochran’s Q: $$ Q=\sum_{k=1}^{K} w_k (\hat{\theta}_k - \hat{\theta})^2$$
inverse of the study’s variance
\[ICC(3,1) = \frac{MS_B - MS_E}{MS_B + (k - 1)MS_E}\]
mean square between signals
mean square error
k
raters
competence
warmth
median
58.2
median
61.8
white
black
foreign
Lakisha JonesLaurie Anderson11–15%
16–20%
21–26%