Week 3
Please sit on the right half of the room
--->
Dynamic Analysis
(Triage)
Static Triage
$ man <tool name>
...
$ xxd <filename>
$ file <filename>
$ strings <filename>
$ nm -D <filename>
$ readelf <filename>
$ objdump -d -M intel --disassemble=<name>
Dynamic Triage
- Profiling: Tracking performance-related aspects like function call frequency and execution time
- Runtime Monitoring: Observing program execution in real-time, often by instrumenting the executable
- Environment Introspection: Looking at the operating system for effects of the executable
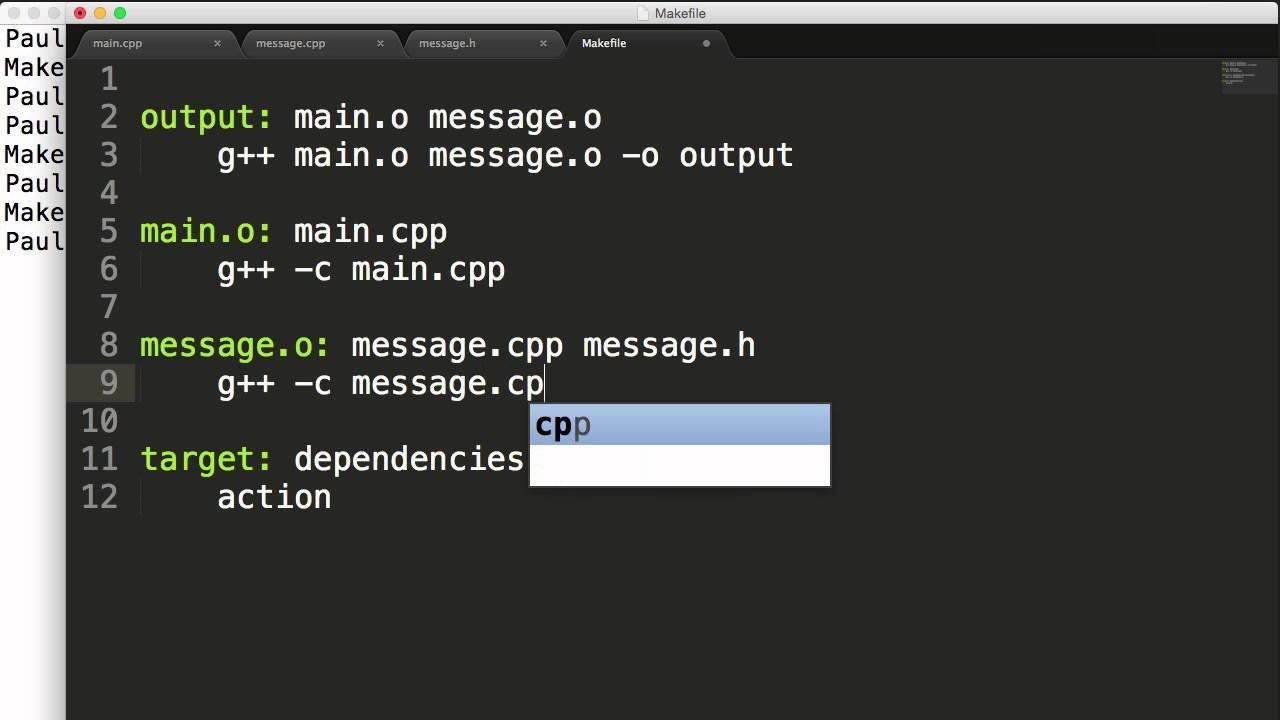
How do multiple source files become a single executable?
ELF file formats:
- Executable file
- Shared Object file
- Relocatable file
- and some others
- Executable: specifies how to load the program into a process image (remember exec and forking?)
- Relocatable: specifies how to include it's own code and data into an Executable or Shared object. Object files waiting to be included.
- Shared Object: Dynamic library that links with an executable on load by a linker. Think printf, Libc, stdio.h
How do multiple source files become a single executable?
ELF file formats:
- Executable file
- Shared Object file
- Relocatable file
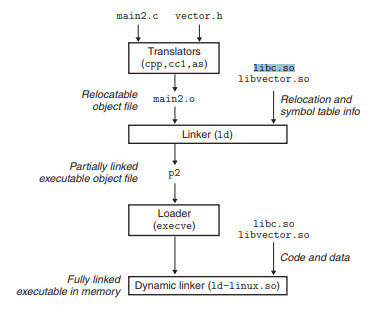
Linker links objects with shared libraries.
These are all aspects of executables known at compile time. Additional conventions become relevant at runtime.
Aspects of the executable runtime context
- What functionality should the OS provide to executables?
- User executables shouldn't need to implement hardware specific functionality
- User executables shouldn't be able to make dangerous changes to the system
- Operating systems satisfy these requirements by distinguishing between two modes of execution
- User mode
- Kernel mode
User Mode vs. Kernel Mode
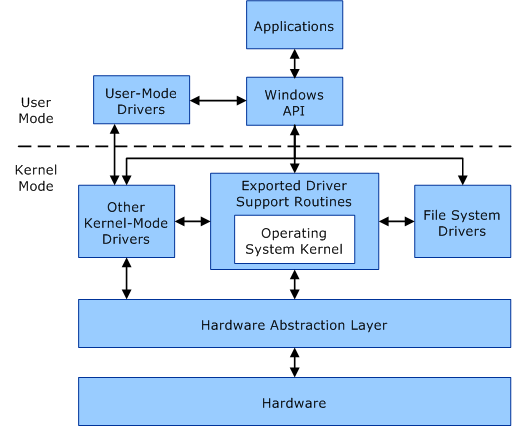
- User-mode is the restricted execution environment provided by the OS
- Kernel mode is a permissive execution mode with closer access to the hardware
- User-mode interacts with the OS through an API
Library Calls
- Implementation provided by a dynamic library (shared object)
- Examples include printf(), strcpy(), strlen(), and fopen()
- May be portable (cross-platform)
- May be included with the operating system or provided by a user
System Calls
- Implemented by the operating system (usually)
- Examples include open(), read(), fork(), mmap()
- Temporarily transitions the program from user-mode to kernel-mode
- In practice, system calls are often made through OS-provided libraries
How do executables interact with the operating system?
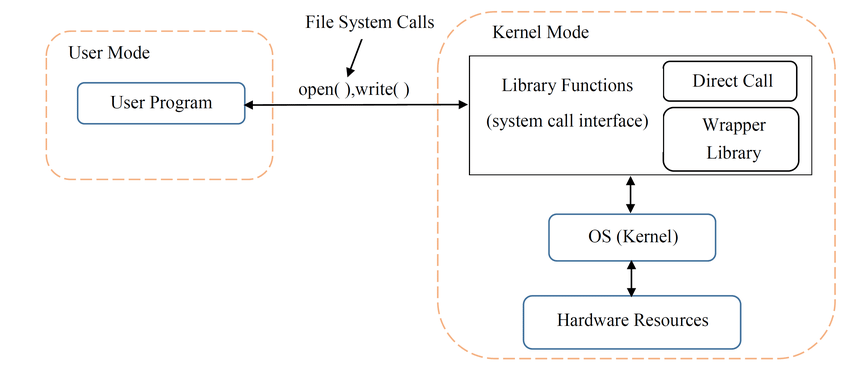
This separation allows the operating system to implement file-system restrictions and similar security measures
Dynamic Analysis
$ man <tool name>
...
$ strace <filename>
$ ltrace <filename>
To quickly understand an executable's behavior, we can monitor these library and system calls
strace will capture system calls, and ltrace will capture library calls
Lab 1
Calling Conventions
Calling Convention Aspects
-
Argument Passing: How are arguments passed between functions? On the stack? In registers? Which registers?
-
Return Values: How are values returned from functions? On the stack? In registers? Which registers?
- Stack Management: How is the stack referenced, grown, and shrunk?
- Register Saving: Which registers are caller-saved vs. callee saved?
API vs. ABI
Why must we save registers?
int *foo(c,d) {
    char e;
    void *yeet = malloc(sizeof(c)*d);
    /* Stop! */
    return (int *)yeet;
}

int main(int argc, char *argv[]) {
    int a = 5;
    int b = 7;
    char *bar = foo(a,b);

    return 0;
}
foo:
push ebp
mov ebp, esp
sub esp, 8 ;make room
mov ecx, [ebp + 4] ;get c
mov edx, [ebp + 8] ;get d
mov eax, 4 ;sizeof(int)
mul edx ;sizeof(int)*d
push eax ;arg to malloc
call malloc
add esp, 4 ;clean up arg
mov [esp], eax ;store in yeet
add esp, 8 ;clean up locals
pop ebp
ret
main:
push ebp
mov ebp, esp
push 5 ;a
push 7 ;b
sub esp, 4 ;bar
mov eax, [esp + 4] ;get b
mov ebx, [esp + 8] ;get a
push ebx ;d
push eax ;c
call foo
add esp, 8 ;clean up args
mov [esp], eax ;store in bar
add esp, 12 ;clean up locals
mov eax, 0 ;return 0
pop ebp
retText
| Feature | x86 | x86_64 | ARM |
|---|---|---|---|
| Name | cdecl, stdcall | System V, Microsoft x64 | AAPCS64 |
| Arguments | Pushed onto stack (reverse order) | First 6 arguments in registers: RDI, RSI, RDX, RCX, R8, R9 (others on stack) | First 8 arguments in registers: X0-X7 (others on stack) |
| Return Value | EAX (integers) ST0 (floating point) |
RAX (integers) XMM0 (floating point) |
X0 |
| Stack Alignment | 4-byte aligned | 16-byte aligned | 16-byte aligned |
| Stack Growth | Downward | Downward | Downward |
| Caller-Saved Registers | Others | RAX, RCX, RDX, R8, R9, R10, R11 | X19–X28, FP (frame pointer), LR (link register) |
| Callee-Saved Registers | EBX, EBP, ESI, EDI | RBX, RBP, RDI, RSI, RSP, R12, R13, R14, and R15, XMM0–XMM5 | X0–X7, X9–X18 |
Comparing Conventions
x86 vs. x86_64
sum_two_numbers:
    push ebp                       ; Save base pointer
    mov ebp, esp                   ; Set stack frame

    mov eax, [ebp+8]               ; Get first argument (from stack)
    mov ebx, [ebp+12]              ; Get second argument (from stack)
    add eax, ebx                   ; Compute the sum

    pop ebp                        ; Restore base pointer
    ret                            ; Return to the caller

_start:
    push dword 5                   ; Push the second argument (5) on the stack
    push dword 10                  ; Push the first argument (10) on the stack
    call sum_two_numbers           ; Call the function to sum 10 and 5
    add esp, 8                     ; Clean up the stack (remove arguments)

    ; Print result using printf
    push eax                       ; Push result (in EAX) to the stack for printf
    push msg                       ; Push message format string for printf
    call printf                    ; Call printf
    add esp, 8                     ; Clean up the stack (remove arguments)

    ; Exit program
    mov eax, 1                     ; Syscall number for exit
    xor ebx, ebx                   ; Exit code 0
    int 0x80                       ; Call kernel
sum_two_numbers:
    mov rax, rdi                   ; First argument (in RDI)
    add rax, rsi                   ; Second argument (in RSI)
    ret                            ; Return result in RAX

_start:
    mov rdi, 10                    ; Move first argument (10) into RDI
    mov rsi, 5                     ; Move second argument (5) into RSI
    call sum_two_numbers           ; Call the function to sum 10 and 5

    ; Print result using printf
    mov rsi, rax                   ; Move result (in RAX) to RSI for printf
    mov rdi, msg                   ; Move message format string to RDI
    xor rax, rax                   ; Clear RAX (for printf's variadic convention)
    call printf                    ; Call printf

    ; Exit program
    mov rax, 60                    ; Syscall number for exit (in 64-bit)
    xor rdi, rdi                   ; Exit code 0
    syscall                        ; Call kernel
Questions?
Dynamic Analysis
(GDB)
Dynamic Analysis
- Sometimes execution monitoring is not enough
- May not contain enough information about program behavior
- Likely not detailed enough for vulnerability analysis or program exploitation
- Malicious programs might obfuscate their behavior or use other measures to evade monitoring
- To get a granular view into program execution, we must use a debugger (GDB, WinDBG, x64dbg, etc)
Enter GDB-GEF
GDB but with enhancements for reverse engineering
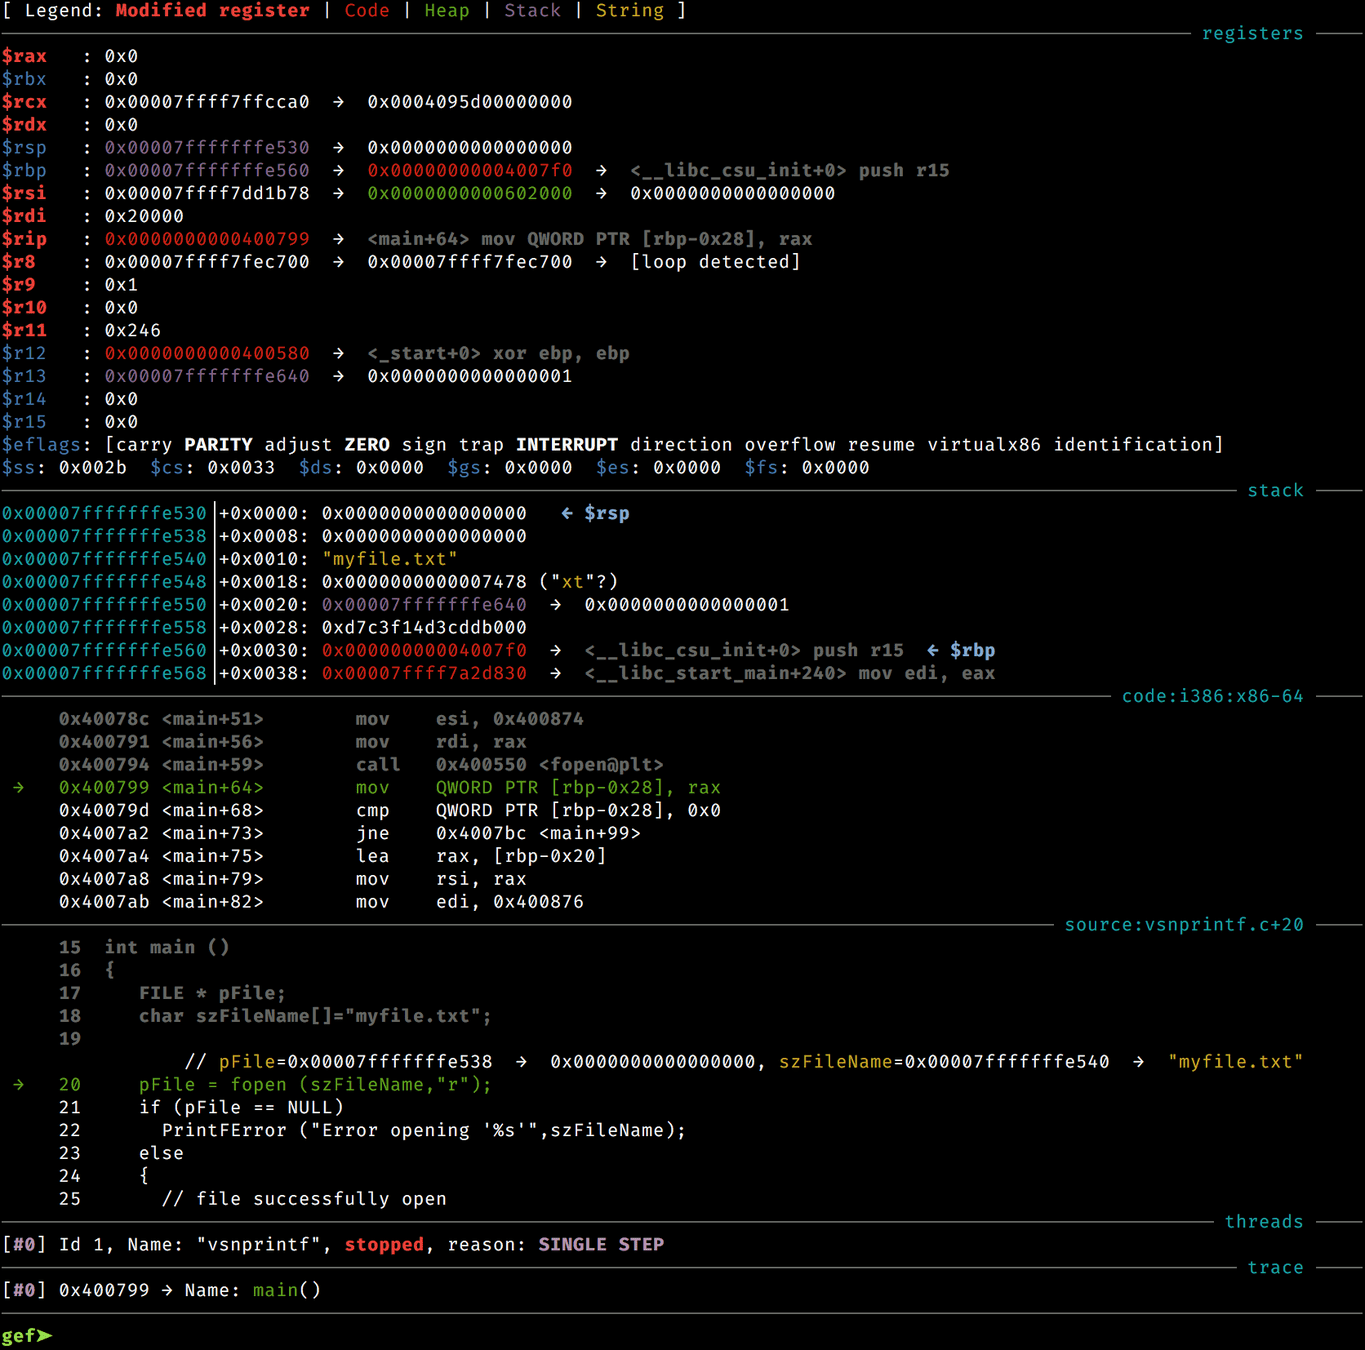
Demonstration
GDB-GEF Cheat Sheet
| run or r | Start program execution. |
|---|---|
break or b <location>
|
Set a breakpoint at a function or line number. |
nexti or ni
|
Step over the current instruction (do not step into functions). |
stepi or si
|
Step into the current instruction or function. |
print or p <expr>
|
Print the value of an expression or variable. |
context |
Display a detailed context view (registers, stack, source, etc.). |
heap chunks |
Display all heap chunks in memory. |
info registers or i r
|
Show the values of all CPU registers. |
disassemble or disas
|
Disassemble the current function. |
x/<n><fmt> <address> |
Examine memory at the given address. |
gef memory |
Display memory mappings of the process. |