BEE Group- Building Energy and Environment
Innovation Unit of CIMNE


- BEEGroup is an innovation unit of the International Center for Numerical Methods in Engineering (CIMNE) involving over 25 researchers.
-
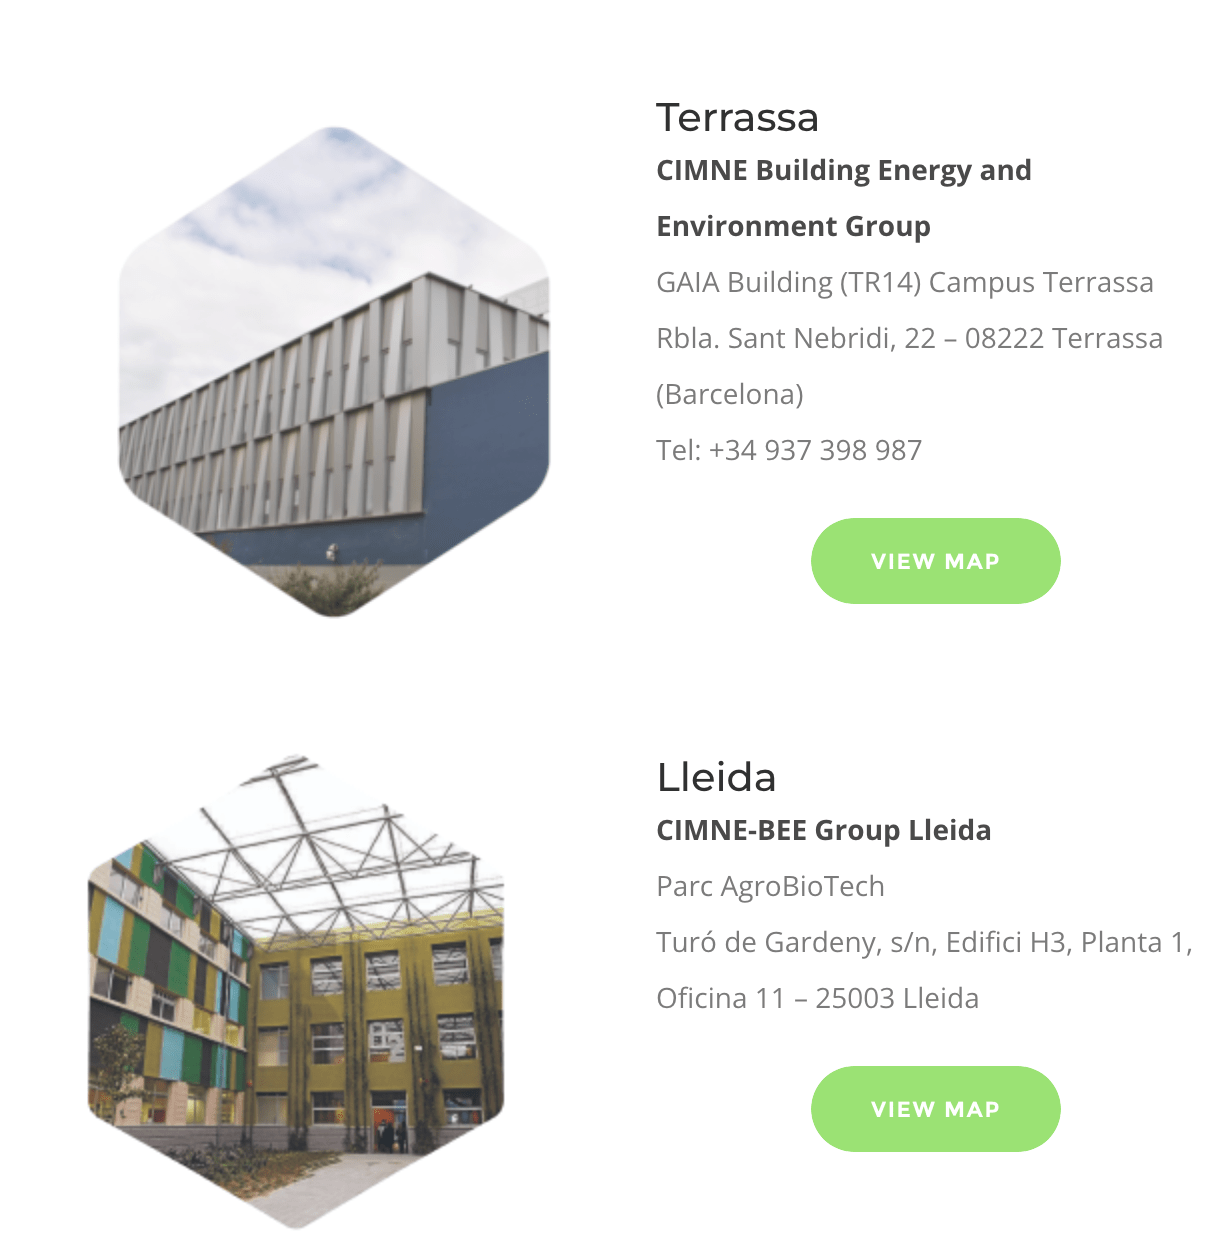
It was founded in 2001 and has two main offices, one in the GAIA building of the UPC Campus in Terrassa and the other one in the Agrobiotech Park in Lleida.
About
Building Energy and Environment - BEE Group
Data driven intelligence
BEE Group leads innovative solutions for decarbonizing buildings and enhancing the climate resilience of cities through data-driven methodologies
Team, vision & mission
At BEE Group, we develop intelligent systems for the design and management of large building portfolios and urban districts, offering agile responses to:
-
🌡️ Climate emergency adaptation
-
🏙️ Decarbonization of buildings and cities
Mission
We make energy, climate, urban, and geographic data more useful and accessible to professionals and companies by:
-
Reducing management and energy costs
-
Increasing applicability and reliability
-
Applying AI-powered analytics
-
Developing personalized energy tools, user interfaces, and mobile applications
We bring energy data closer to building users in a friendly and intuitive way, selecting the most relevant information to enable personalized control of their experience.
High level professionals
— including experienced engineers, data scientists, and emerging young talents — working in:
-
🧠 Expertise in building systems, energy analytics, AI, and data engineering
-
🌍 Commitment to climate action and environmental impact
-
💡 Innovation with open-source technologies and European collaboration
-
🤝 A team culture built on diversity, gender equality, and public service
An enthusiastic, forward-thinking team dedicated to developing digital solutions for a more sustainable and resilient future.
More than 25 professionals
Team
Awarded young researchers
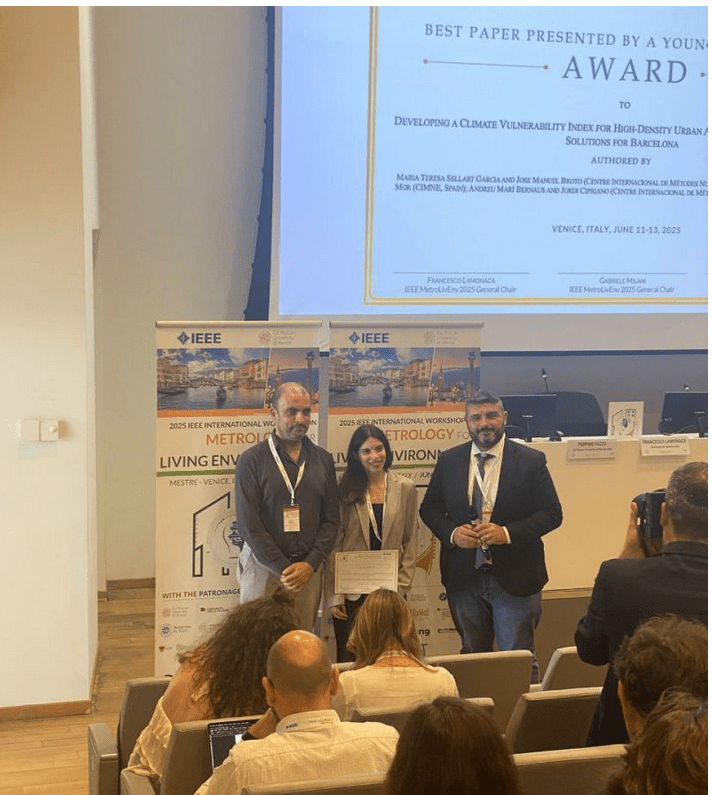
Maite Sellart: 𝗕𝗲𝘀𝘁 𝗣𝗮𝗽𝗲𝗿 𝗯𝘆 𝗮 𝗬𝗼𝘂𝗻𝗴 𝗥𝗲𝘀𝗲𝗮𝗿𝗰𝗵𝗲𝗿 at the hashtag #MetroLivEnv 2025
Research lines
Smarter distributed energy resources and flexibility
- Enhance energy flexibility with predictive control and optimized storage in smart buildings and grids
Big data analytics for energy efficiency and operation in buildings
-
Developing data-driven processing and models to improve the management and decarbonization of large building portfolios
Research lines
Energy transition and climate adaptation in cities & communities
- Geospatial artificial intelligence (GeoAI) to build a more resilient future for cities with accelerated spatial problem-solving
Low-cost biodigester technology
-
Development of low-cost digesters as a widespread biogas technology for various climates.


GitHub
Journals and congress publications
PhD thesis
Master and degree thesis
Academic research
50 papers accepted in indexed international journals in the last 5 years
8 Phd theses in progress in the last 5 years
2 Phd theses defended in the last 5 years
40 oral presentations in international congresses in the last 5 years
3 degree theses in progress
5 Master theses defended in the last 5 years
3 Degree theses defended in the last 5 years
Research projects
BEE Group
Ongoing European Projects
BEE Group is involved in 11 EU research project (3 coord). It is also involved in 4 national funded research projects:
-
BlueBird (2024–2027) Flexibility market design and trading for smart buildings. Involves TSO/DSO coordination.
-
CELINE (2024–2027) Digital ecosystem for energy communities, with AI assistant for collective actions.
-
Climate‑Ready Barcelona (2023–2025) Climate Vulnerability Index (CVI) for 61,000+ buildings and public-facing energy advice services.
-
CLIMRES (2024–2027) Tools to assess and improve climate resilience of buildings and cities.
Vanguard Innovation
-
EKATE+ (2024–2026) Cross-border renewable energy communities (Spain–France) with digital twins and electromobility.
-
AGROPURITECH (2023–2026) Valorization of pig slurry via low-cost anaerobic digestion.
-
COSMIC (2024–2027) Large-scale pilots to demonstrate how big data and AI can optimize energy resources
-
DEDALUS (2023–2026) Participatory demand response from households to districts using AI and social sciences.


BEE Group
Historic Projects
- BIGG (2020–2023) Big data platform for 4,000+ buildings: semantic harmonization, KPI generation, and analytics.
- EN-TRACK (2020–2023) Centralized tracking and benchmarking of energy efficiency across Europe.
- ePLANET (2021–2024) Local government networks for energy transition planning in Catalonia, Crete, and Czechia.
- EMPOWERING (2013–2016) big data to empower electricity clients
- EKATE (2019–2022) Shared photovoltaic self-consumption for cross-border areas using IoT and blockchain.
- SIM4BLOCKS (2016–2020) Real-time demand-side management in residential blocks.
BEE Group has participated in 80 research and innovation projects (75 % EU Funded)

BEE Group solutions: BEEMind tools
MindCity
MindOpera


Platform for resilient: buildings and cities 4.0
BEEMind
BEEMind is an AI powered environment that integrates three key pillars:
- Semantic web technologies to make data fully interoperable
- Big data architecture to manage large data volumes, and a set of intelligent tools to analyze and predict
- Optimization of urban environments for energy transition and climate resilience
AI-powered solutions to enhance climate resilience in buildings and urban environments
Platform for resilient: buildings and cities 4.0
BEEMind
-
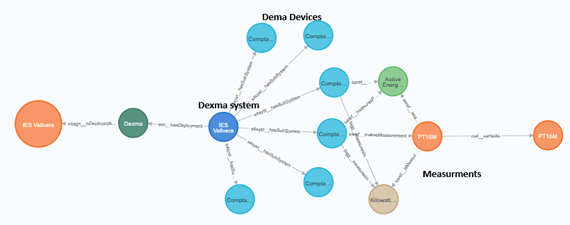
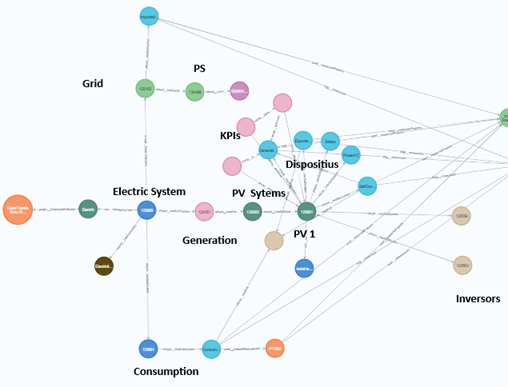
Integration of heterogeneous operational data (consumption and temperature, maintenance orders, energy efficiency measures, RES generation, cadastre, BIM, and SCADA data)
-
Automatic harmonization of records from multiple sources (Modbus, Bacnet, DEXMA, etc.)
-
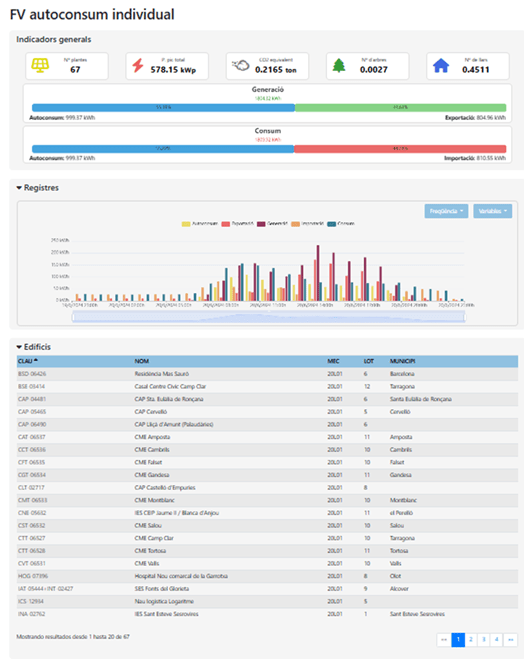
Generation of operational indicators (self-consumption, PR, CO₂ avoided, etc.)
-
Adaptable visualizations for each infrastructure
-
AI modules focused on predictive maintenance, control, and energy optimization
Functionalitalities BEEMind Platform
One Platform two solutions
It is structured around two tools
- MindCIty
- MindOpera
MindCity
BEEMind tools : MindCity
Ciutats 4.0 : high resilient cities in practice
This solution helps municipalities and organizations go digital and manage their data effectively on a local level.
It is a key tool for smart cities, energy planning, adapting to climate change, and making decisions about urban retrofitting
What does it do? It checks out KPIs for buildings and helps planning for energy transition and climate change adaptation:
City microclimate model
Rates how buildings are vulnerable to climate issues
Forecasts energy retrofitting and adaptation strategies
Sends heat wave communications—4 days ahead
Supports designing urban green spaces and shelters
Description
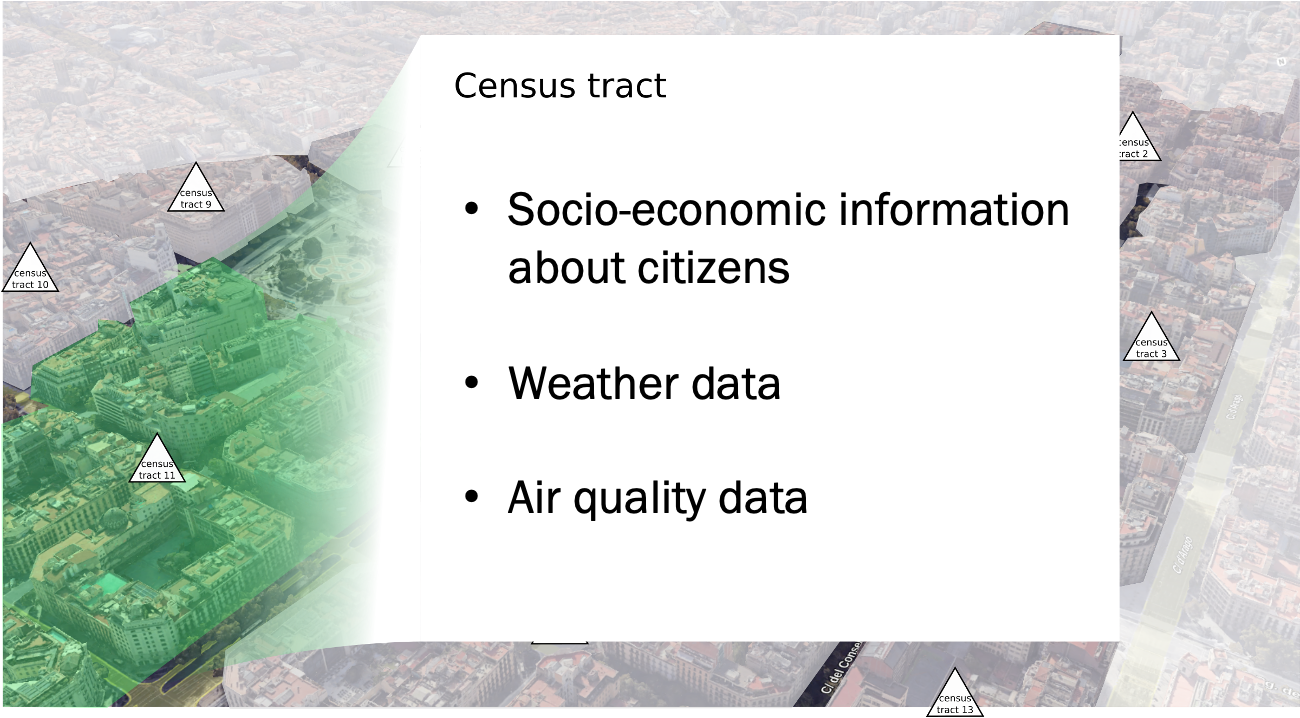
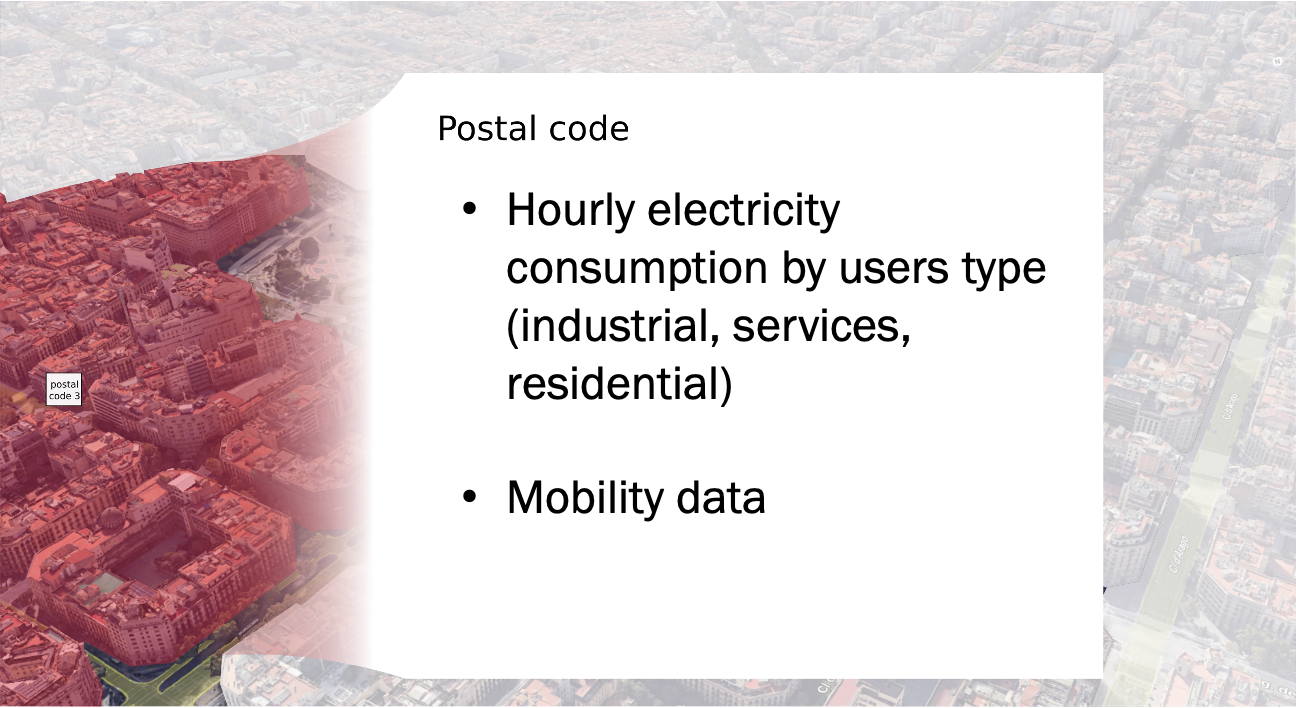
Data integration Across Various Scales
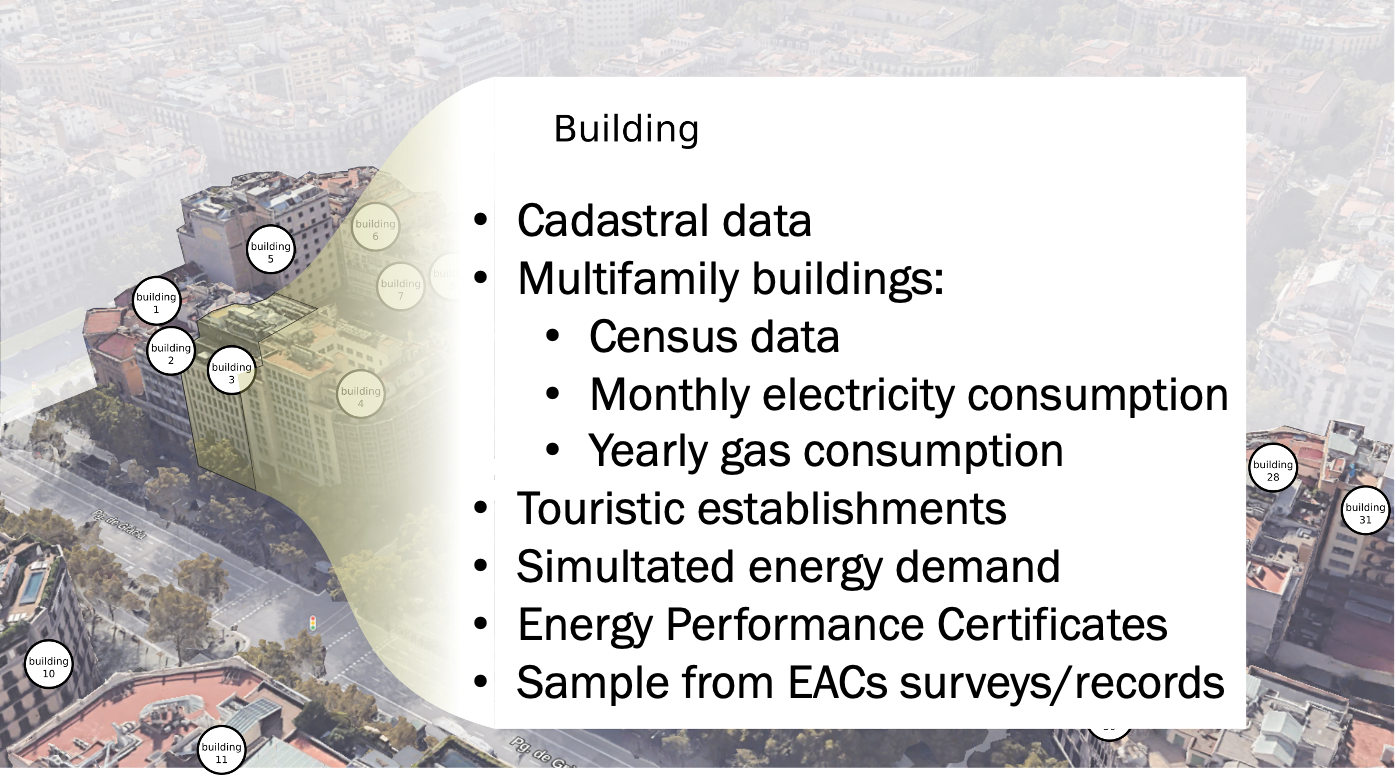
3. Data at building level
2. Data at census code level
1. Data at postal code level
BEEMind tools : MindCity
BEEMind tools : MindCity
Use cases
-
Optimizes resources and processes
For large-scale analysis of geo referenced urban data -
Improves coordination
Between municipal technical departments and citizen interaction -
High scalability
For any city in Spain
-
Climate vulnerability map
Detect vulnerable areas based on large number of KPIs -
Support buildings energy retrofitting
Identify and prioritize buildings with the greatest needs -
Actions to adapt to heat waves
Optimizing climate shelters, better climate communications and greening
Impacts
Cities 4.0: Environmentally Smart
Data sources
MindCity: Data ingestion
Massive data integration
61,000
1 Milion
200.000
Buildings


Households
EPC

10,222
3 Milion
20.000
Zones (microcli-mate model)
KPIs visualized
Heat waves warnings and tips
1,050
Households
MindOpera
BEEMind : MindOpera
Edificis 4.0 : Operativa global d'edificis 4.0
An essential tool for entities managing multiple buildings: standard data orchestration, predictive maintenance, energy efficiency...
Description
Dashboard administració MindOpera
Mind Opera is a modular solution designed for managers of public and private buildings with multiple data sources and operating systems:
harmonizes
Integrate
analyzes
Applying AI models to optimize operations and anticipate incidents.
energy efficiency, maintenance, and generation data in real time
Monitoring and predictive control
Energy optimization
Operació 4.0 d'edificis
-
Modular cloud architecture
-
Automatic aggregation and validation
-
Multi-building supervision
-
Anomaly detection
-
Predictive maintenance
-
Comprehensive equipment monitoring
-
Semantic standardization
-
Real-time intelligence
BEEMind : MindOpera
Cities 4.0: Environmentally Smart
Use cases
-
Centralized management of technical systems
-
Automatic generation of KPIs and operational alerts
-
Continuous monitoring of HVAC, lighting, DHW, and ventilation systems
-
Monitoring of compliance with thresholds of the different records
-
-
Early detection of anomalies in technical systems
-
Identification of inconsistencies in electricity generation/export or device behavior
-
Real-time performance analysis with interpolation and timestamp control
-
Efficient operation through reduced downtime and failure anticipation
Value
Improves service continuity and prevents penalties due to malfunctioning
Managment costs
Connection and quick action for maintenance service
MindOpera
BEEMind tools : MindOpera
-
Monitoring in multi-building or multi-company scenarios
-
Capacity for progressive data growth and aggregated monitoring
-
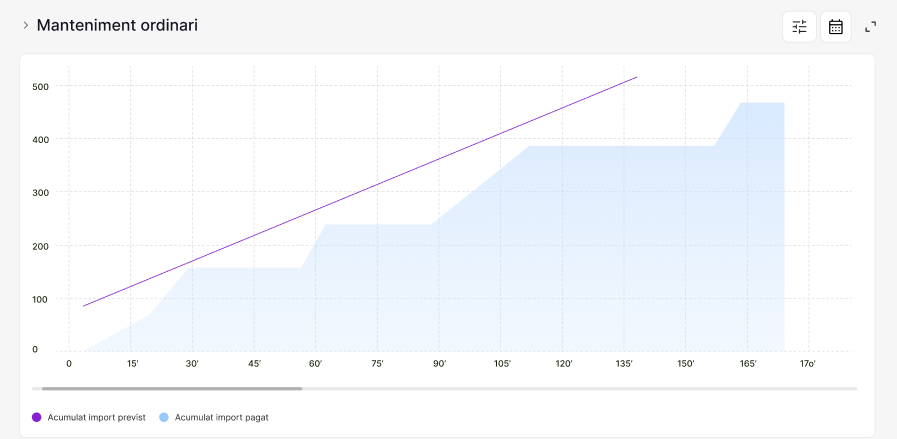
Performance tracing and calculation of KPIs such as PR, CO₂ avoided.
-
-
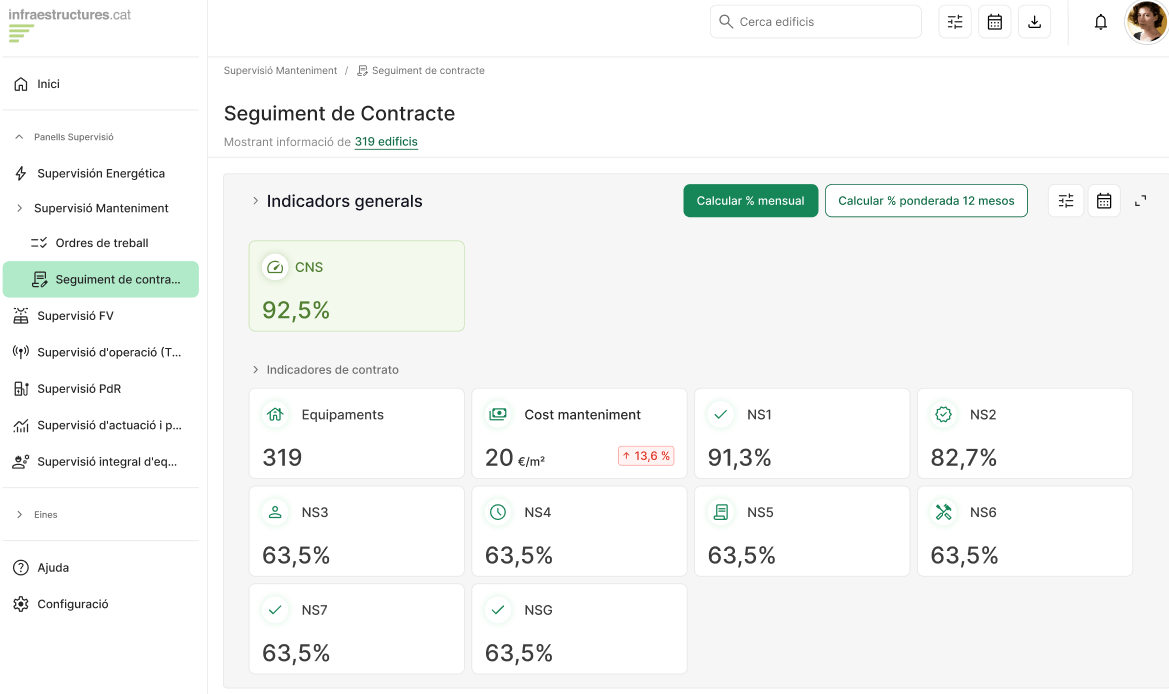
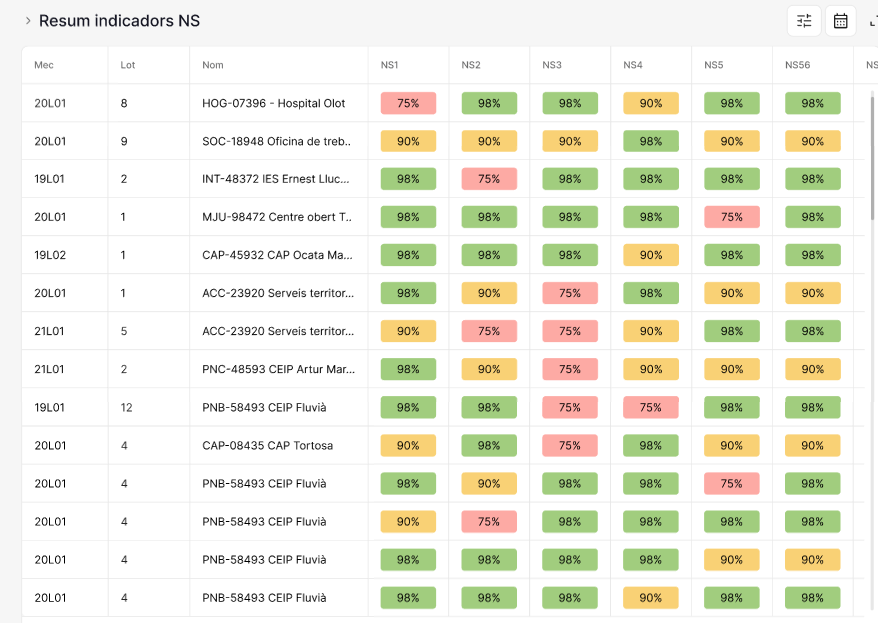
Monitoring and control of contracts or public tenders
- New control aspects of maintenance tenders: presence, energy efficiency, system availability...
- Monitoring of indicators created for contract management
Cities 4.0: Environmentally Smart
Use cases
Value
High scalability
- Integrate assets and sites in phases (plug-and-play with BMS/SCADA/IoT), without redoing integrations each time.
Capex Protection
- Avoids premature replacements of hardware/systems.
- Maximizes production and facilitates the justification of subsidies.
Case studies: iCAT and ICAEN
The Orchestrator of Infraestructures.cat
MindOpera: Data Orchestrator
Deploy a data orchestration infrastructure for public buildings with monitoring and remote-control systems, integrating structural, operational, and energy data.
Infraestructures.cat
Integrator of all equipment data under the direct management of Infraestructures.cat:
-
Real-time data for optimal operation of hundreds of buildings
-
Data provision to diferent internal and external actors. (Energy department, Maintenace department, clients, etc)
-
Predictive maintenance, anomaly detection, consumption and generation forecasting
- Infraestructures.cat
- CIMNE-BEE Group
Actions
Goals
Main actors
Some KPI
Infraestructures.cat
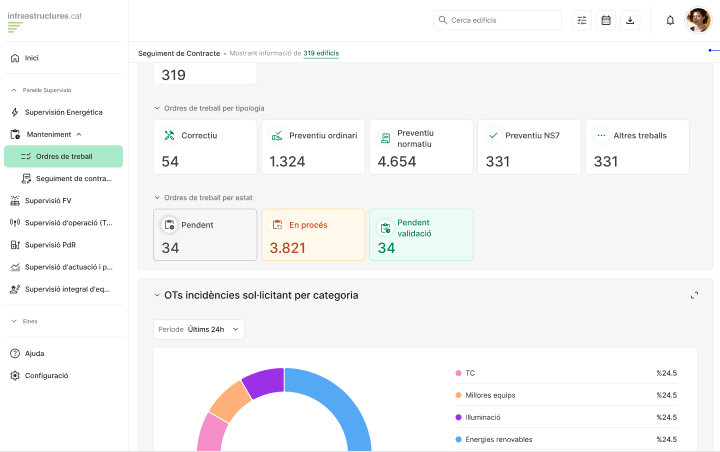
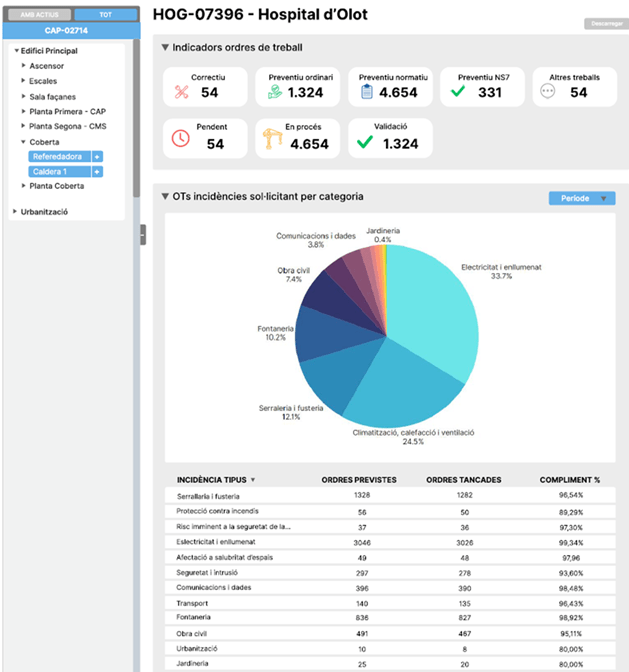
MindOpera currently supports an ecosystem of over 1,000 equipments, including:
-
1,000 with structured maintenance data,
-
Over 40,000 zones and 100,000 digital assets,
-
More than 1 million work orders processed.
-
It integrates data from over 250,000 IoT devices via protocols such as Modbus and BACnet, collecting real-time information from building control systems.
Dashboard administració
MindOpera: Data Orchestrator
MindOpera: Data Orchestrator

Home
Admin Dashboard
MindOpera: Data Orchestrator
The tool
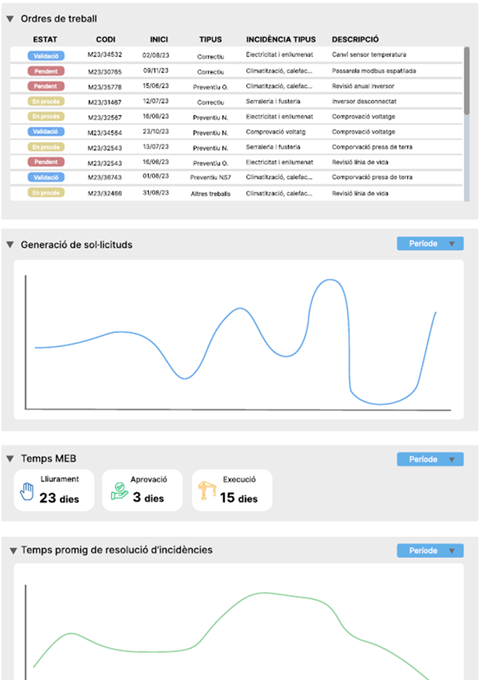
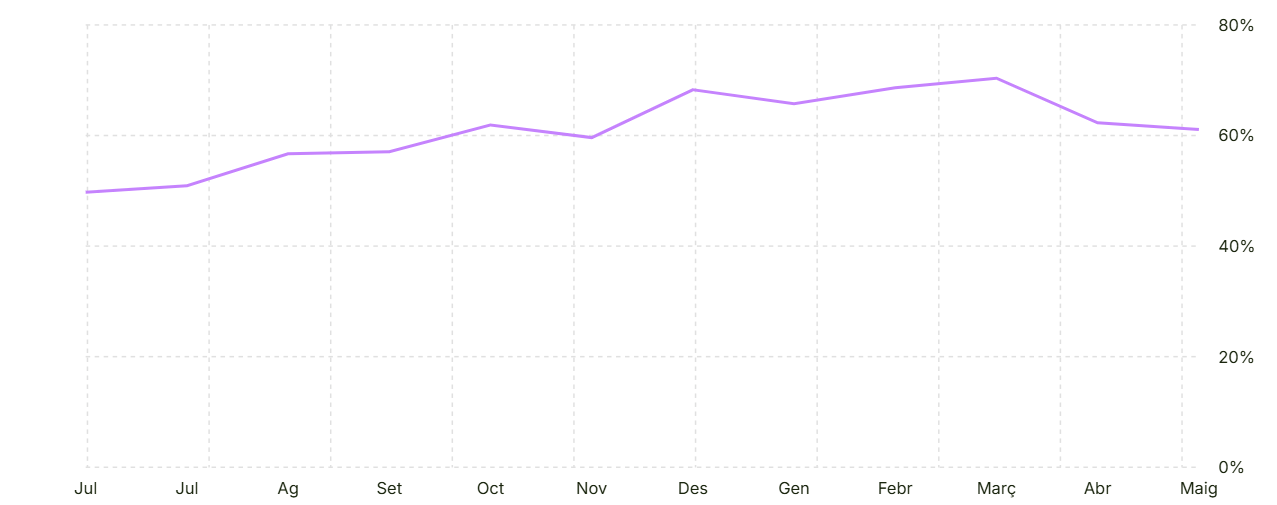
Monitoring: Tracking KPIs
MindOpera: Data Orchestrator
Control and Maintenance

Monitoring: Tracking KPIs
MindOpera: Data Orchestrator
Control and Maintenance
Monitoring: Tracking KPIs
MindOpera: Data Orchestrator
Control and Maintenance
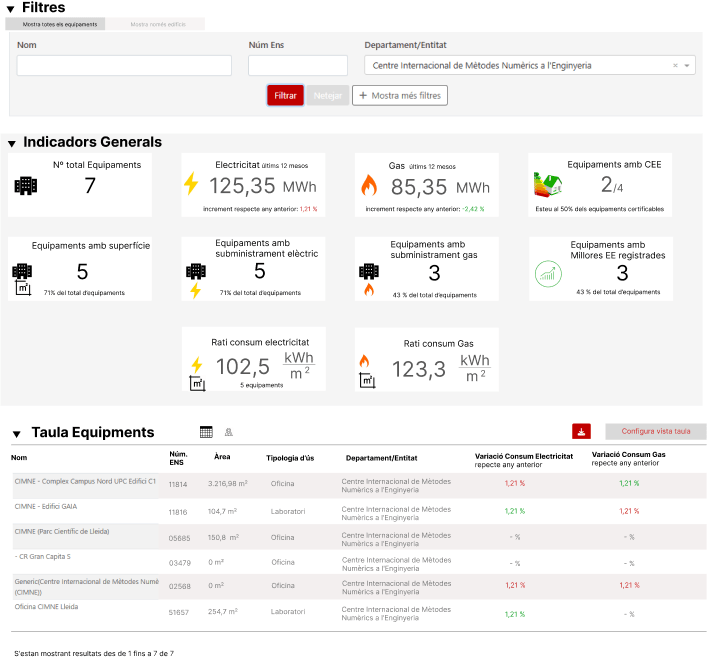
SIME-ICAEN
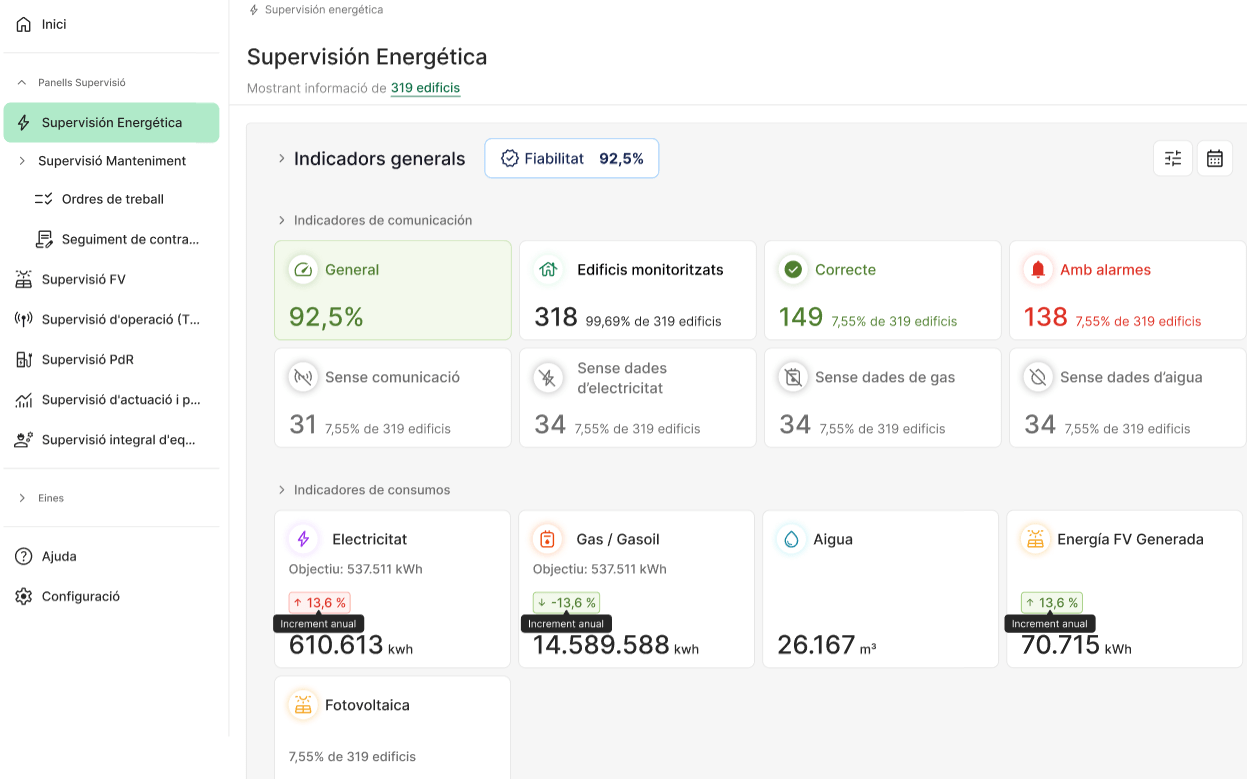
To integrate and visualize the energy data of all Generalitat facilities (10,000) and support energy savings through data intelligence:
-
Comparison of energy indicators
-
Evaluation of the energy performance of each facility
-
Verification of savings from Energy Efficiency Measures
-
Planning of energy efficiency actions
Institut Català d'Energia
The project
MindOpera: Energy Monitoring System – SIME
Seguiment i avaluació del Pla d’Estalvi Energètic dels edificis de la Generalitat de Catalunya.
Goals
Equipment supervision
Monitoring and control of supplies
Monitoring and
control of certificates and audits
Global energy supervision
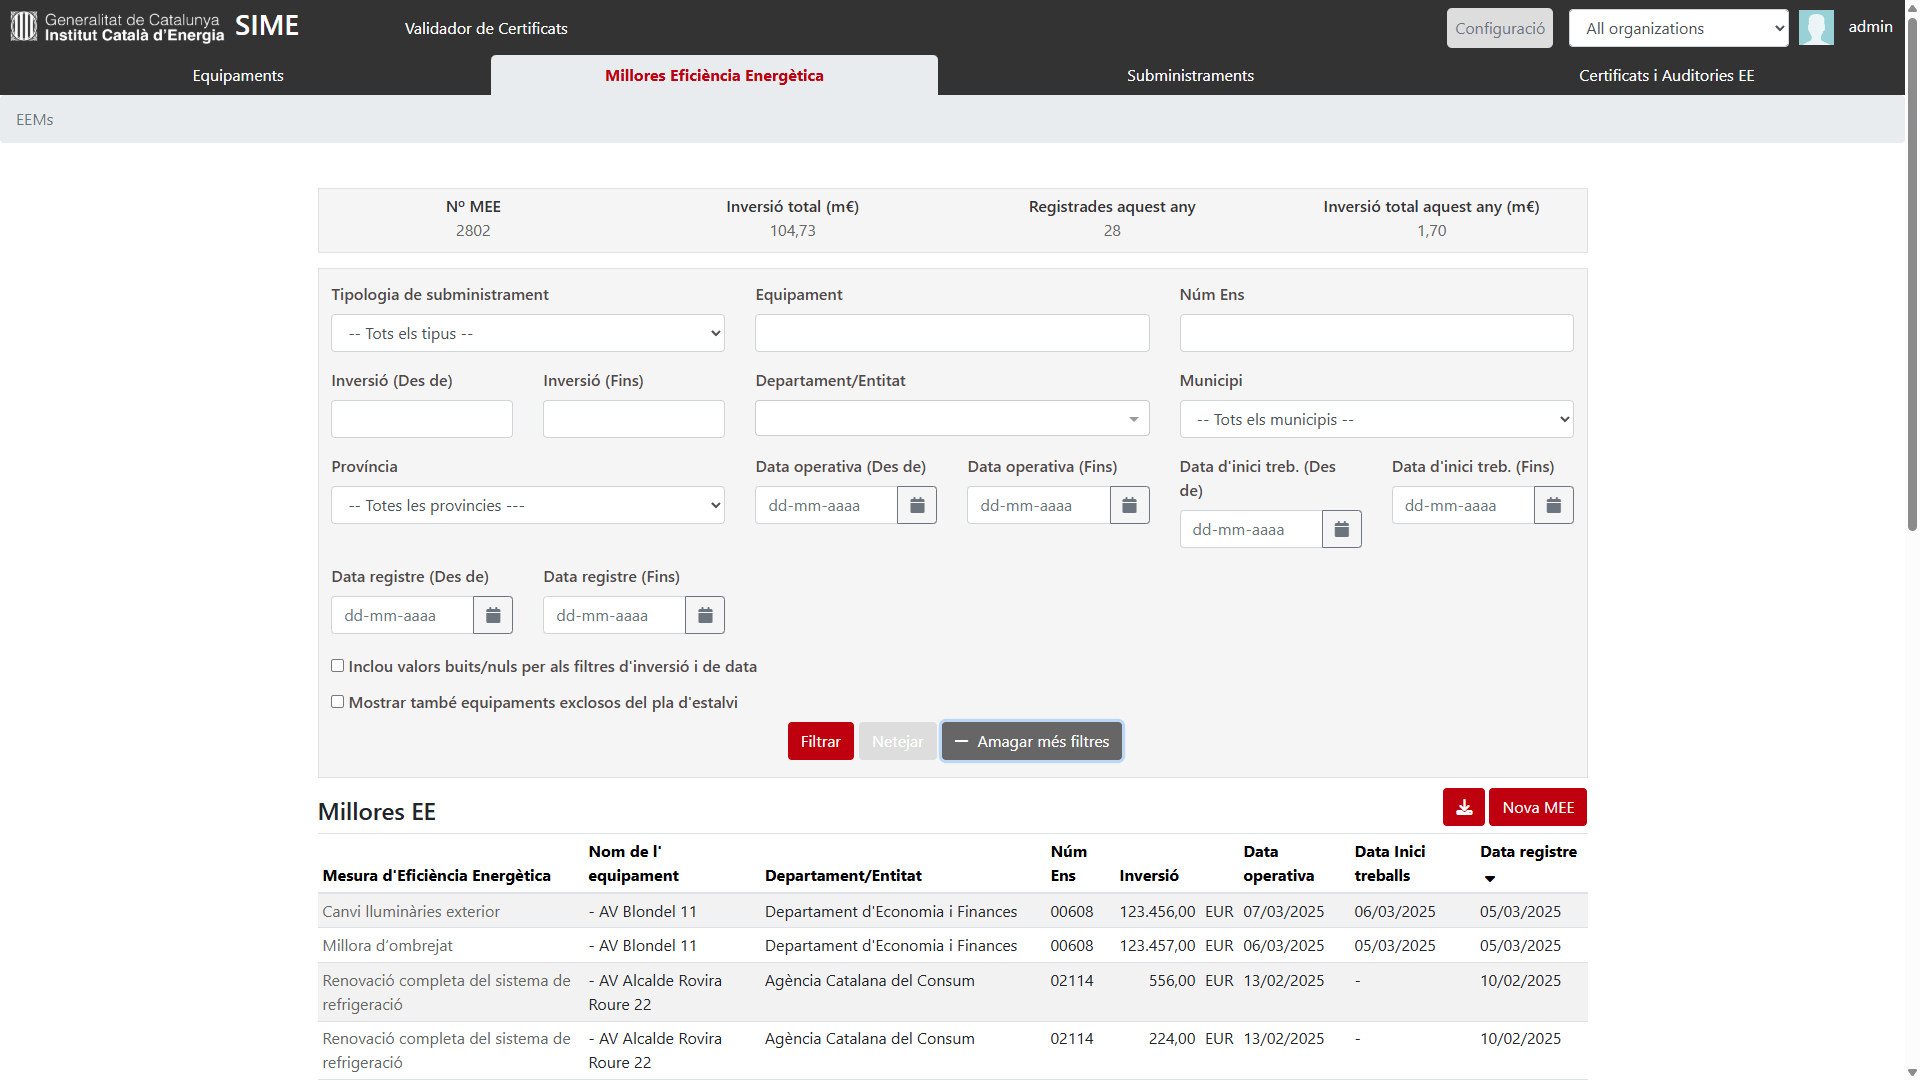
Monitoring of energy efficiency measures
Monitoring of projects and actions
Data provision to external services
Data verification from different sources
Data provision to external services
Massive comparison: Energy benchmarking
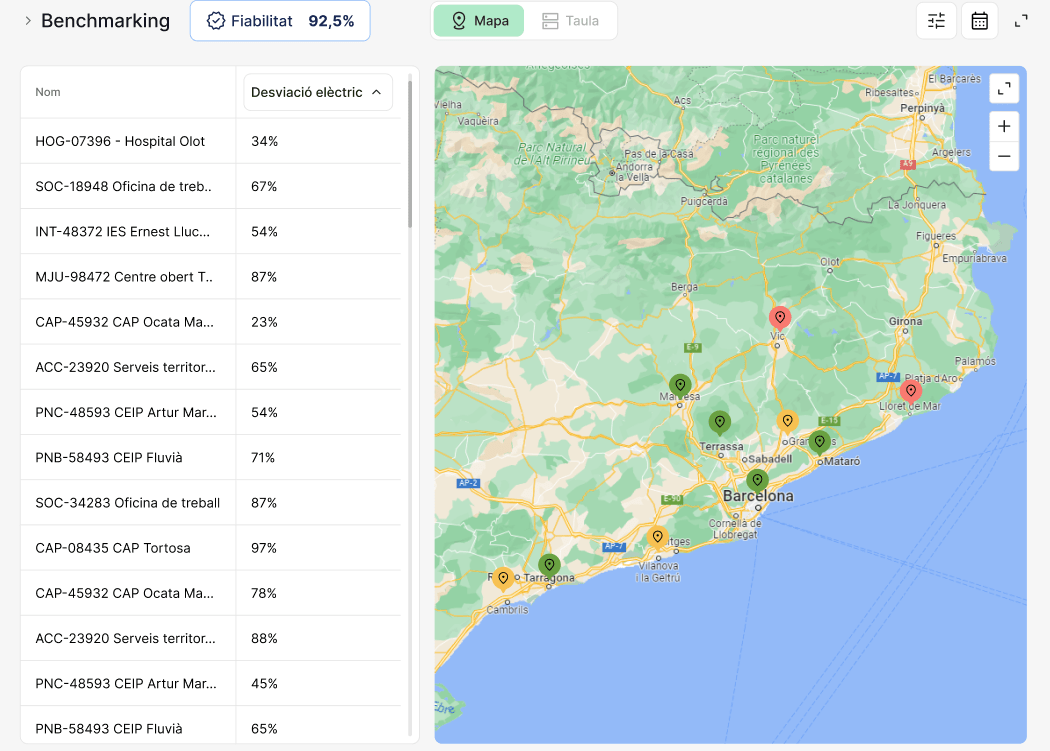
Institut Català d'Energia
MindOpera: SIME
Centralized management
Energy Analytics
Energy Efficiency Measures
Institut Català d'Energia
MindOpera: SIME

Case studies: Aj.Barcelona
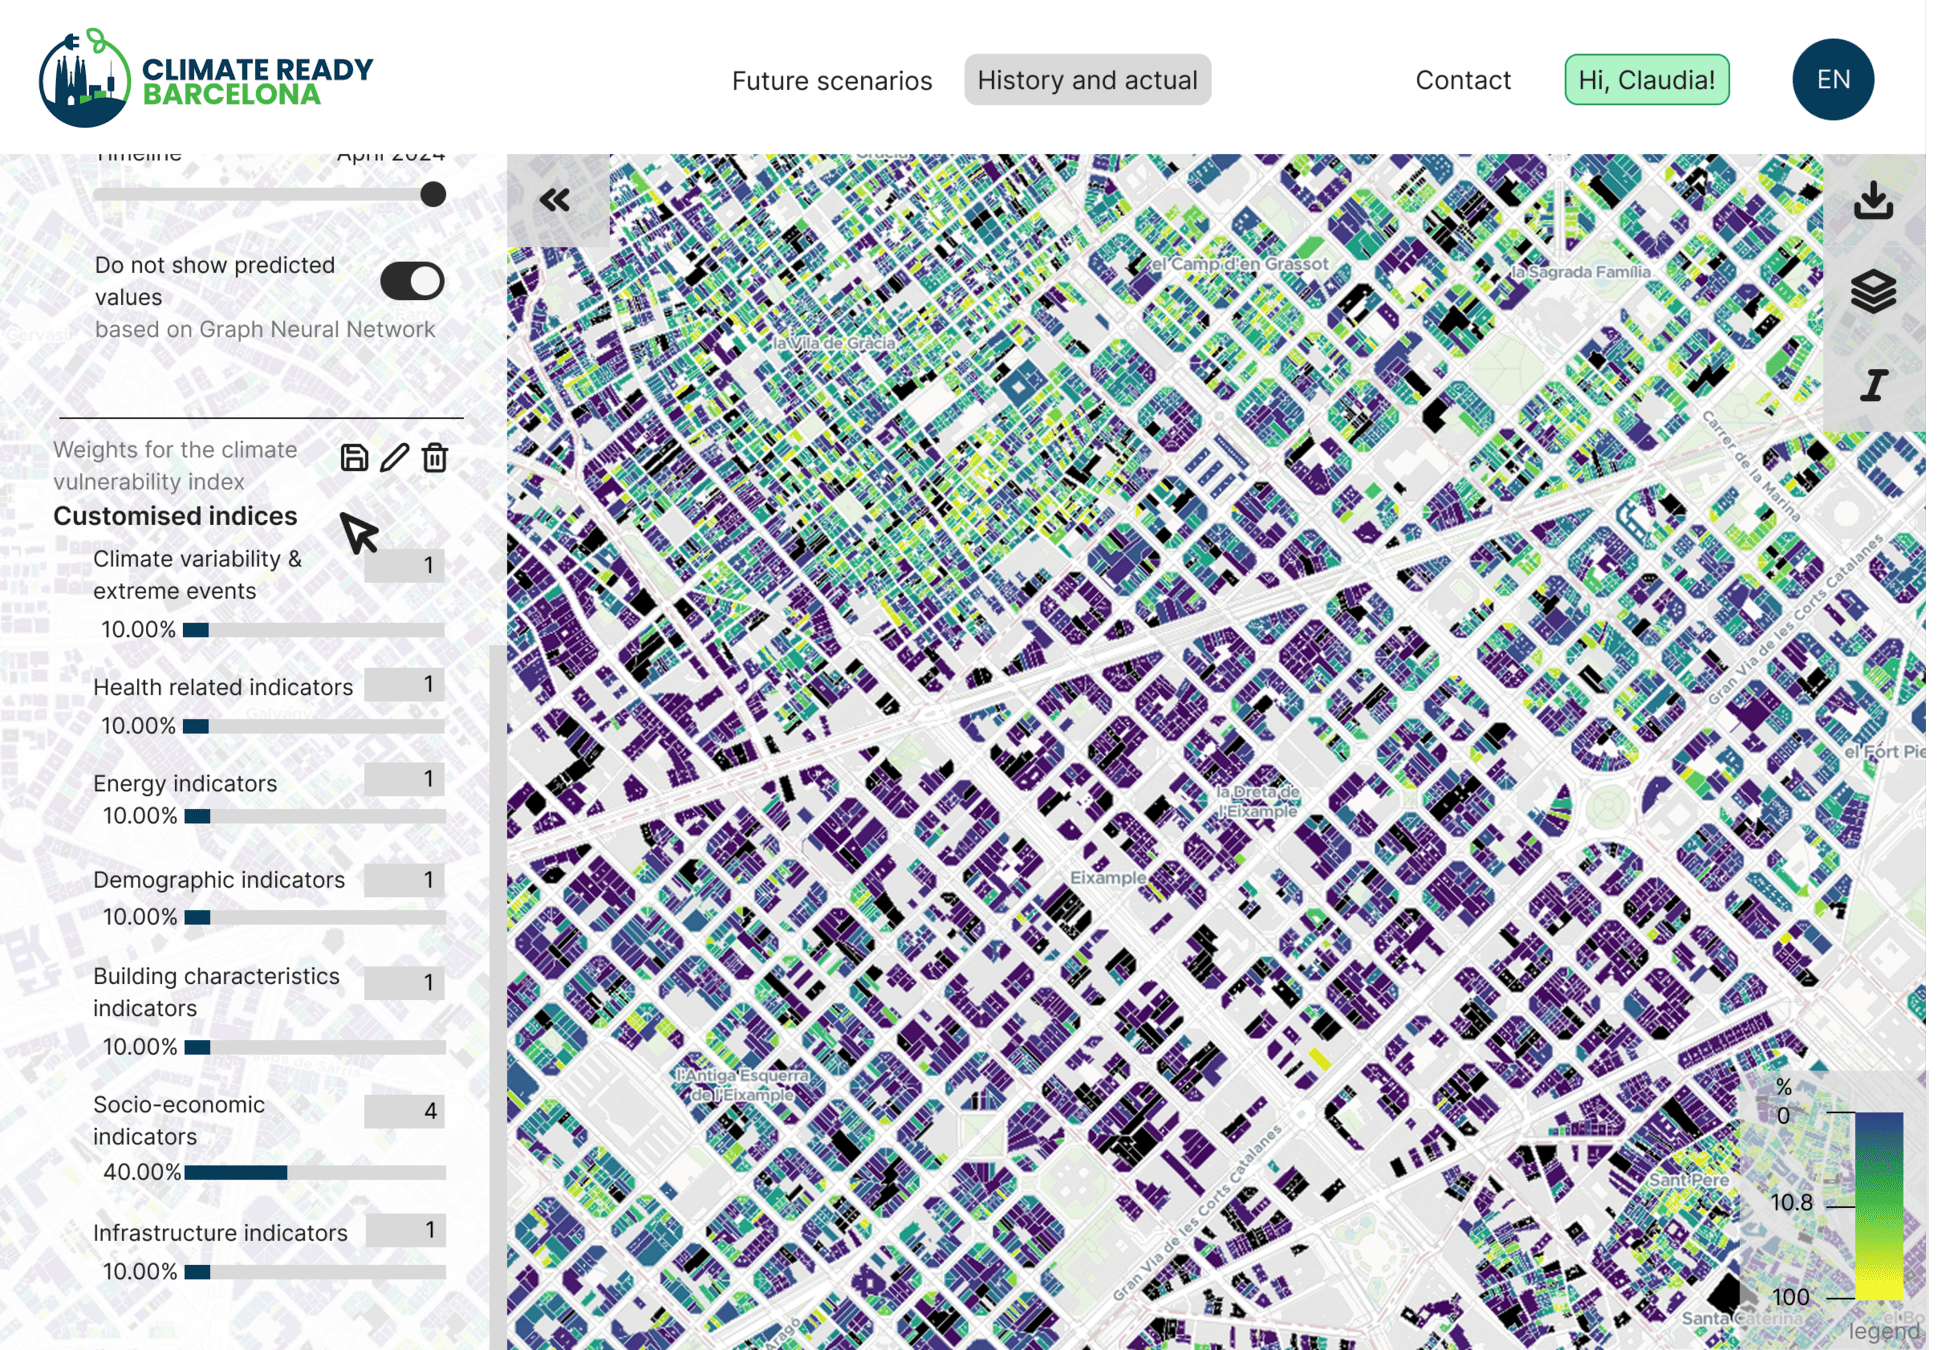
Climate Vulnerability Map of Barcelona
MindCity: Climate-Ready BCN
Aj. Barcelona, ECOSERVEIS
Source: ICLEI Action Fund 2.0
Budget: €1M
Objective: Support citizens and public authorities in adapting to extreme climate events and reducing energy poverty
Implemented: From May 2023 to June 2025


Its goal is to provide precise and up-to-date information for decision-making in urban planning, public policy, climate management, and the protection of the most vulnerable inhabitants.
Aj. Barcelona, ECOSERVEIS
Vulnerability map of Barcelona
-
Vulnerability estimation using AI and energy simulations
-
Export of a large set of socio-economic, energy, cadastral, and climate indicators (KPIs)
MindCity: Climate-Ready BCN
- The Climate Vulnerability Map of Barcelona is a geospatial analysis tool designed to identify the city’s most vulnerable buildings in the event of extreme heat-related events.
- It includes the assessment of all buildings (61,000) against heatwaves.
Main goal
Added value
CVI
How we estimate the Climate Vulnerability Index (CVI)
MindCity: Vulnerability map of Barcelona
Climate vulnerability is typically framed within three key dimensions defined in the IPCC's Third Assessment Report (Intergovernmental Panel on Climate Change) in 2001:
Exposure
Sensitivity
Adaptive capacity
Although most studies classify indicators using these three categories, our index introduces additional levels to provide a more nuanced analysis while remaining aligned with the traditional framework.
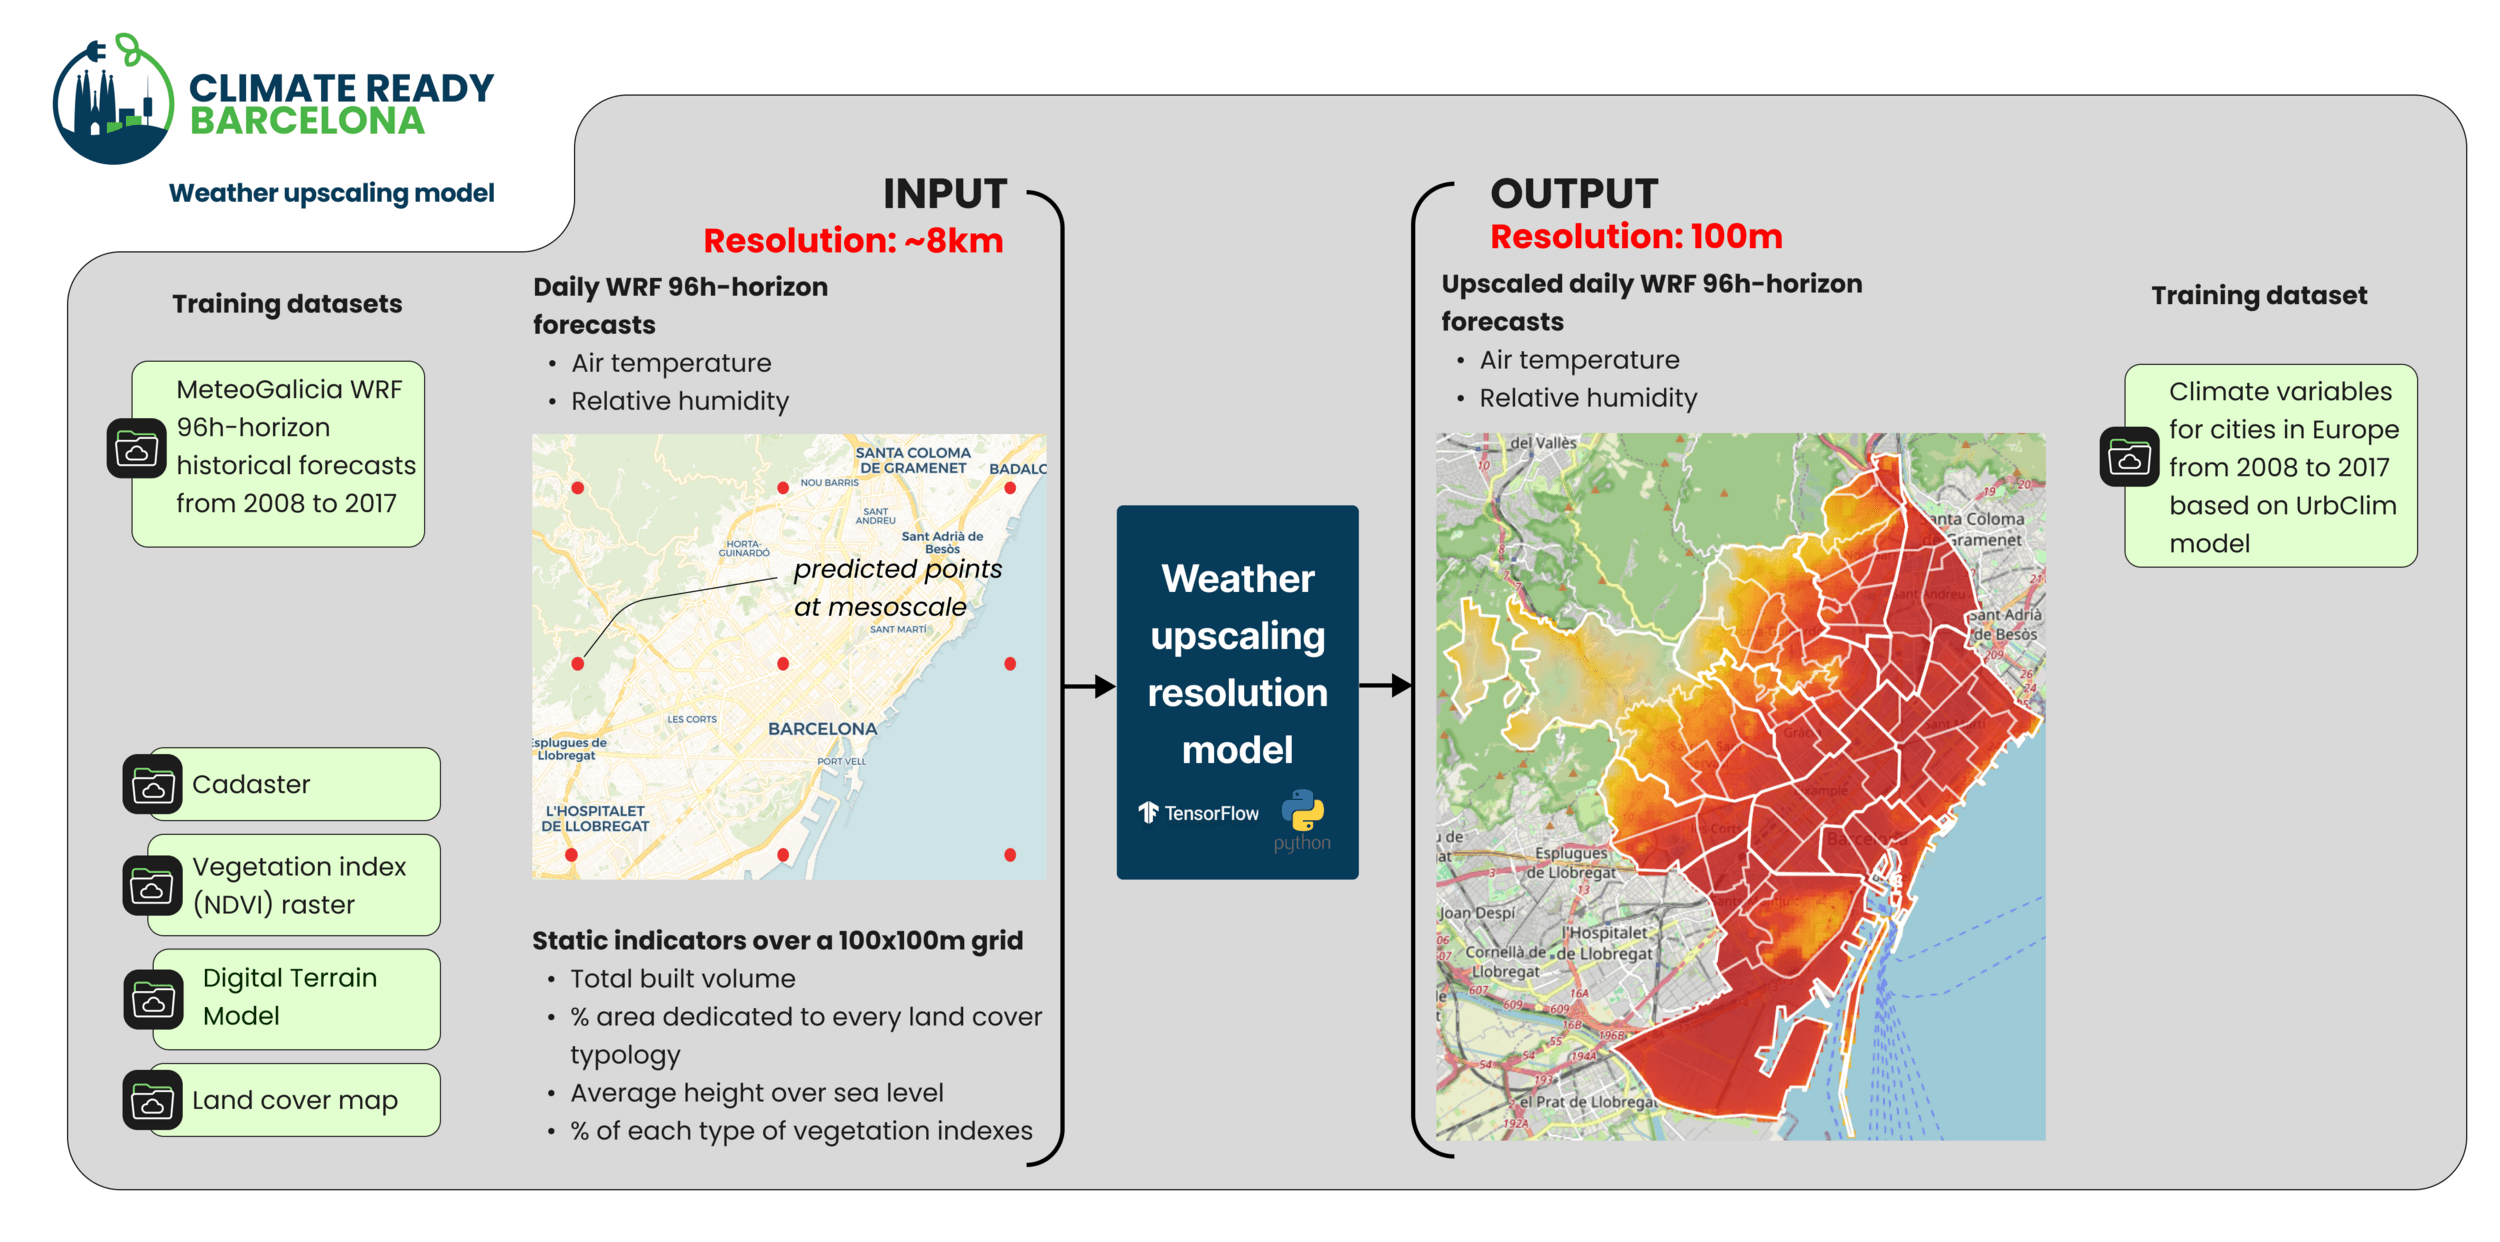
1. Local microclimate model
MindCity: Modelling
Vulnerability map
2. Urban upgrade based on solar shadings
MindCity: Modelling
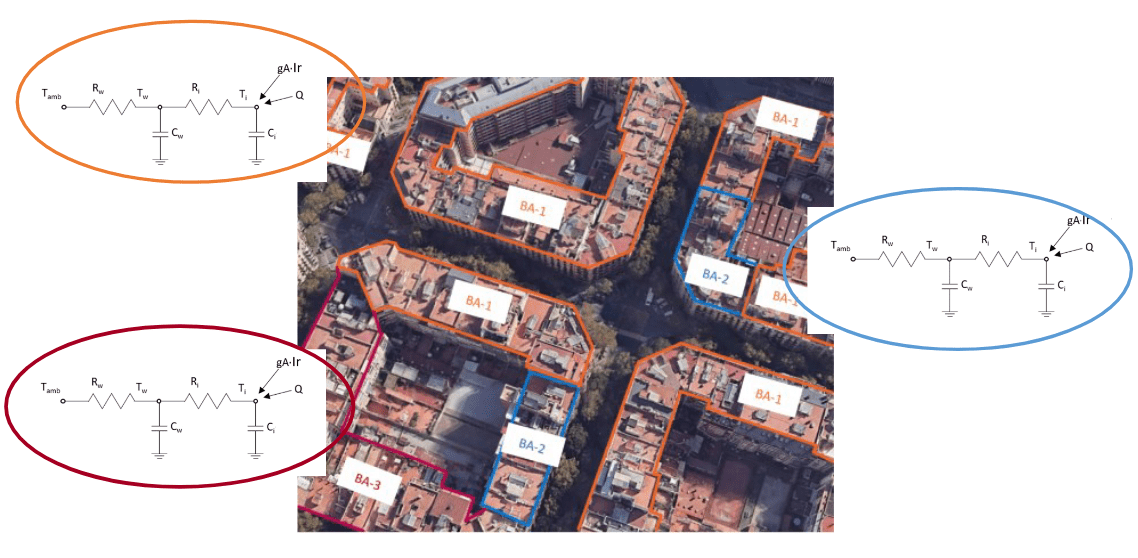
3. Thermal demand models
Simulation of cooling and heating demand based on a Resistor-Capacitor (RC) Model calibrated according to each building’s archetype. The model uses an electrical circuit to simplistically mimic the building’s thermal dynamics.
Vulnerability map
MindCity: Modelling
MindCity: Climate Vulnerability Map Visualization
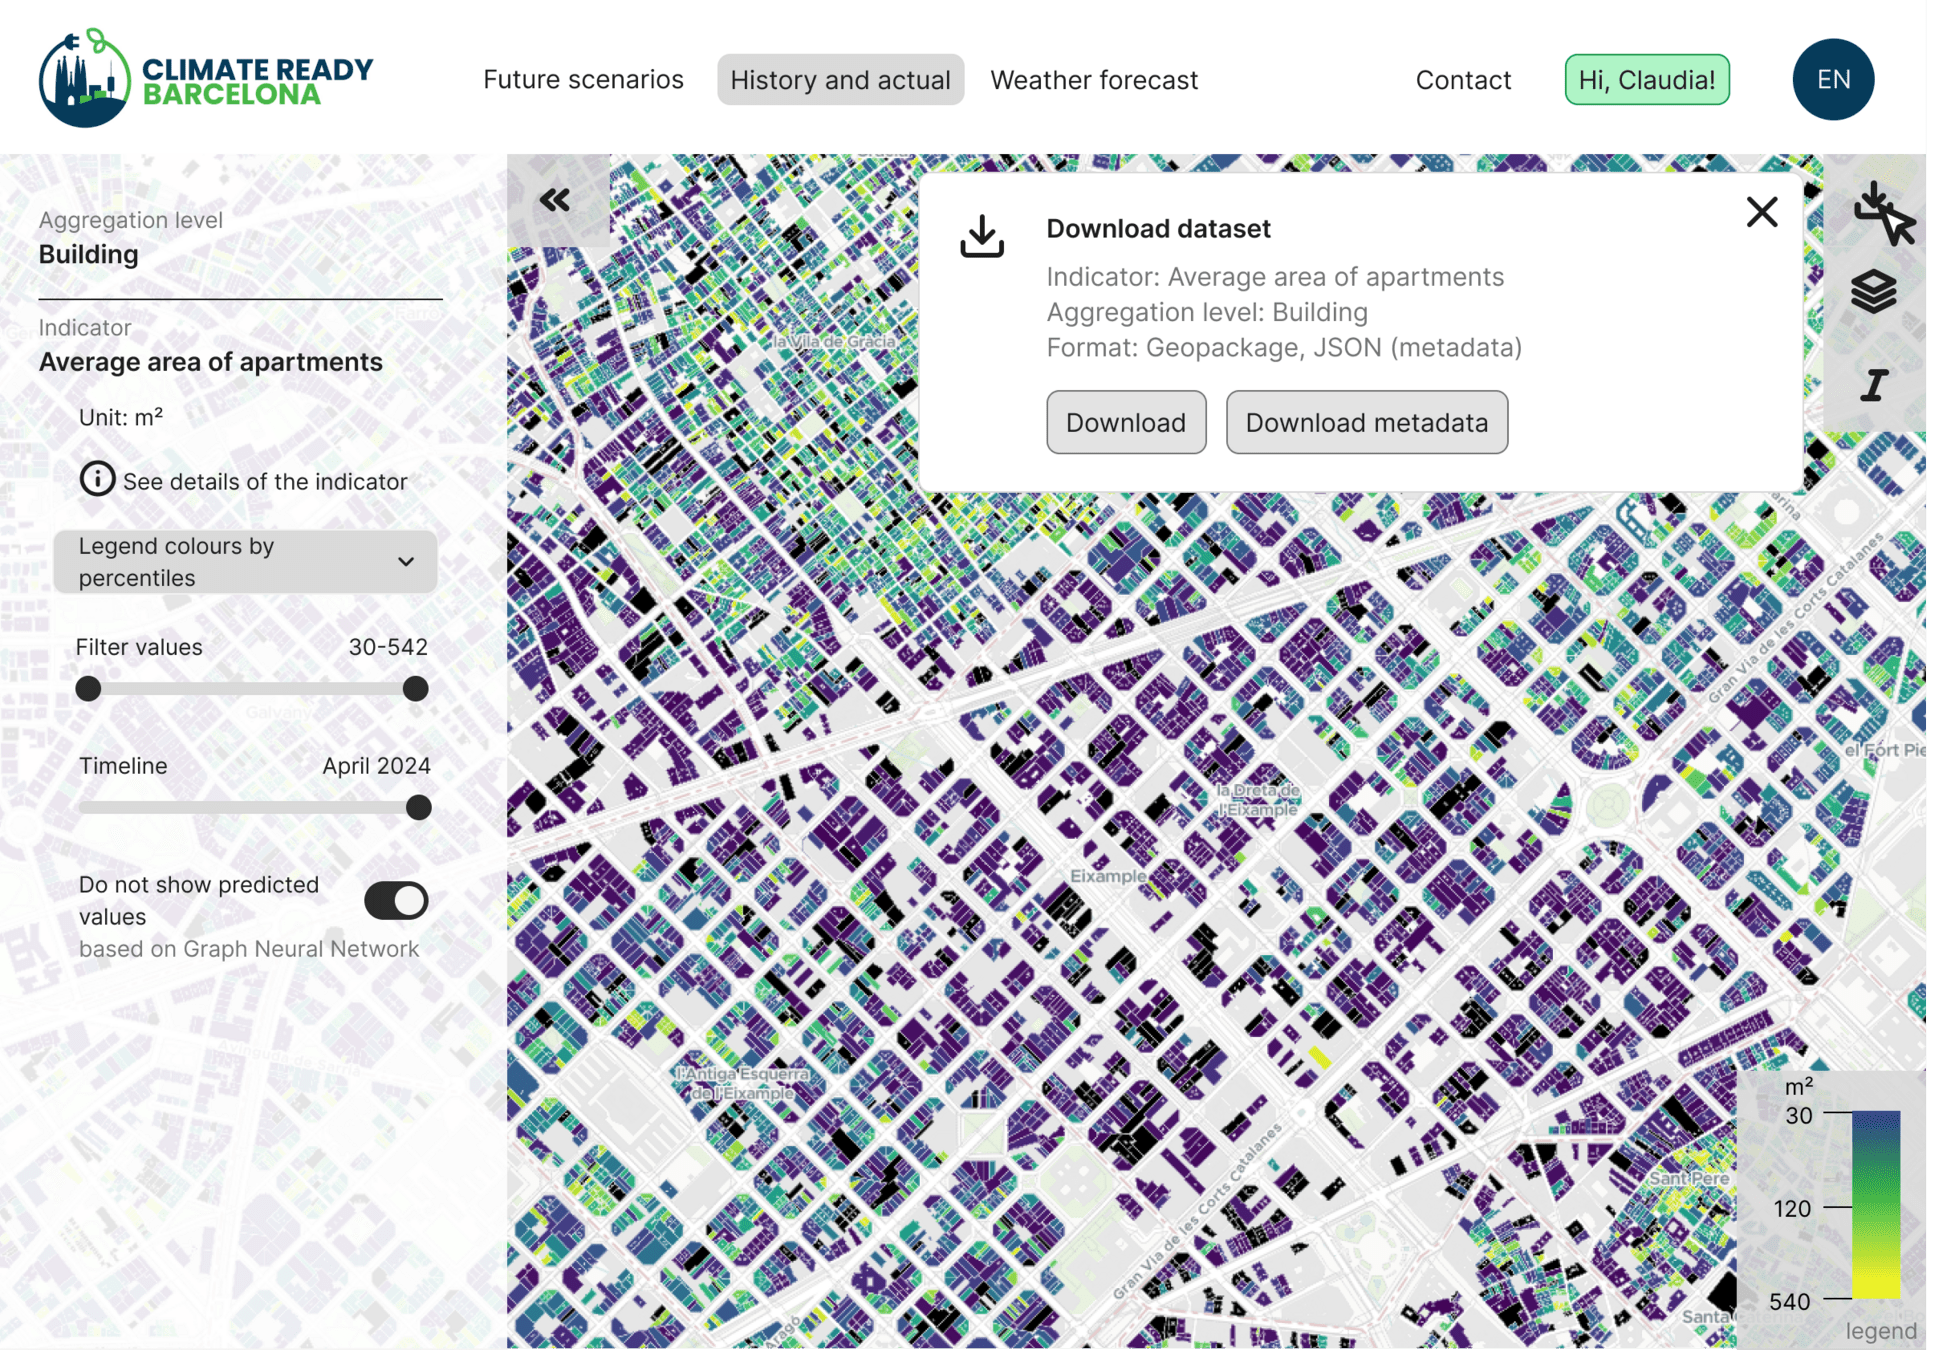
Export and data visualization
Vulnerability map
Vulnerability map

Index evolution by streets and buildings
Queries and forecasts
Vulnerability map
MindCity: Climate Vulnerability Map Visualization
Queries and forecasts
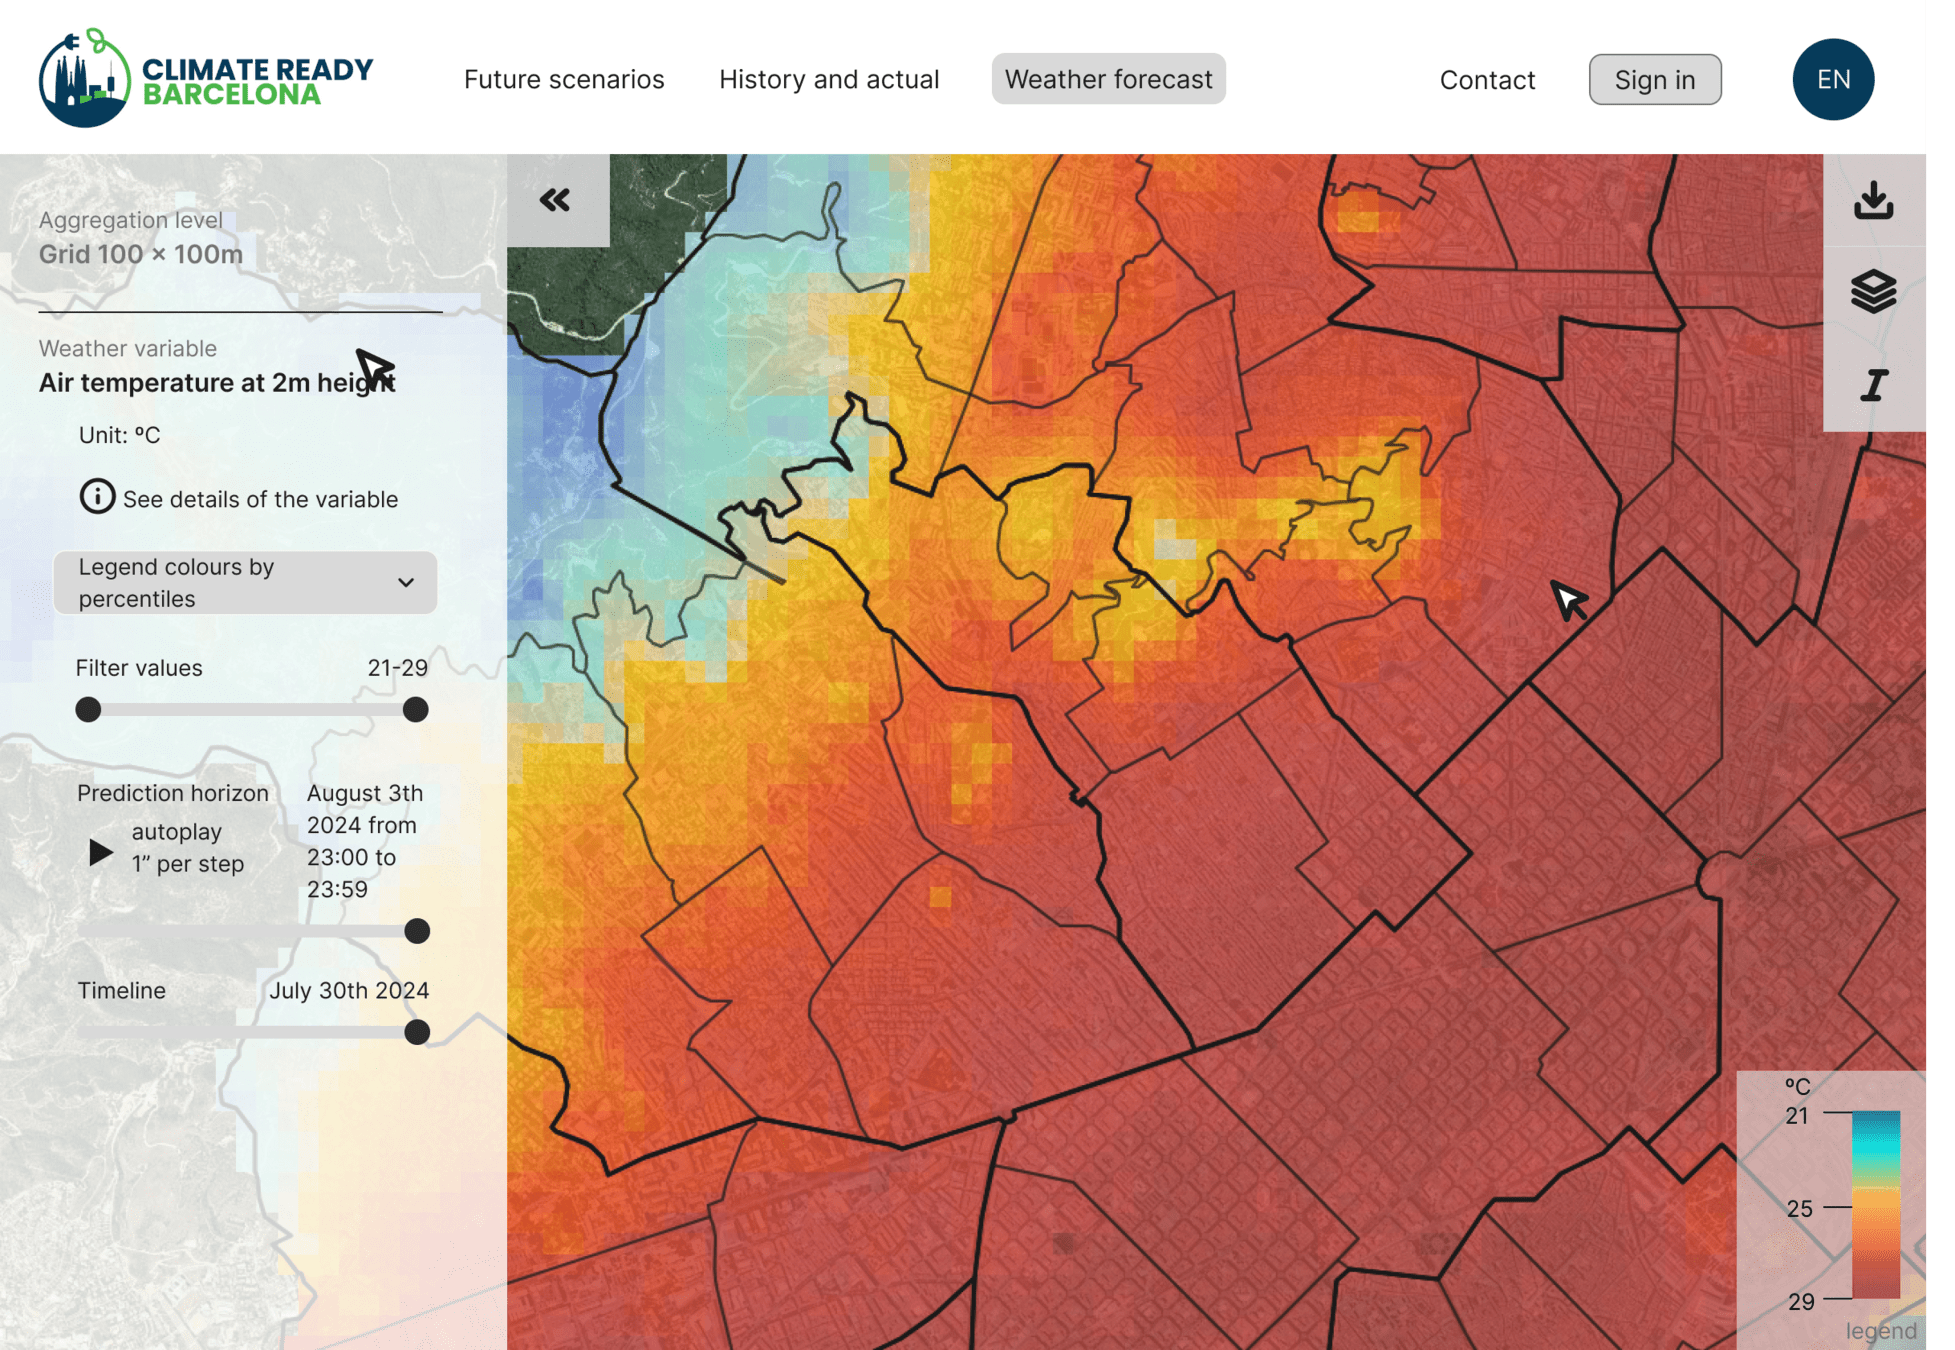
Temperature forecast visualization by neighborhoods
Vulnerability map
MindCity: Climate Vulnerability Map Visualization
Thank you
Jordi Cipriano
Director of Innovation Unit BEE Group
cipriano@cimne.upc.edu