


Advanced tools for strategic planning and energy efficient operation in public buildings and cities


A consortium of:
In collaboration with:
MindCity
BEEMind tools : MindCity
High resilient cities in practice
This solution helps municipalities and organizations go digital and manage their data effectively on a local level.
It is a key tool for smart cities, energy planning, adapting to climate change, and making decisions about urban retrofitting
What does it do? It checks out KPIs for buildings and helps planning for energy transition and climate change adaptation:
-
City microclimate model (100x100m)
-
Rates how buildings are vulnerable to climate issues
-
Forecasts energy retrofitting and adaptation strategies
-
Sends heat wave communications—4 days ahead
-
Supports designing urban green spaces and shelters
Description
Geo-AI powered models
We develop machine learning and Graph Convolutional Neural Network (GCNN) models
To enable learning patterns from geo-structured data (buildings, streets, use, energy, etc).
Extrapolation of KPIs for all buildings when no real data is available
It is a digital landscape, a dynamic knowledge graph that brings urban exploration to life.
Definition of future climate mitigation and adaptation scenarios
BEEMind tools : MindCity
BEEMind tools : MindCity
-
Integration, processing, and visualization of large amounts of urban data at the building level
-
AI powered models to improve cities and make them more resilient against extreme weather events.
-
Figuring out specific geospatial indicators that connect to climate action and the shift towards cleaner energy.
-
Evaluation of vegetation and urban climatology scenarios
Funcionalities
Cities 4.0: Environmentally Smart
-
Facilitates strategic decision-making in the energy, climate, and urban planning fields
-
Optimizes resources and processes for large-scale city data analysis
-
Improves coordination between technical departments and citizen interaction
-
Highly scalable to any city in Europe
Benefits
BEEMind tools : MindCity
Use cases
-
Optimizes resources and processes
For large-scale analysis of geo referenced urban data -
Improves coordination
Between municipal technical departments and citizen interaction -
Scalability
Straightforward for most of Spanish regions, and with adaptation of income data sources, scalable to other EU regions
-
Climate Vulnerability map
Detect areas with people that might be in vulnerability against climate conditions based on cross-sectional analysis of KPIs. -
Support buildings energy retrofitting
Identify and prioritize buildings with the greatest demands and retrofitting potential. -
Actions to adapt to climate disruptions
Optimizing climate shelters location, better climate communications with citizens, estimate greening and shadowing areas potential...
Impacts
Cities 4.0: Environmentally Smart
Case Study: Climate Vulnerability Map of Barcelona
Vulnerability map: Climate-Ready BCN
Source: ICLEI Action Fund 2.0
Budget: €1M
Objective: Support citizens and public authorities in adapting to extreme climate events and reducing energy poverty
Implemented: From May 2023 to December 2025


Climate Vulnerability in Barcelona at building level
The Climate Vulnerability Map of Barcelona is a geospatial analysis tool designed to identify the buildings most at risk during extreme heat events.
It evaluates key performance indicators (KPIs) for buildings and supports climate change planning
It provides an assessment of all residential buildings in Barcelona(61,000)
What is it?
CVI
How we estimate the Climate Vulnerability Index (CVI)
Vulnerability index to asses heat wave resilience
Climate vulnerability is typically framed within three key dimensions defined in the IPCC's Third Assessment Report (Intergovernmental Panel on Climate Change) in 2001:
Exposure
Sensitivity
Adaptive capacity
Although most studies classify indicators using these three categories, our index introduces additional levels to provide a more nuanced analysis while remaining aligned with the traditional framework.
Climate variability and extreme events
- Track changes over time through indicators such as temperature, precipitation, and vegetation cover. Local data helps assess risks related to heatwaves, droughts, and floods.
Energy indicators
- Explore energy use patterns (gas and electricity consumption). Indoor temperature data is crucial for identifying households at risk during extreme heat events.
Building characteristics
- Assess features such as age, use, and size to understand their impact on energy use, indoor comfort, and structural vulnerability.
Indicators groups (KPIs)
Vulnerability map


Infrastructure indicators
Assess the availability of essential public services (schools, climate shelters, social housing) and the strength of social networks to understand community support capacity.
Health indicators
Analyze the relationship between climate and health outcomes to identify vulnerable populations and prepare healthcare systems.
Demographic indicators
Not all groups are equally vulnerable. Analyzing factors such as gender, age, income, migration status, and unemployment allows for the development of more detailed CVIs.
Socioeconomic indicators
Understand urban resilience through factors such as housing costs, energy poverty, household debt, and gaps in social protection, which worsen during economic crises.
Vulnerability map
Indicators groups (KPIs)


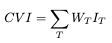
Climate vulnerability Index (CVI)
-
Data preprocessing – Select input data to calculate the indicators.
-
Framework selection – Determine which indicators positively or negatively affect the CVI.
-
Granularity definition – Select the spatial scale.
-
Normalization & weighting – Harmonize indicators and assign weights.
-
Aggregation – Combine indicators into groups to obtain a final value.
⚠️ Challenge: Each study adapts its CVI to its specific context and priorities.
CVI Construction
Vulnerability map
Our approach:
Building the CVI
Vulnerability map
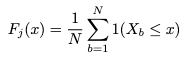
Use of empirical cumulative distribution function to assign a value to each building for a given KPI:
🎯 Outcome: A practical tool for both policymakers and citizens to explore climate vulnerability and support decision-making.
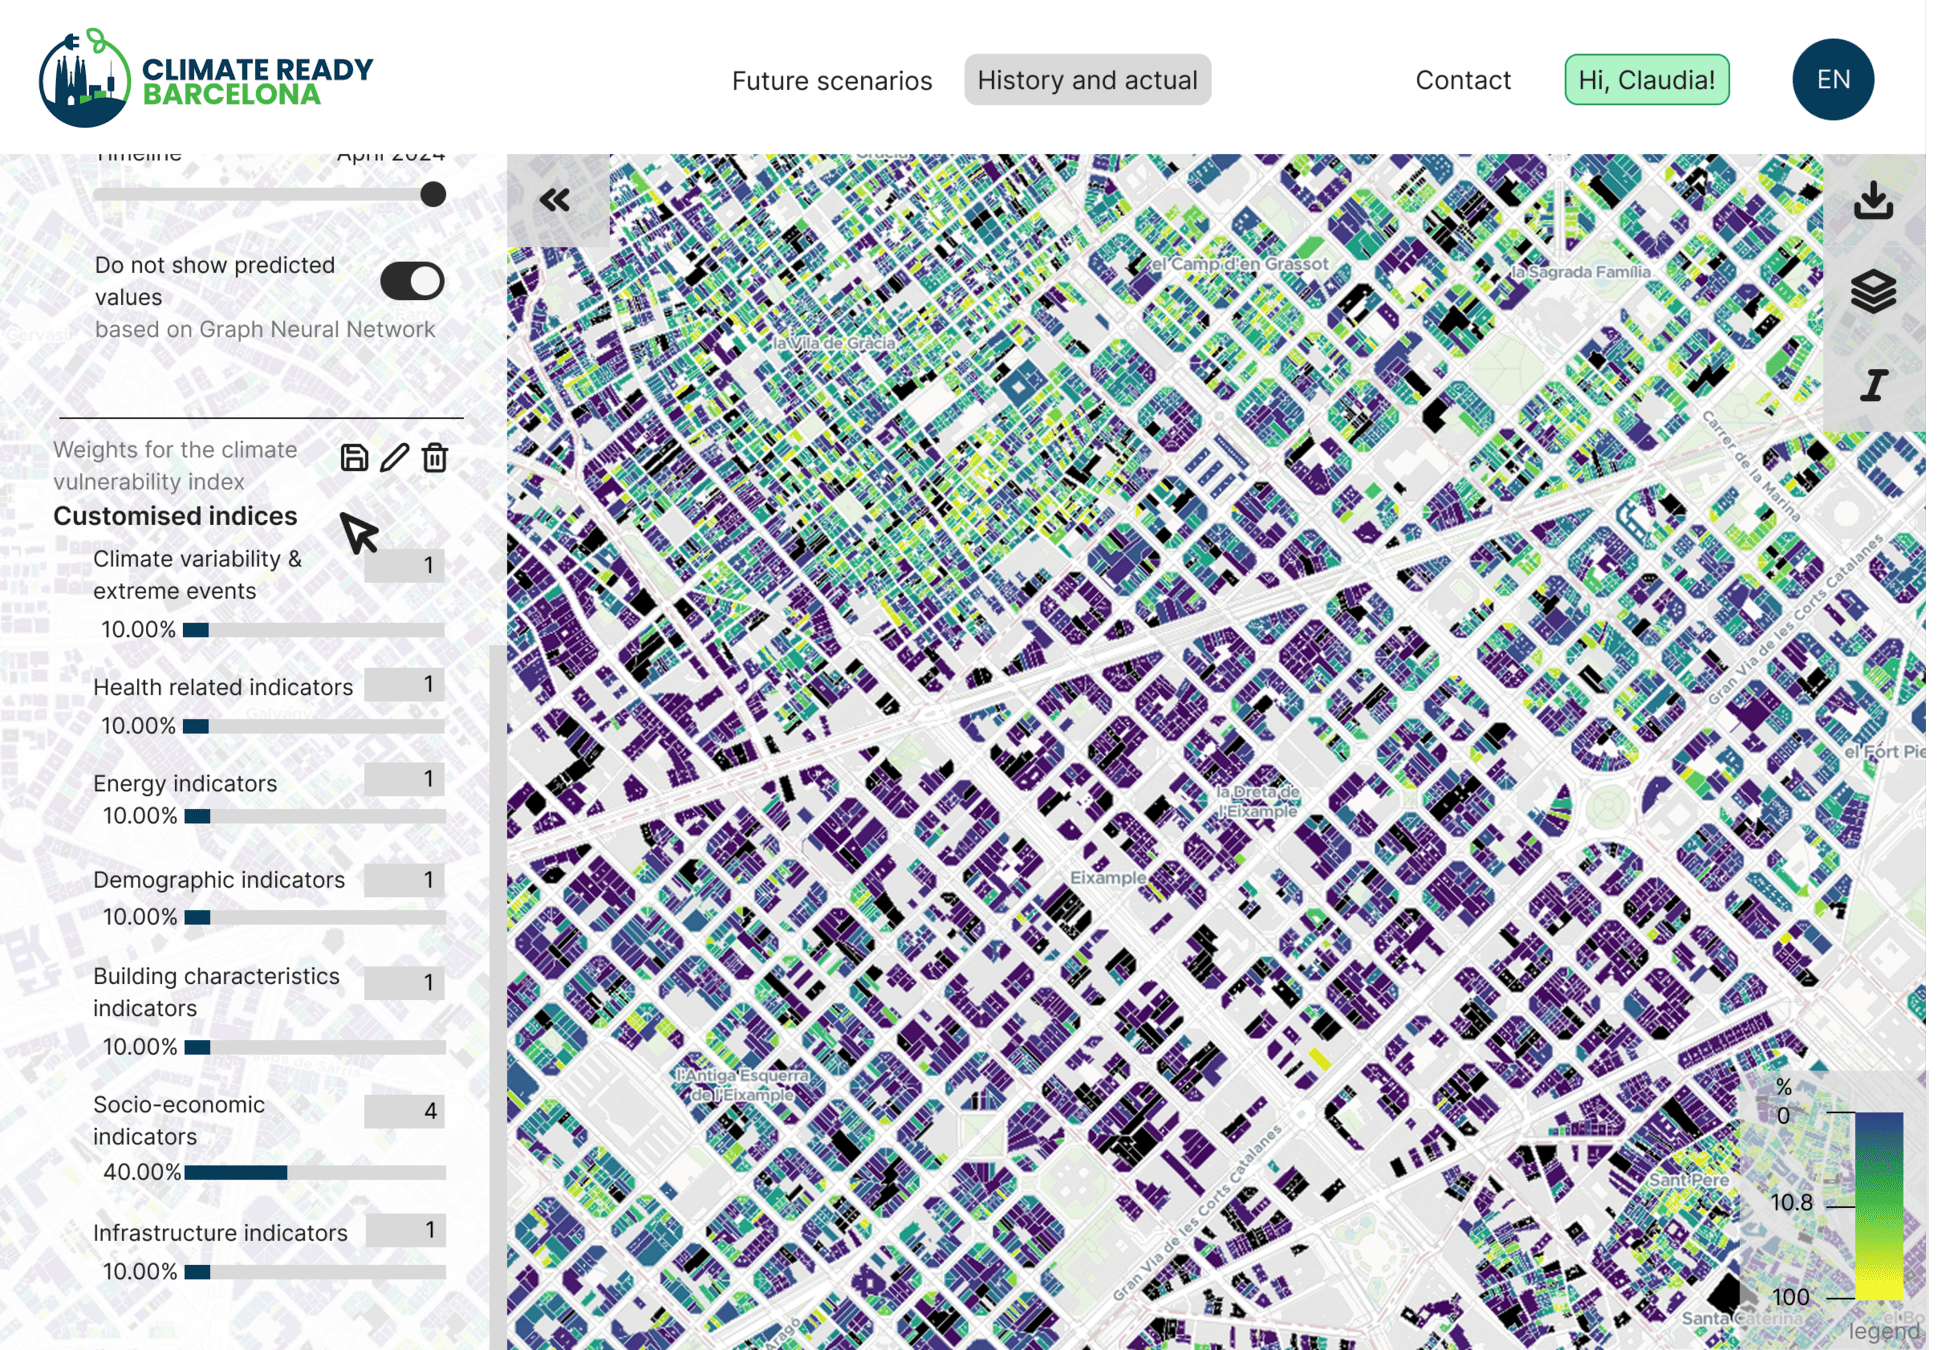
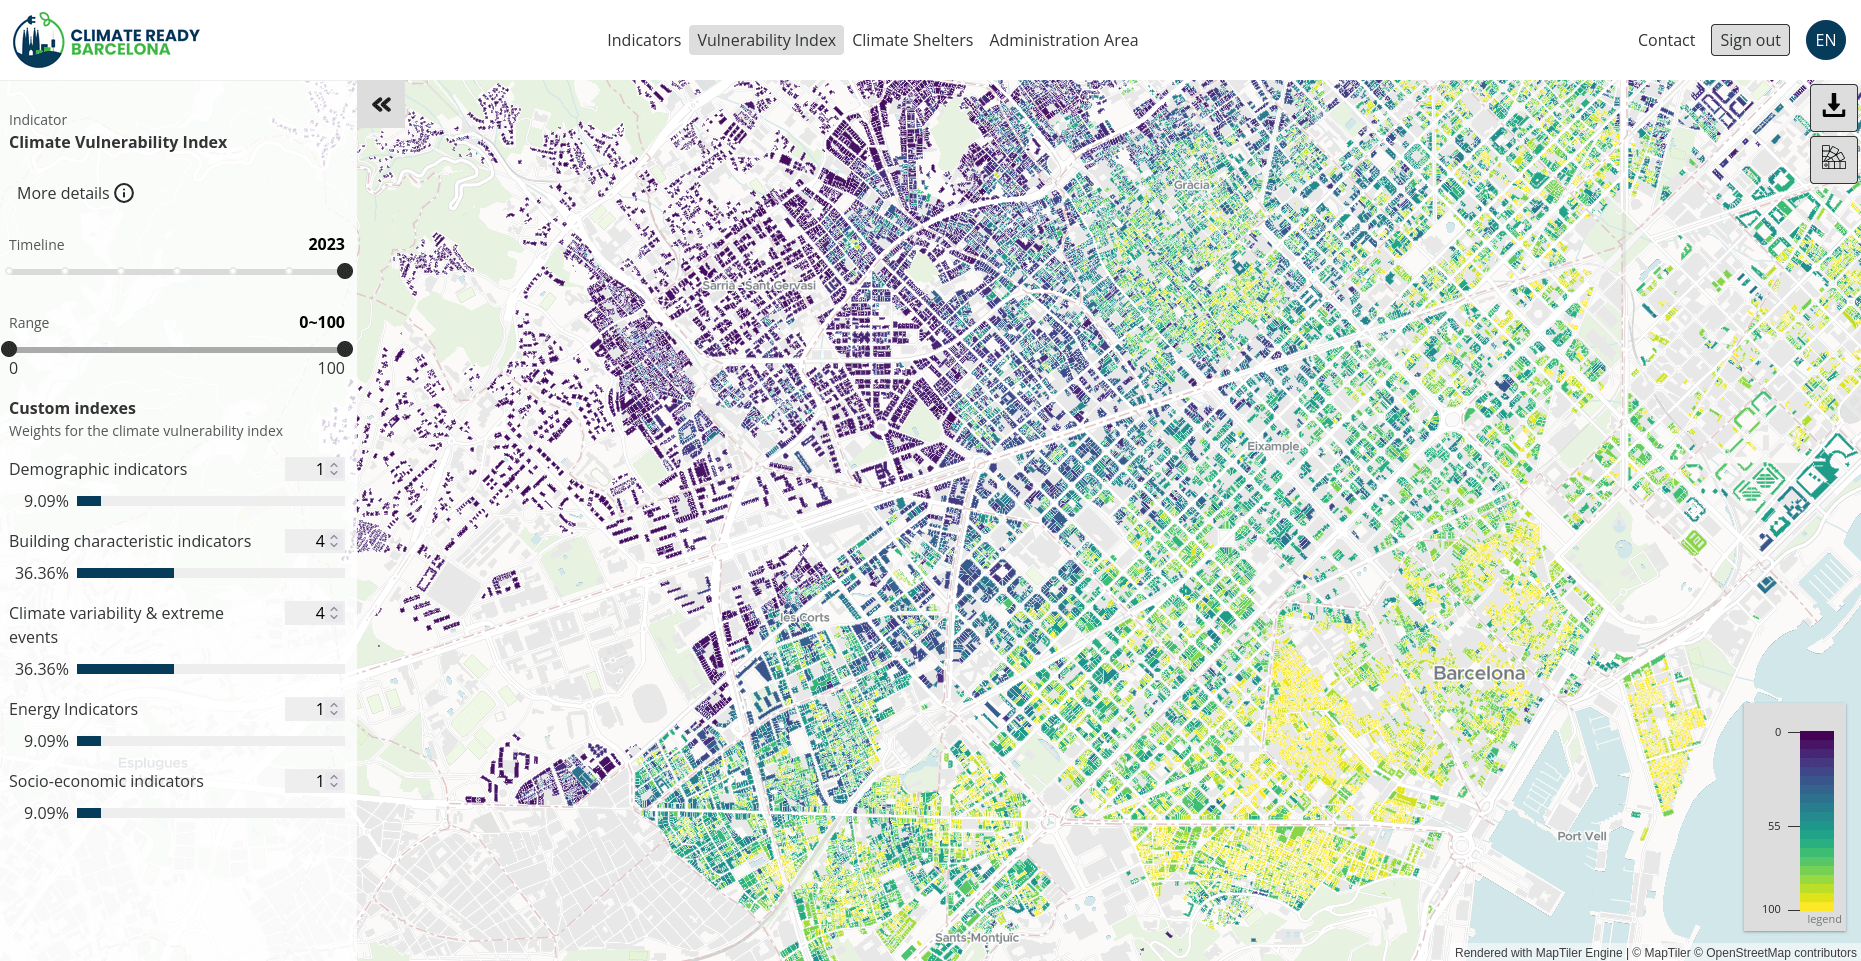
Interactive map and CVI:
- View individual KPI layers
- Customized weights
- Adaptable CVI
Use Calculation of aggregated value for a typology T
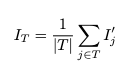
Use Calculation of aggregated value for a typology T

Data sources & harmonization
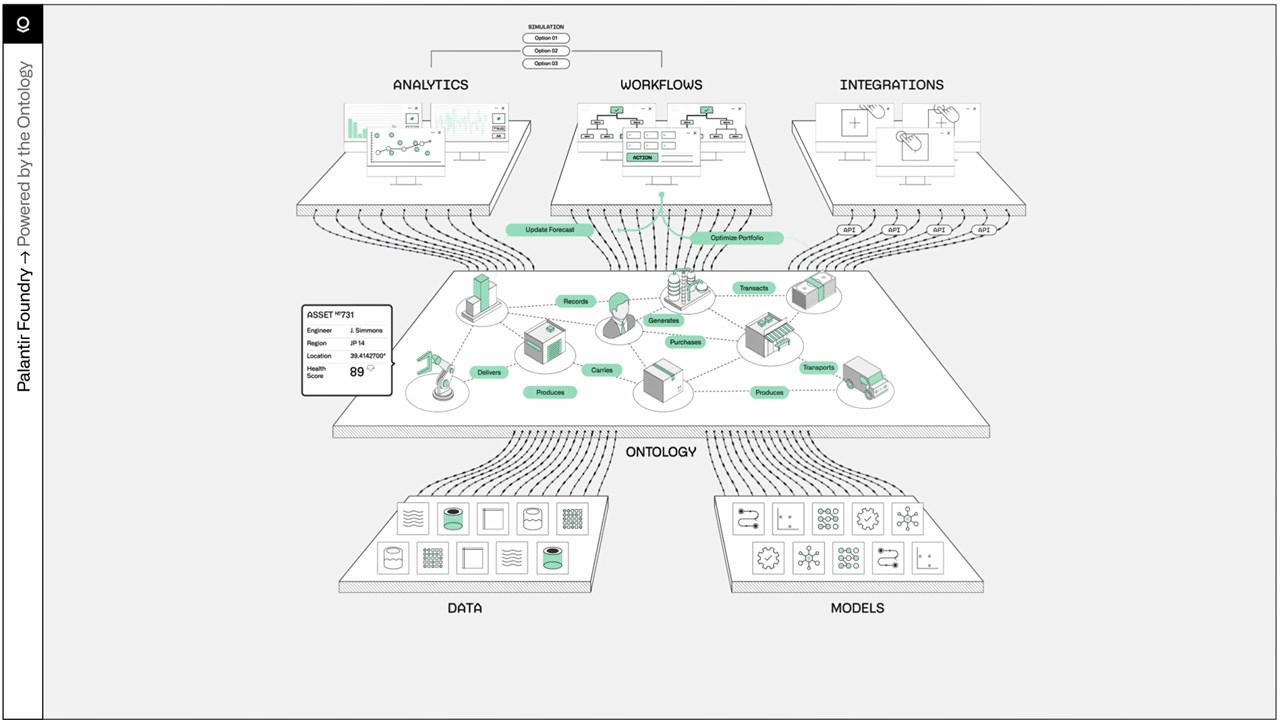
BEEMind: Data ontology
The ontology at the core of our solutions
Understanding and organizing data is as important as the algorithms themselves
Applied semantic web technologies:
Massive data integration
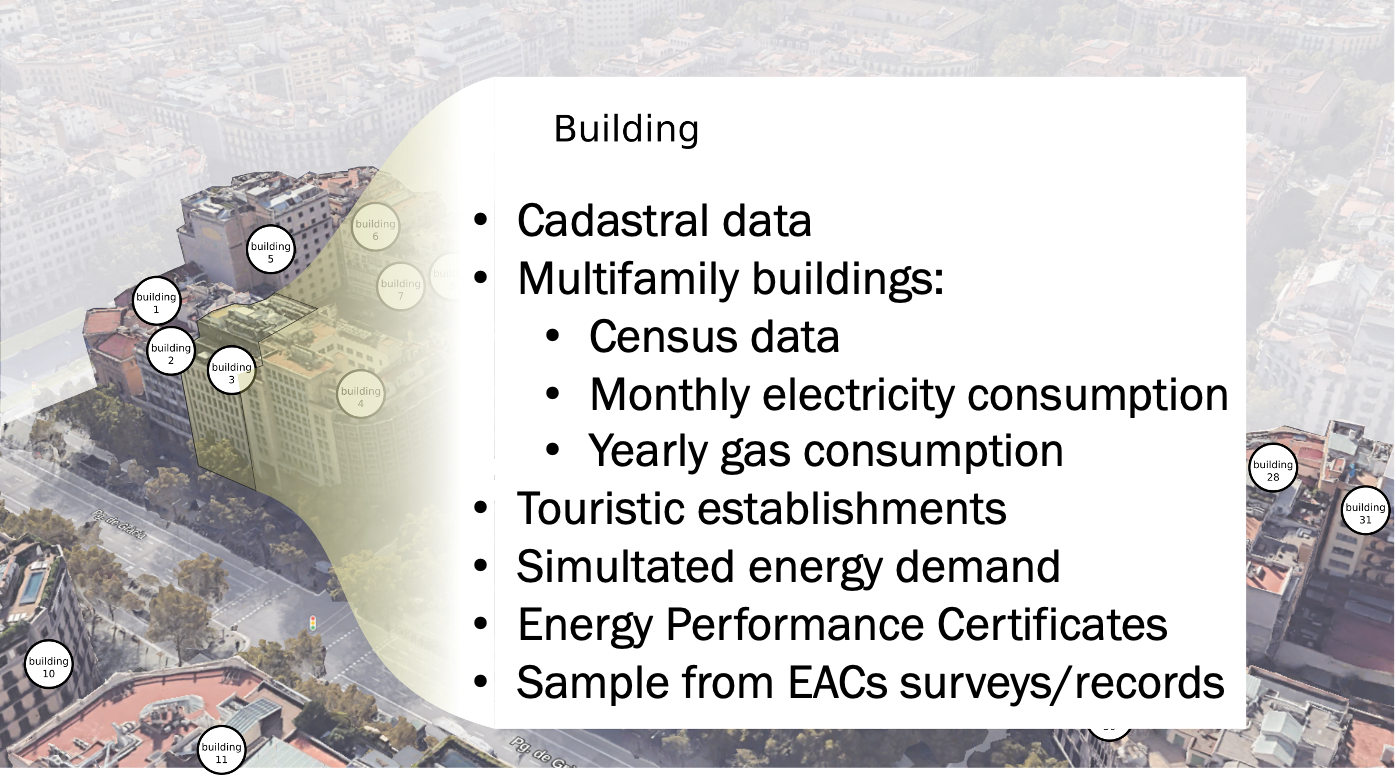
3. Data at building level
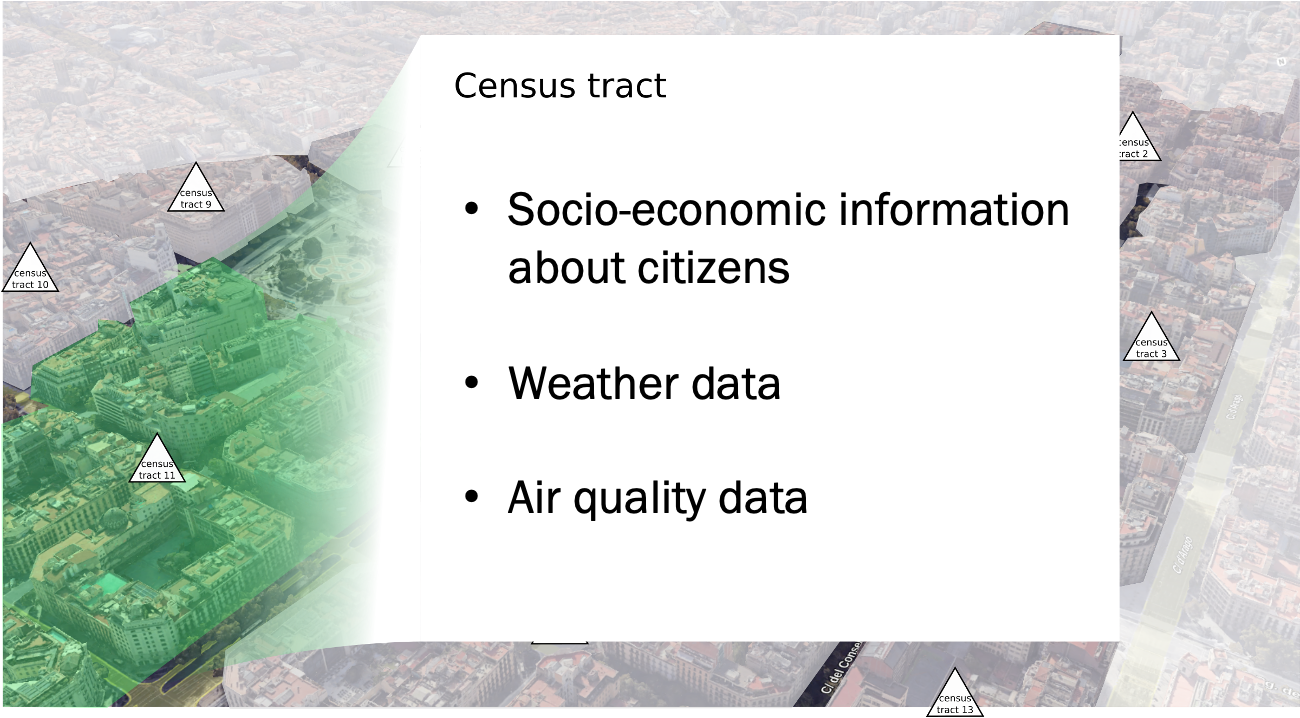
2. Data at census code level
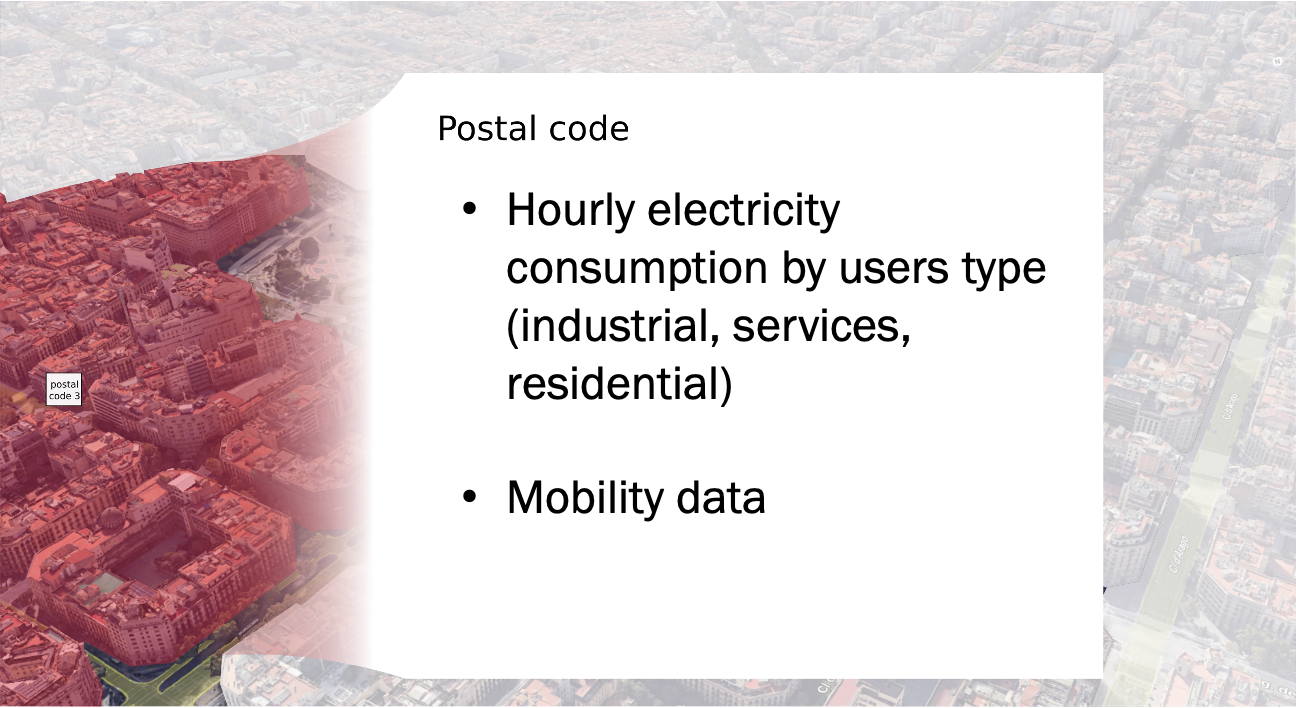
1. Data at postal code level
How to integrate and link data?
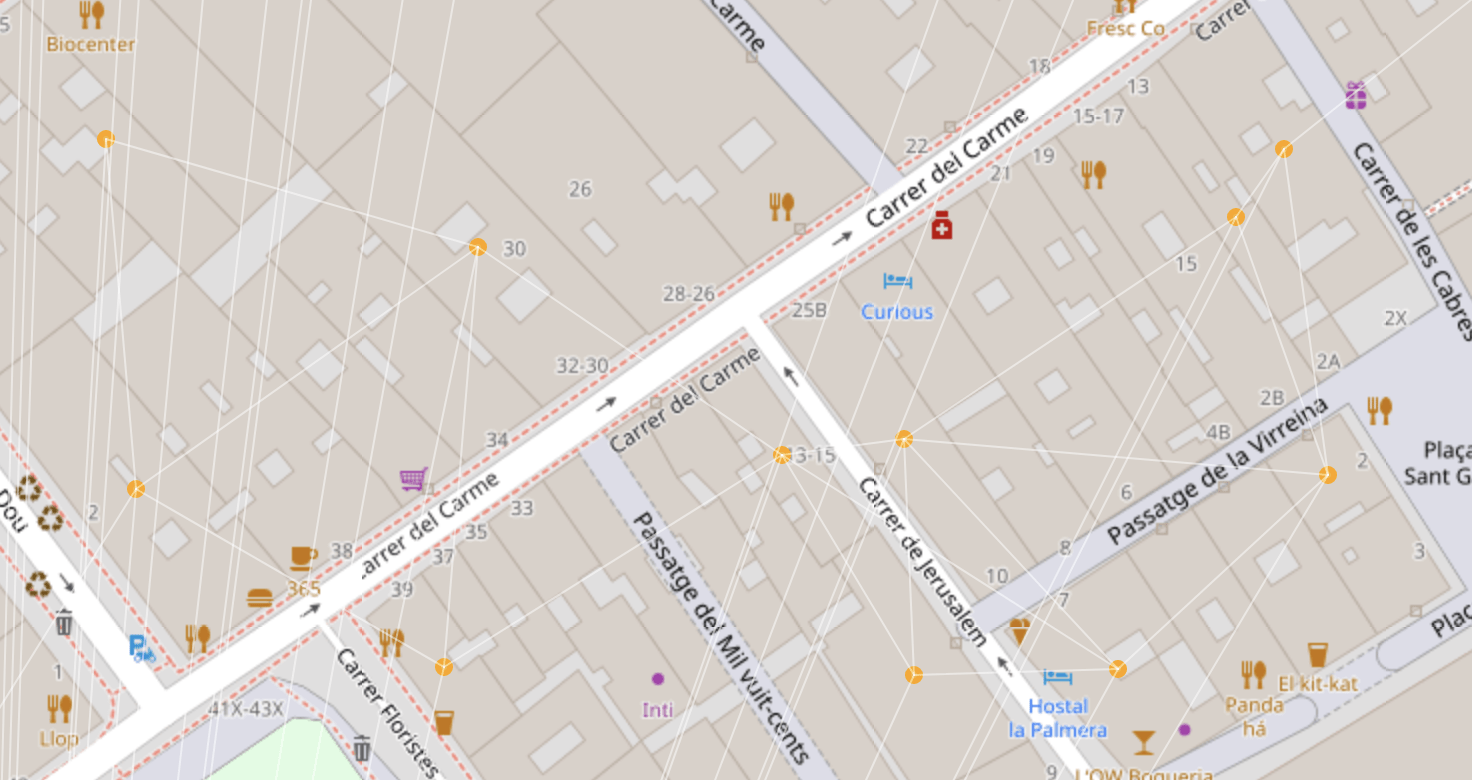
- Cadastral (INSPIRE + CAT Files). Building characteristics, horizontal distribution. Inferred: buildings shadows analysis, wall types and orientations, patios, administrative metadata (addresses, postal codes..)
- Energy Efficiency Certificates. EPCs at dwelling level, including information about envelope characteristics and HVAC systems.
- Real gas and electricity consumption readings (monthly at building level, hourly at postal code level)
- Meteorological data (ERA5LAND, and UrbClim project).
- Socioeconomic indicators (Census, income atlases, cost of living...).
- Climate Shelters. Including characteristics and opening timetables
- Administrative layers
- Normalised Difference Vegetation Index (NDVI). An aggregation of a buffer around each building was computed
- Tourism-related establishments
- Health data. Mortality and morbidity due to extreme heat events
Main data sources

Heterogenous data ingestion
Massive data integration
Data sources
big numbers
Massive data integration
61,000
1 Milion
200.000
Buildings


Households
EPC

10,222
3 Milion
20.000
Zones (microcli-mate model)
KPIs visualized
Heat waves warnings and tips
1,050
Households
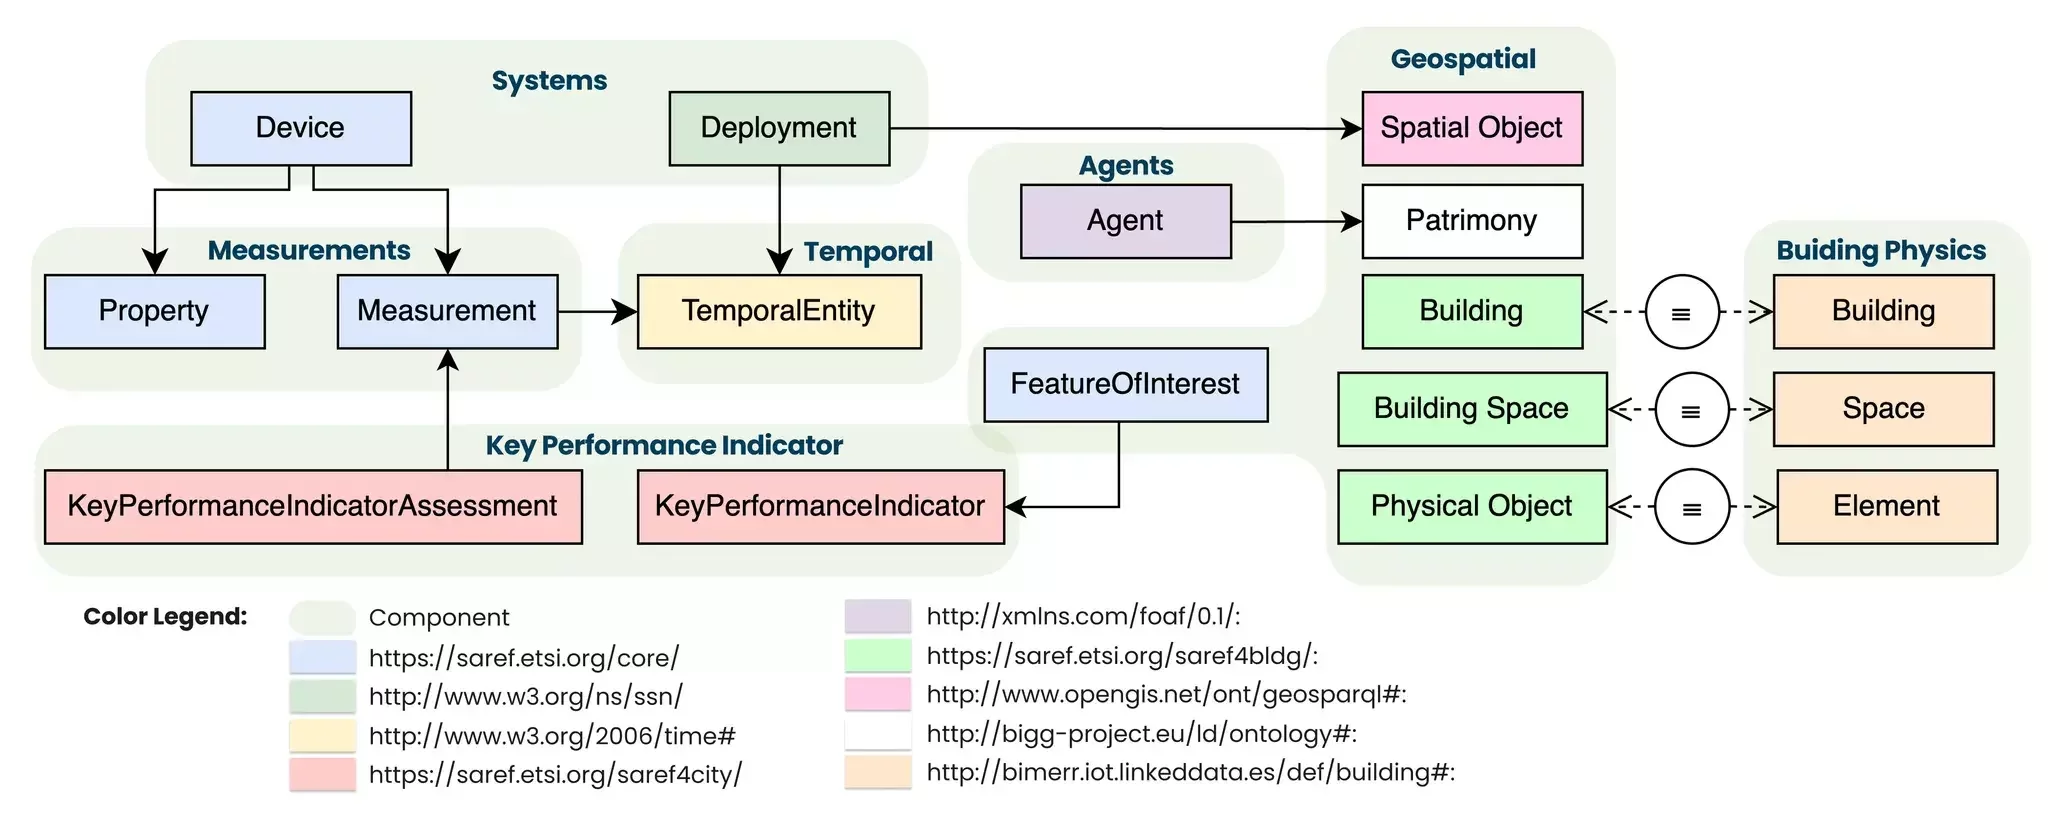
Interoperable web semantic frameworks
- Standardized schema (OWL/RDF Turtle) and shared vocabulary for describing IoT devices, buildings and urban areas
-
Reuse & interoperability
-
buildings, physical objects:
saref, s4blg, s4city, s4agri - systems, measurements:
ssn - geospatial:
geosp - units:
qudt
-
buildings, physical objects:
BIGGONTOLOGY:
Semantic reference ontology
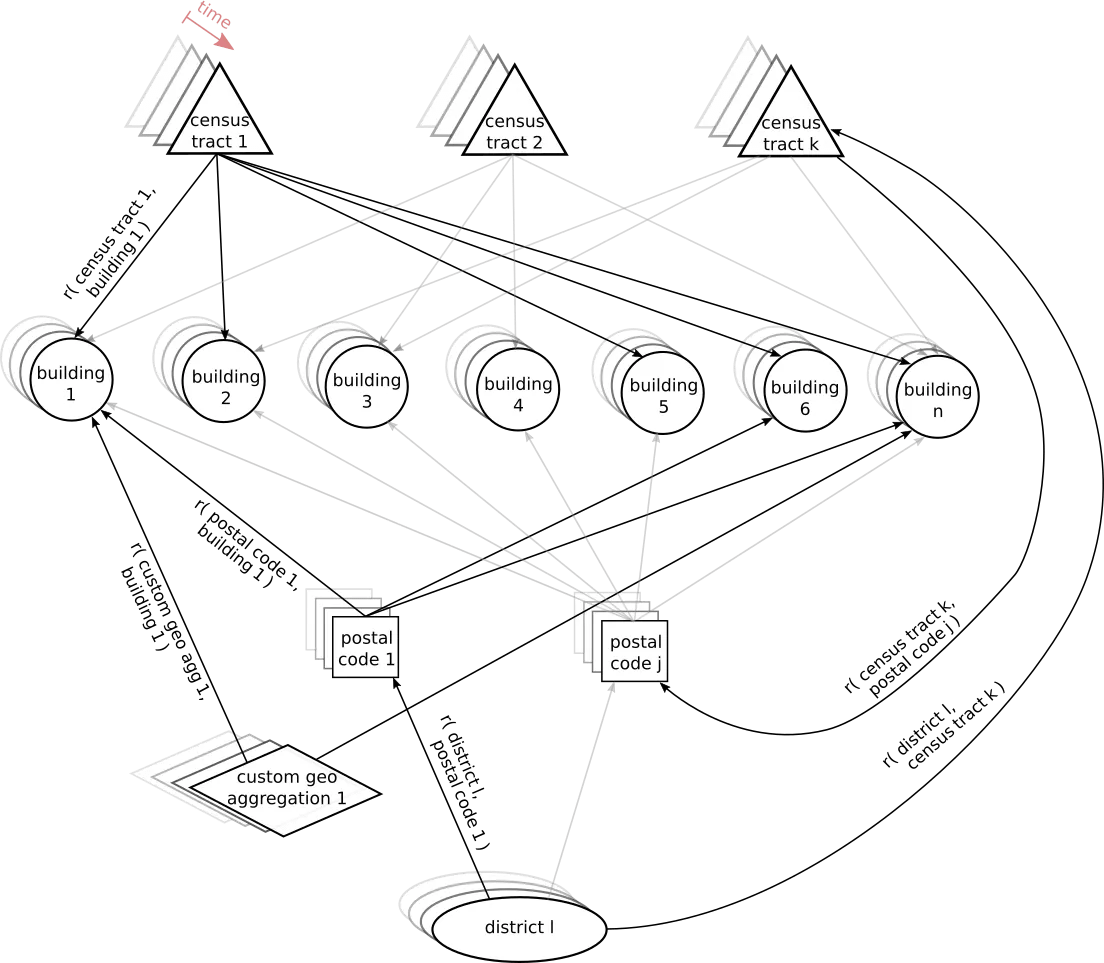
Knowledge graph
Knowledge graph: Structured representation that connects geospatial data with various entities and their relationships, enabling better analysis and reasoning about geographic information.
Modelling
-
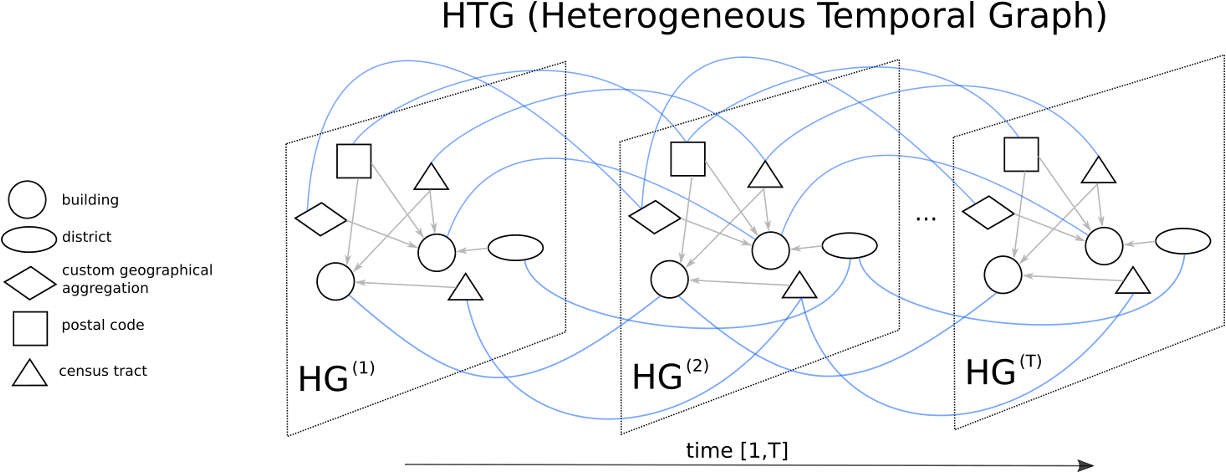
KPI prediction model: heterogenous temporal graph
MindCity: Modelling
Vulnerability map
Graph Convolutional Neural Network (GCNN) models
To enable learning patterns, fill knowledge gaps and predict scenarios from geo-structured data
Output examples:
- Building-level energy consumption
- Building-level energy demand
- Close-to-building average land
surface temperature
- Building-level indoor thermal comfort
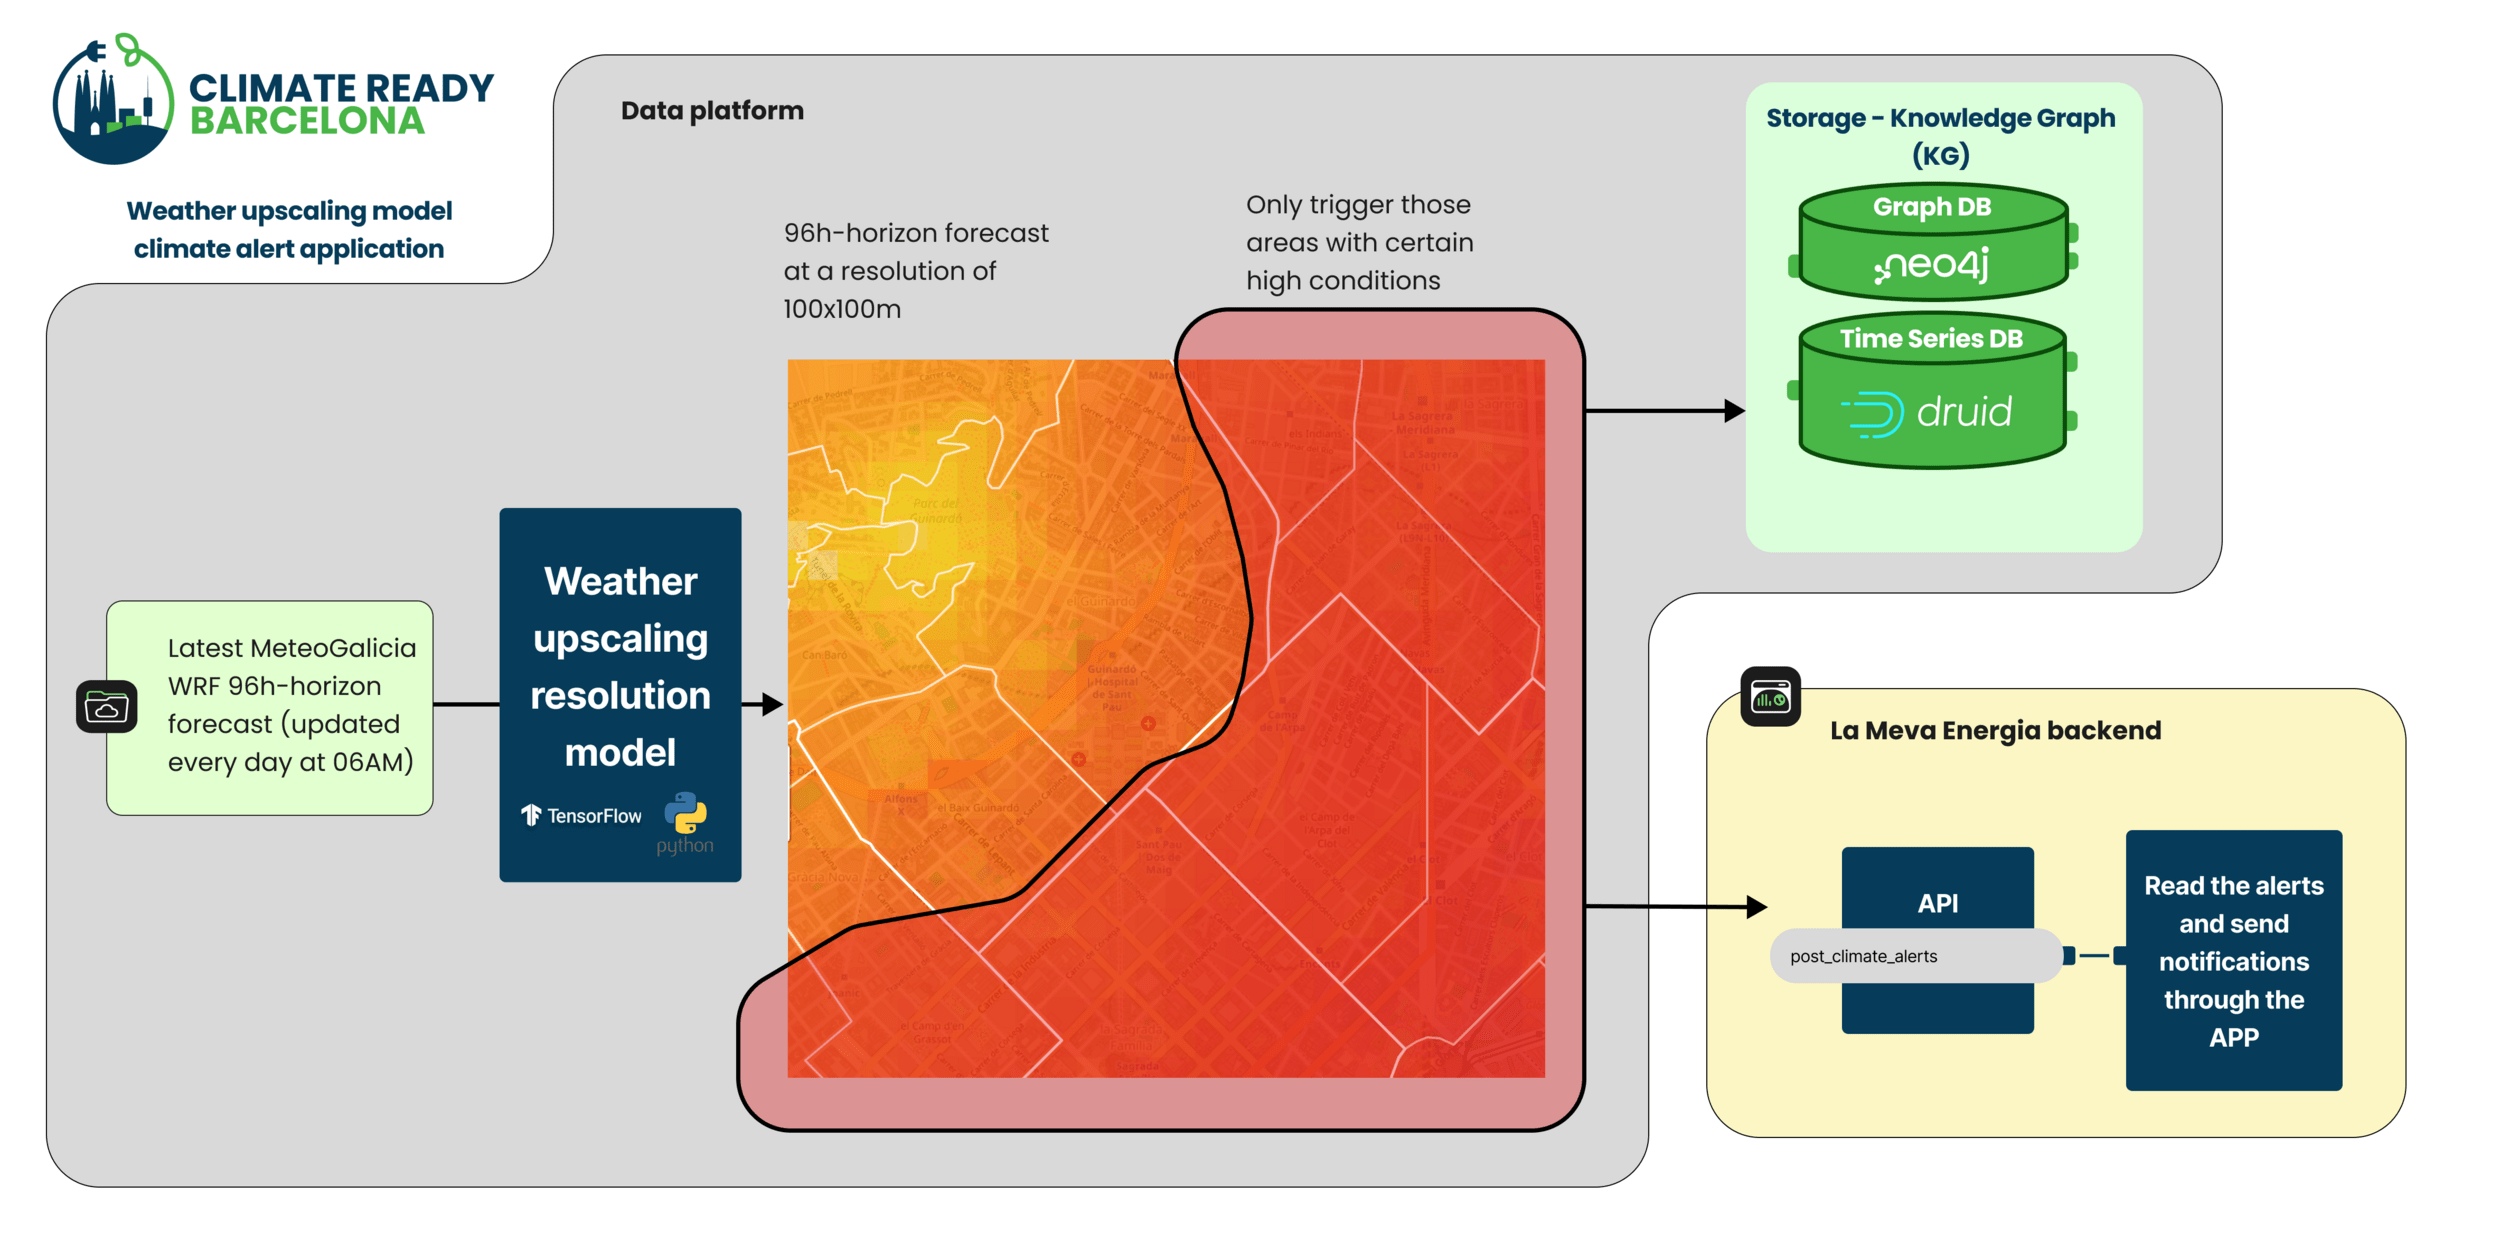
2. Weather downscaling microclimate model
Complementary models
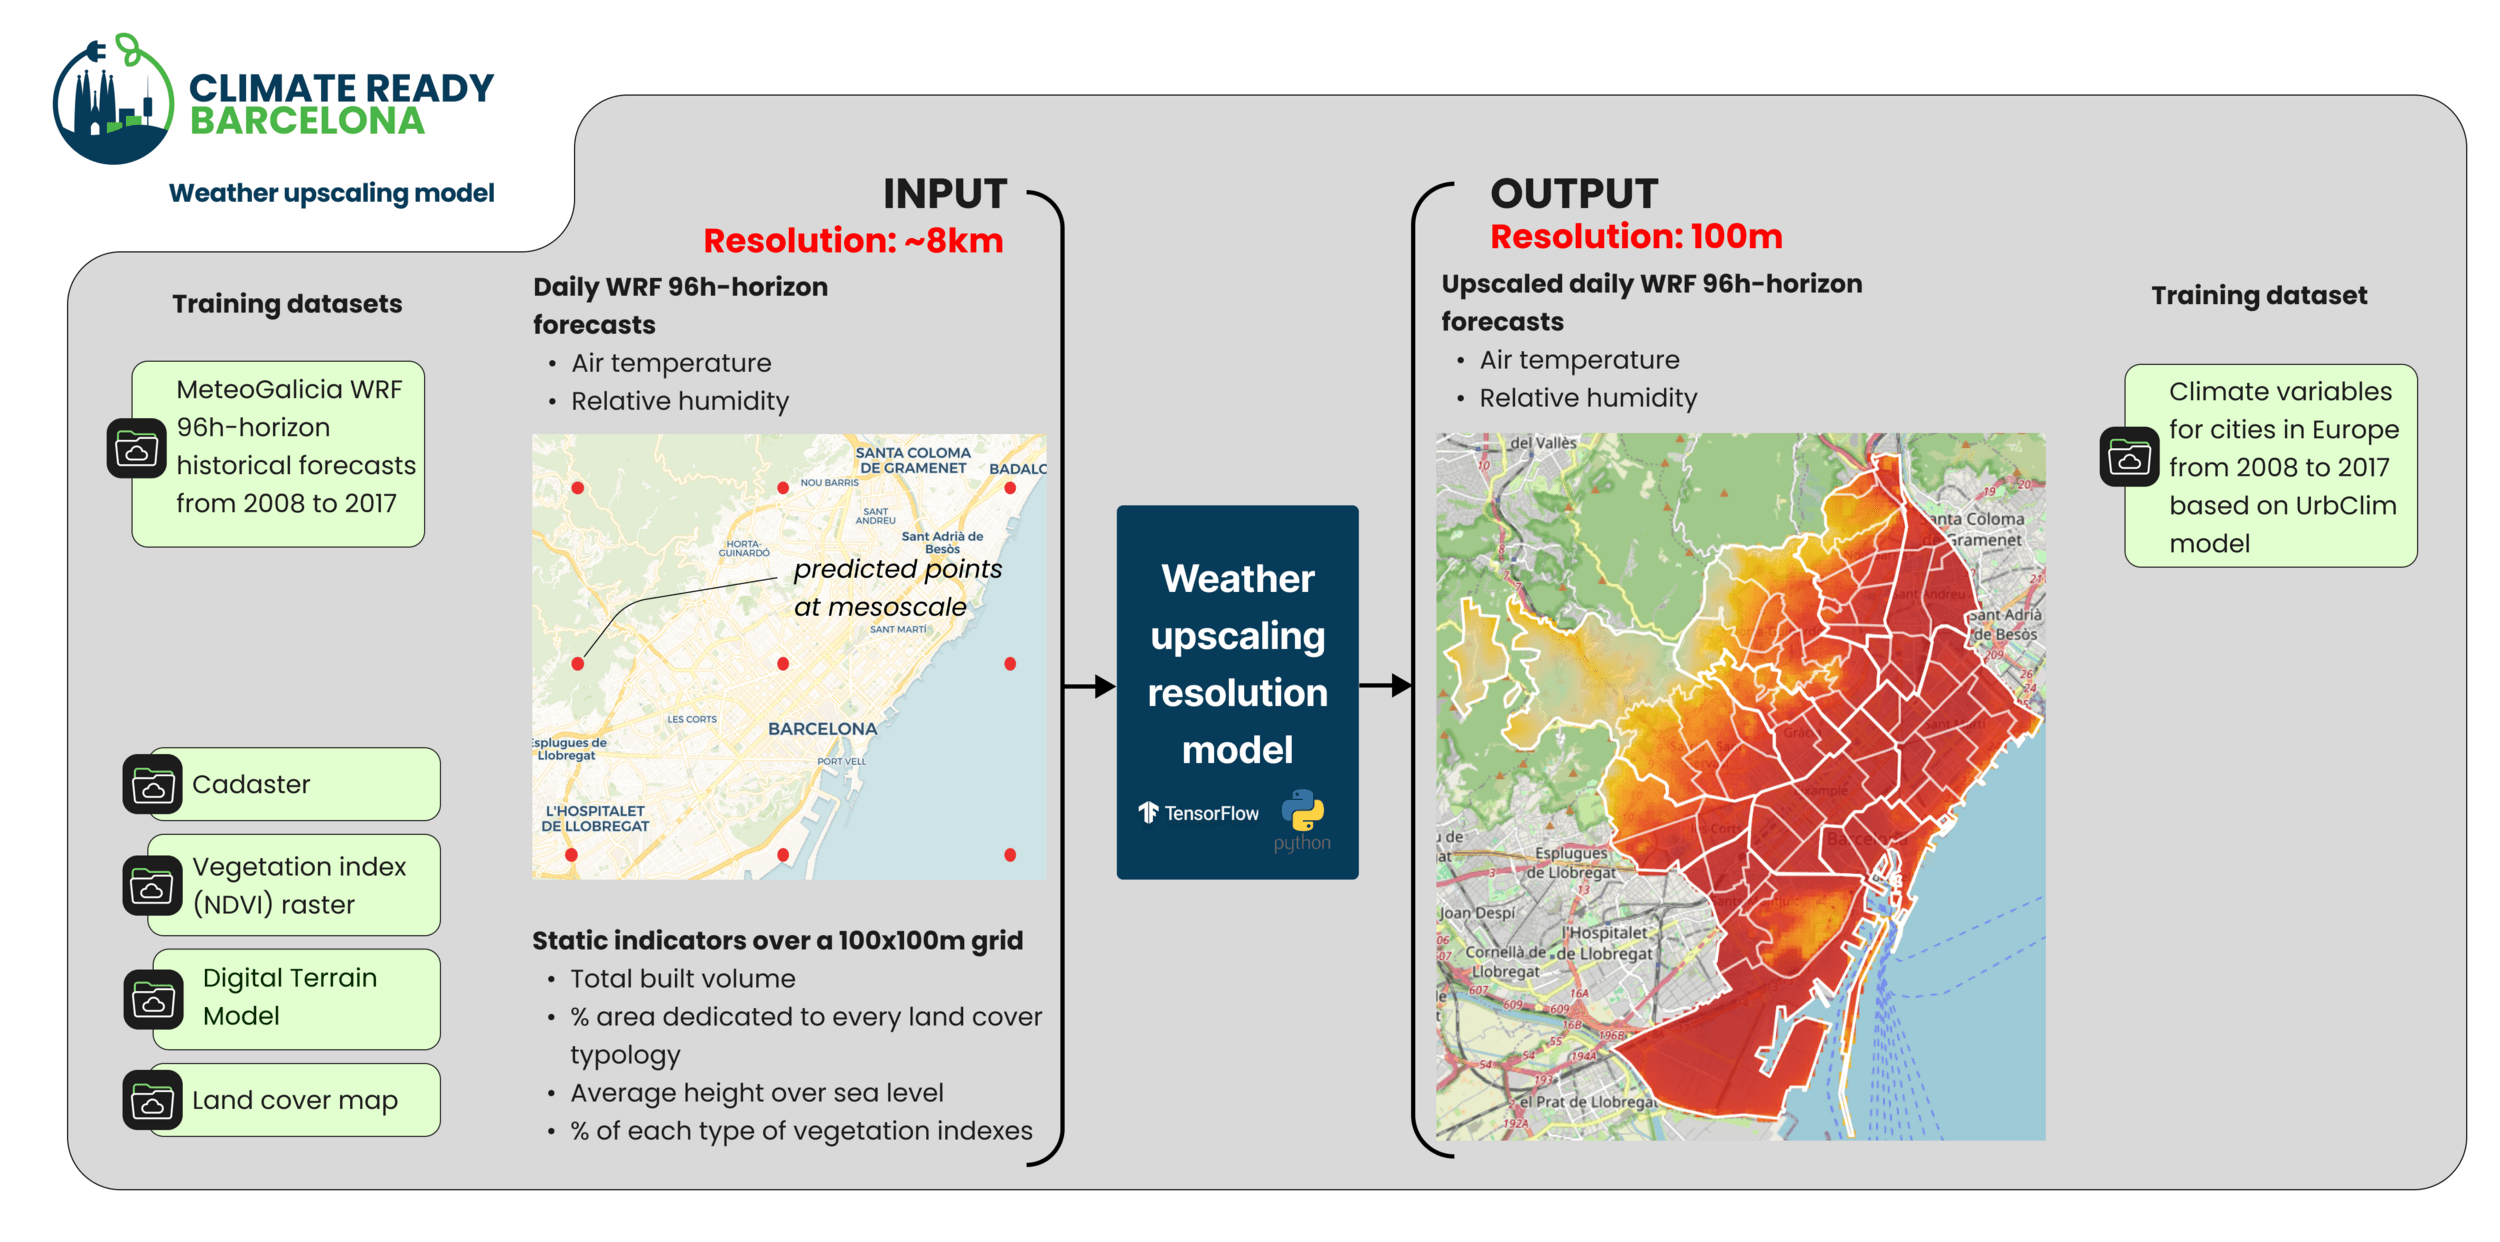
Weather
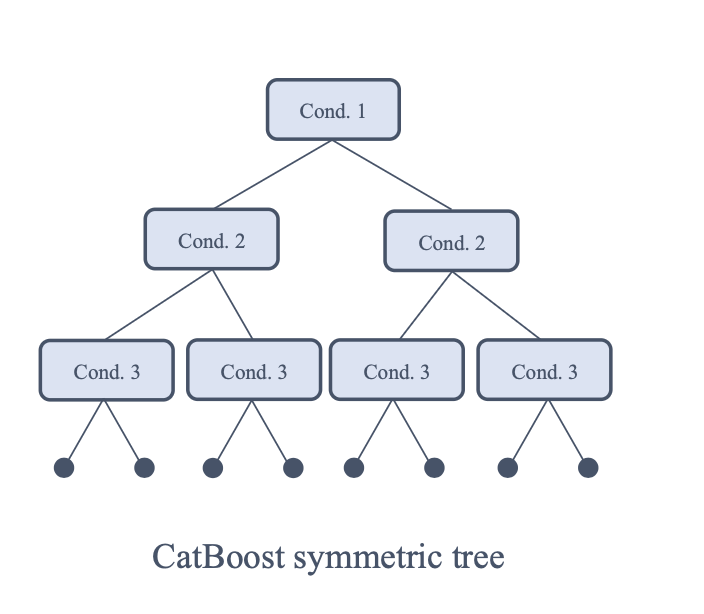
CatBoost decision tree
2.1. Heat waves prediction and communication
Complementary models
Weather
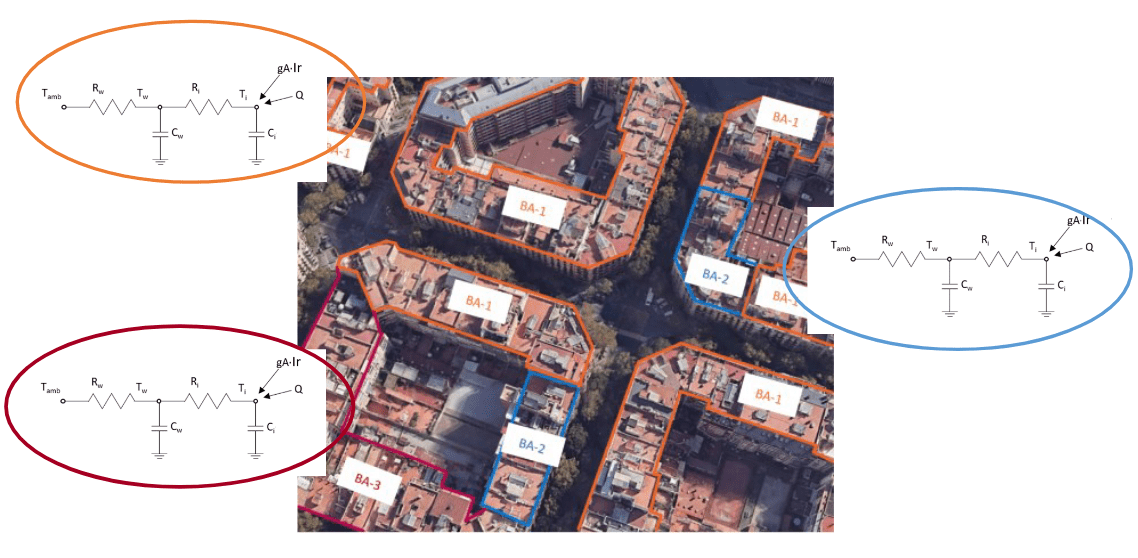
3. Thermal demand models of buildings
Simulation of the thermal energy demand of 37,000 residential buildings.
The simulation engine is based on Reduced Order Grey Box Models (RC models) trained with TRNSYS simulations:
- Building-level predictions for space heating and cooling
- Total energy needs under 3 typologies and 17 archetypes and 5 indoor set point temperatures
- Predicting 5 retrofitting scenarios and 2 HVAC systems
Complementary models

4. Shading evaluation based on Lidar data
Complementary models

1- Build the Digital Surface Model (DSM) of a whole municipality (urban+rural).
2- Estimate the shadows based on DSM raster at the desired geographical and time resolution.
3- Estimate the DEM for further shading estimation
4- Merge with solar radiation data and aggregate the results.
IT architecture
Ontology based big data architecture
- Orchestrates massive energy and urban data in real time.
- AI-powered analytics, and semantic harmonization to drive energy efficiency and actionable decisions for real-time saving

ENMA
open-source big data architecture developed by BEE Group
G. Mor; J. Vilaplana; S. Danov; J. Cipriano; F. Solsona; D. Chemisana. EMPOWERING, a Smart Big Data Framework for Sustainable Electricity Suppliers. (2018) IEEE Access. vol. 6, pp. 71132 - 71142.
Reference paper
ENMA expanded
Software architecture

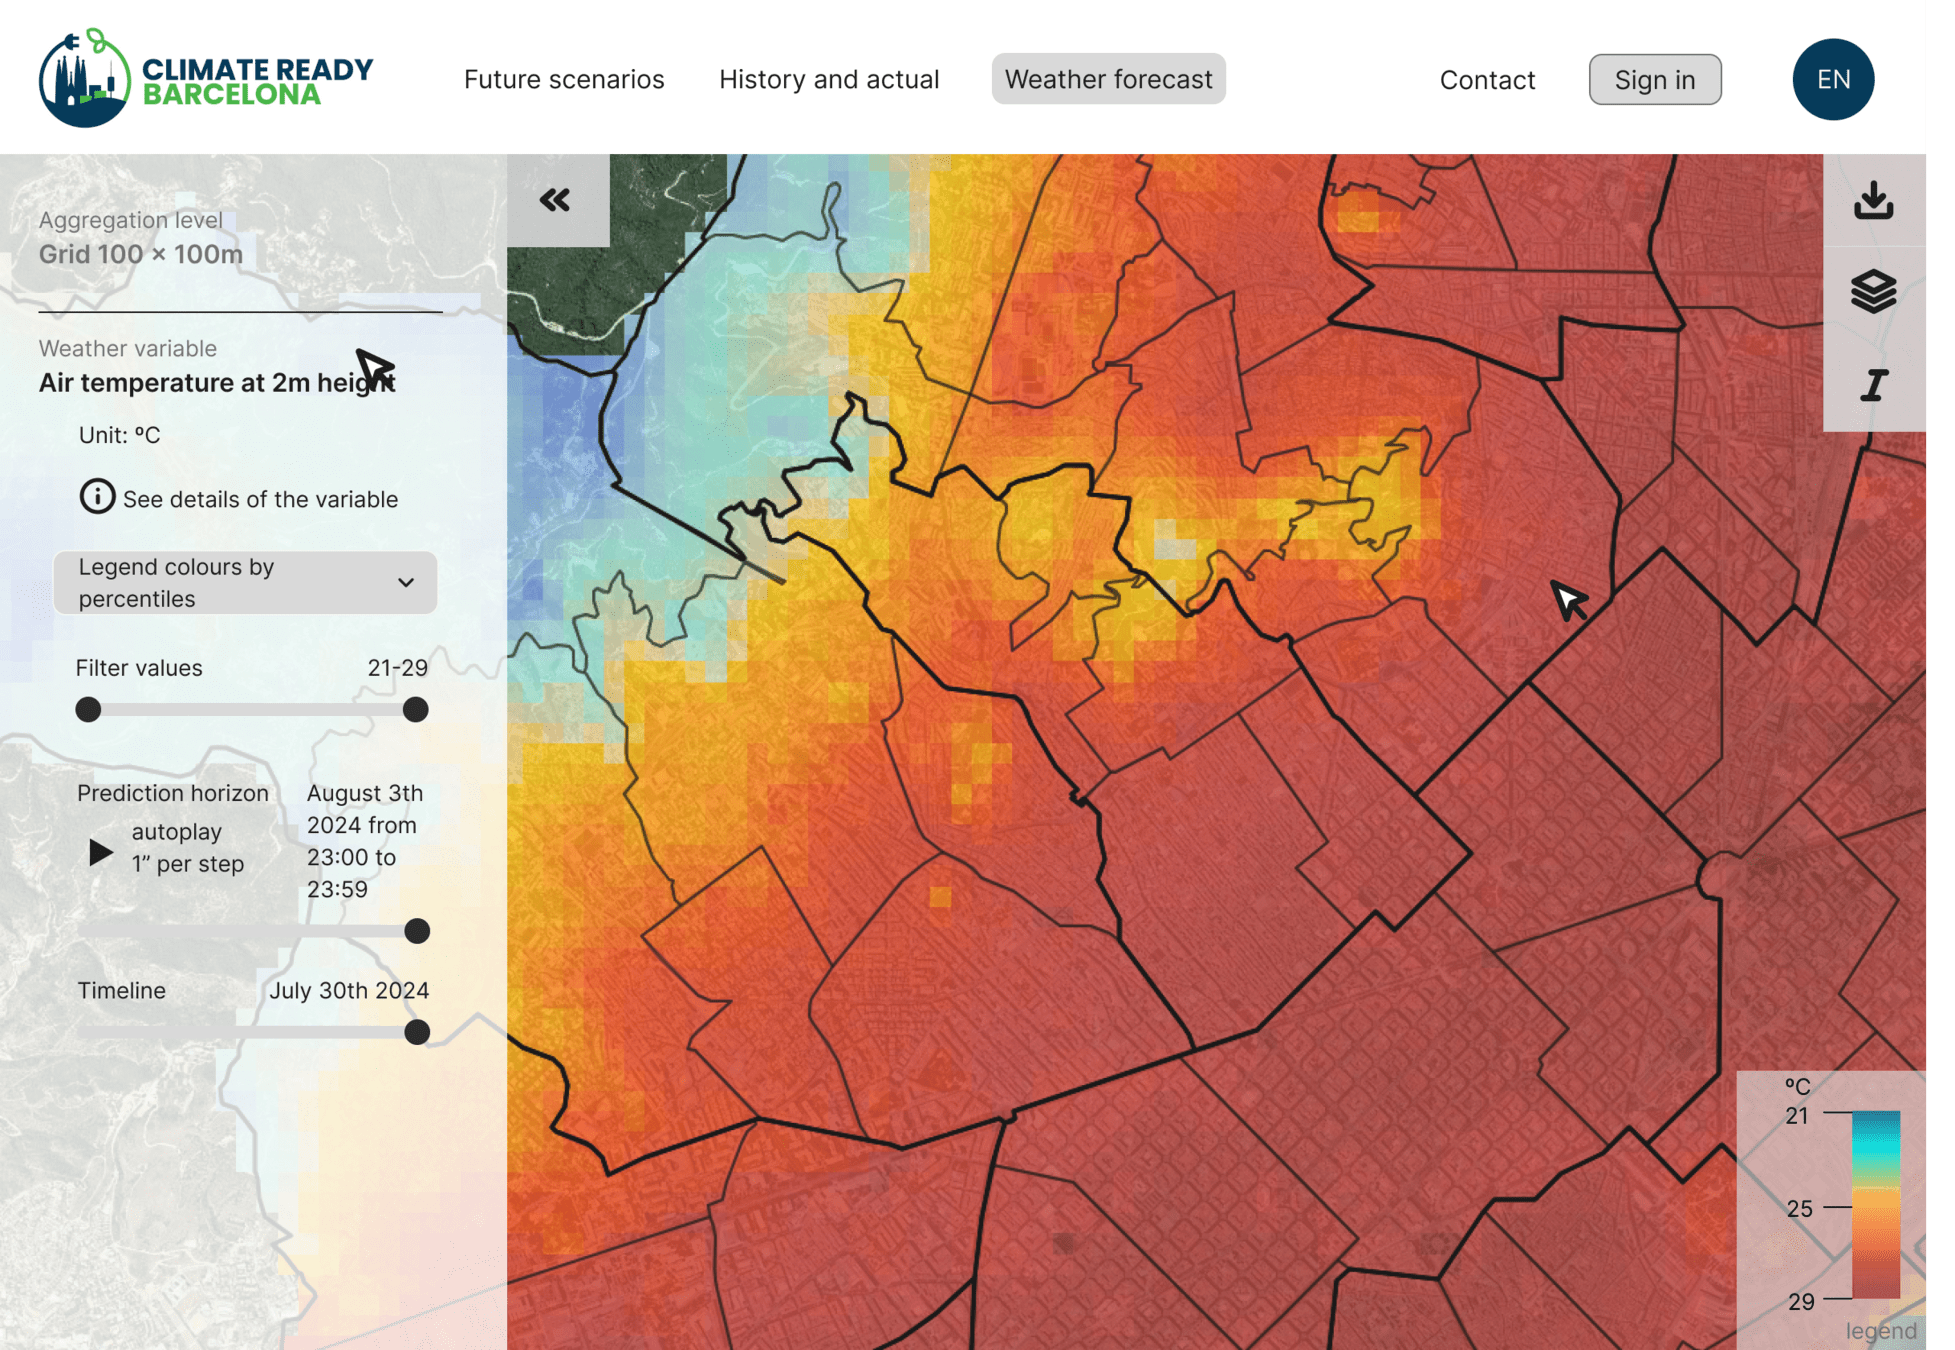
Interactive visualization
MindCity: Climate Vulnerability Map Visualization
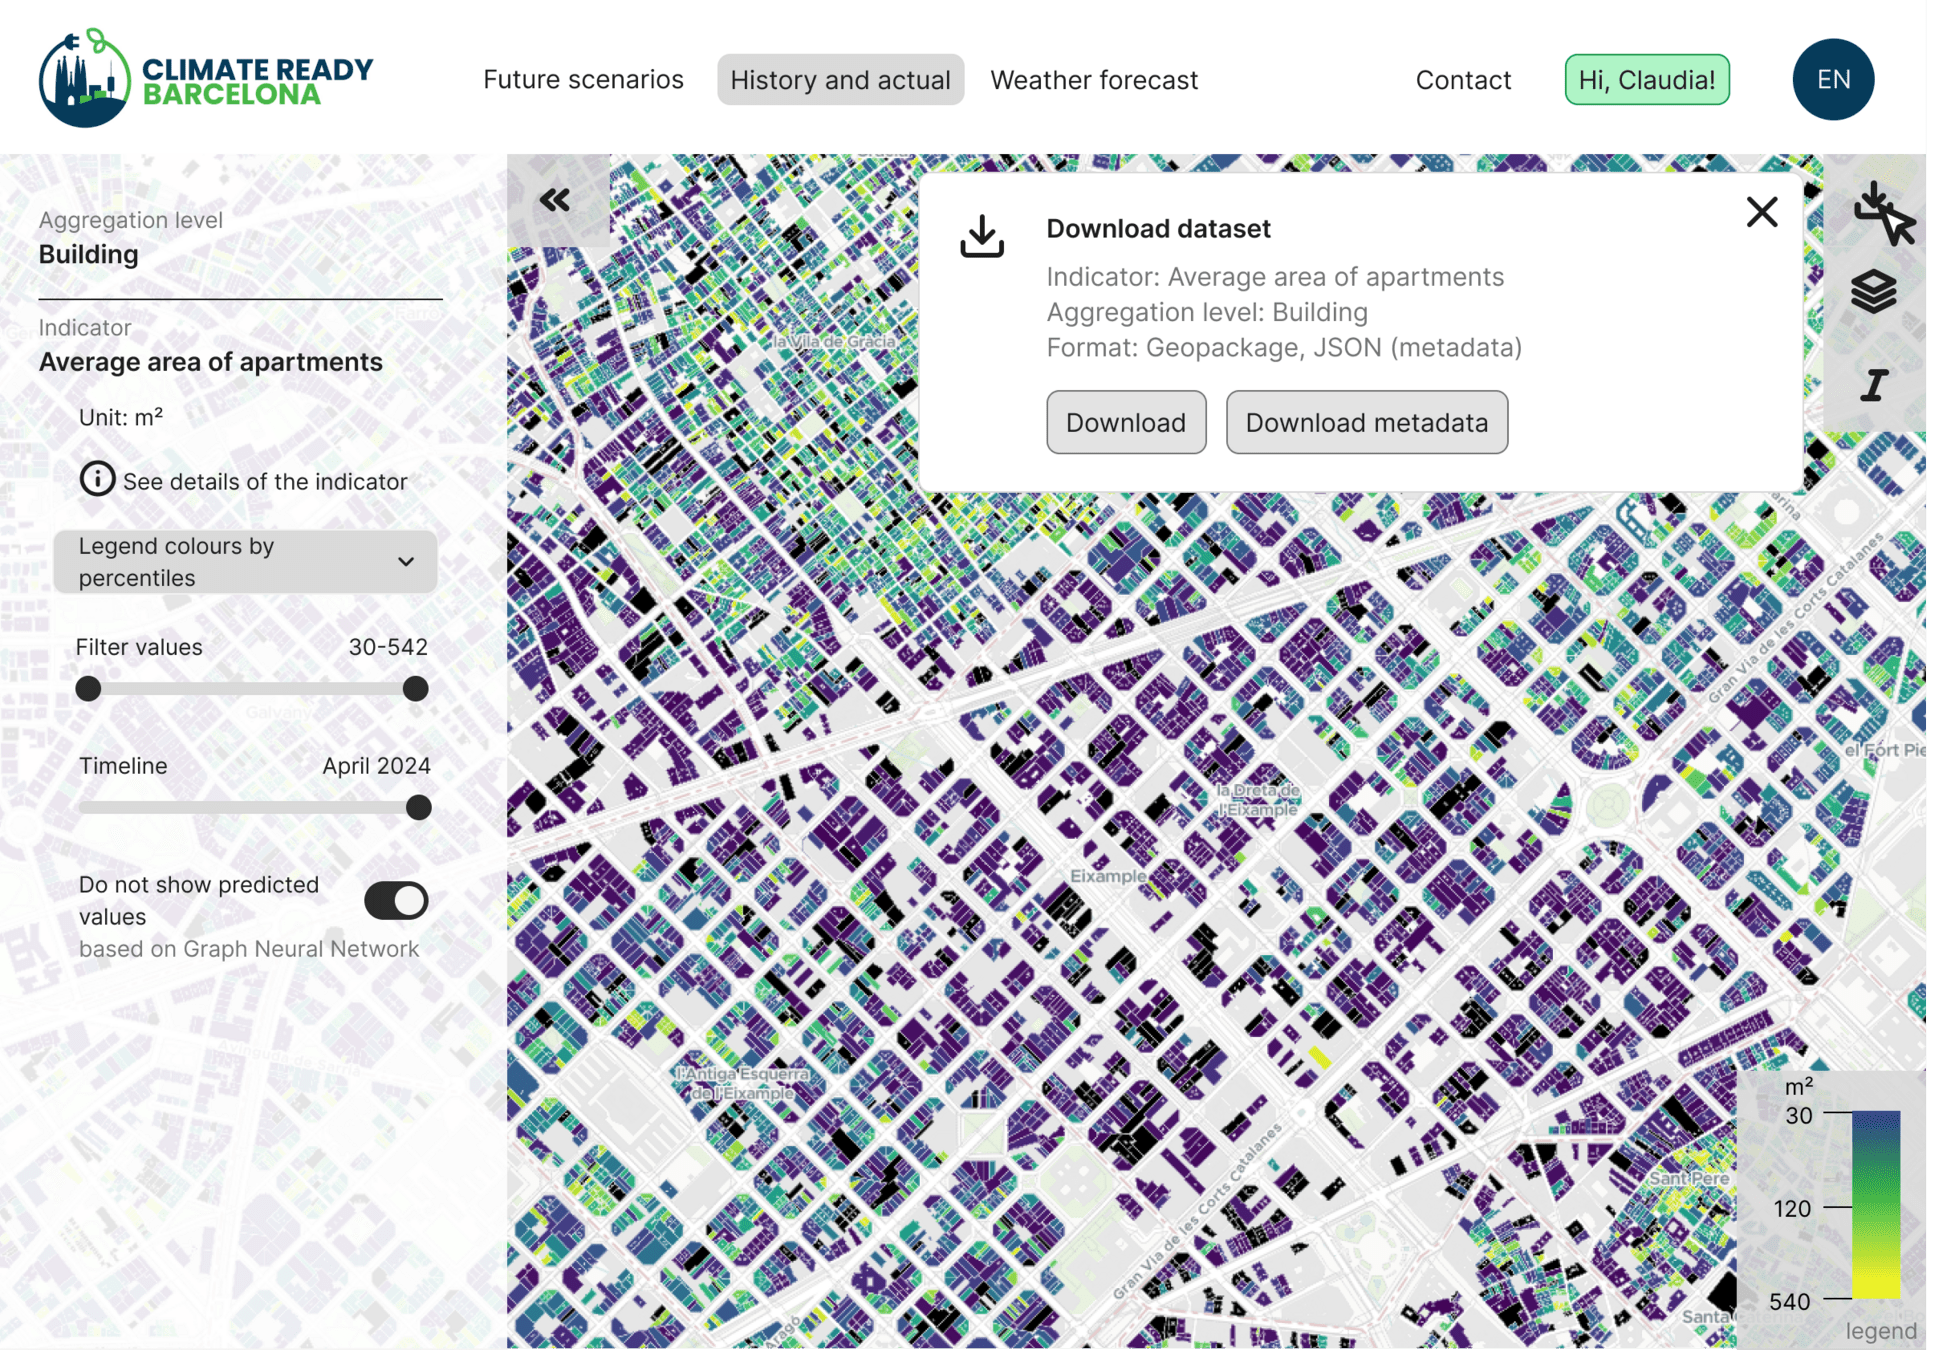
Export and data visualization
Vulnerability map
Vulnerability map
https://maps.climatereadybcn.eu/

Index evolution by streets and buildings
Queries and forecasts
Vulnerability map
MindCity: Climate Vulnerability Map Visualization
Thank you
Gerard Mor
Data Scientist in BEEGroup
gmor@cimne.upc.edu