Data Interpretation


Graphs & Analytics
Visual Data Analysis and Decision Making


Learning Outcome
5
Develop analytical decision-making capabilities
4
Perform quick data calculations
3
Compare trends and patterns visually
2
Analyse bar graphs, line graphs, and pie charts
1
Read and interpret graphical data accurately
Recall
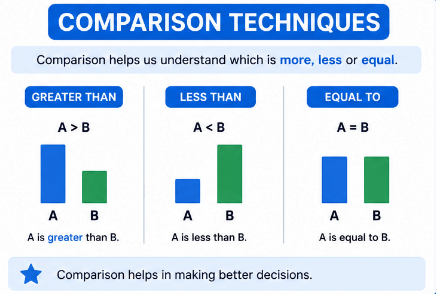
Why Use Graphs?
Graphs help:
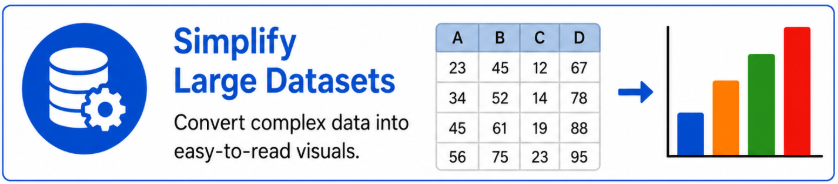
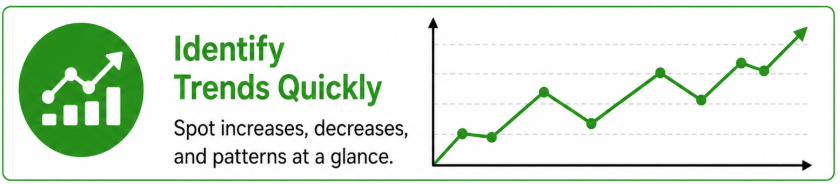
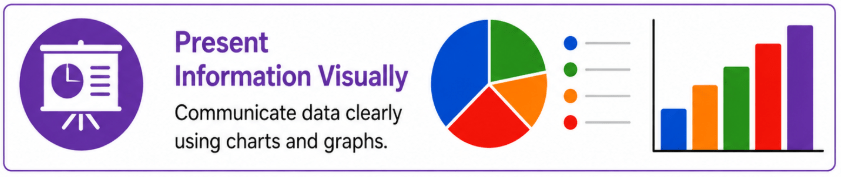
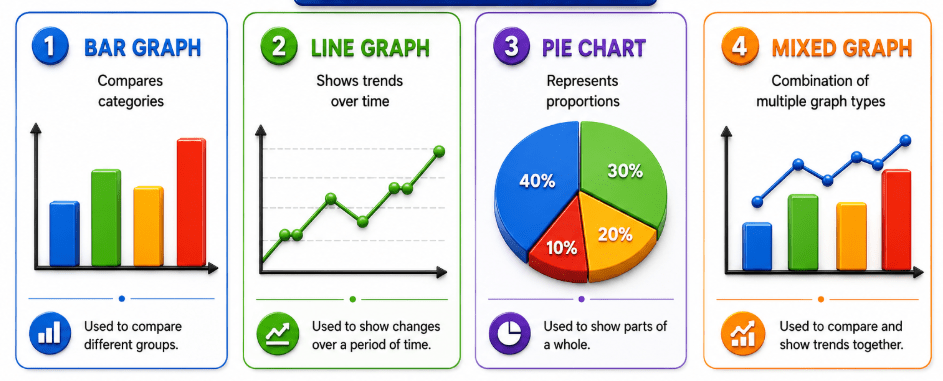
Introduction to Graphs & Analytics


Example Problem 1 – Bar Graph Interpretation
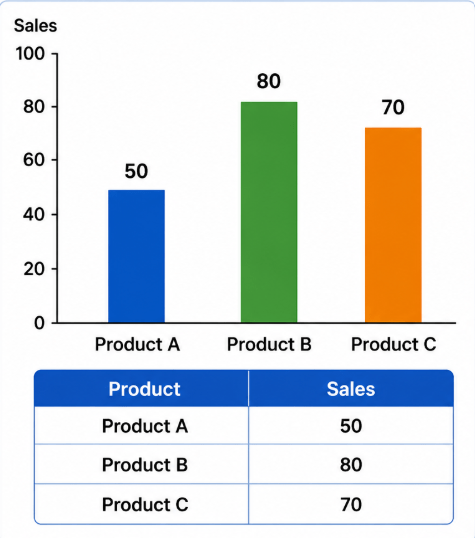
SALES DATA
Which product has the highest sales?
Question
Answer
Product B
Solution
Compare values:
50, 80, 70
Highest = 80
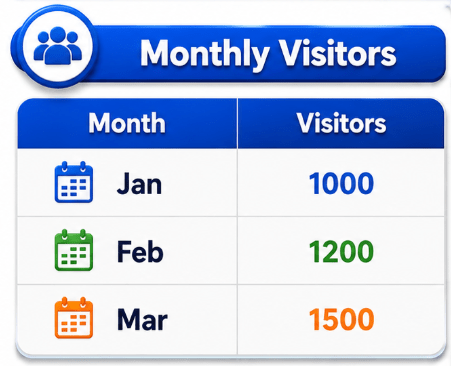
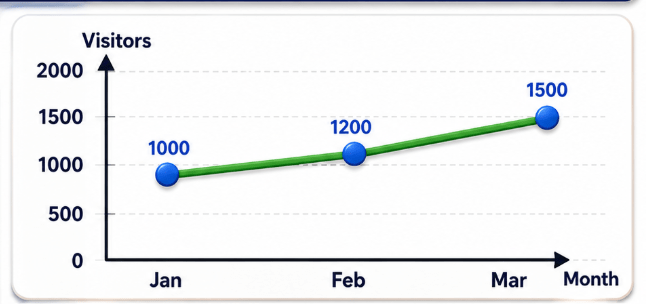
Example Problem 2 – Line Graph Interpretation



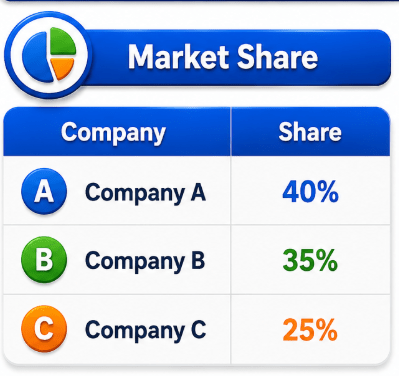
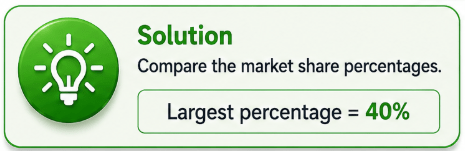
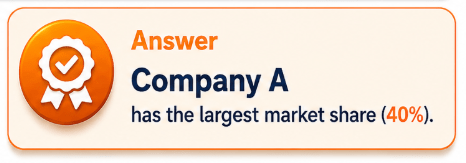
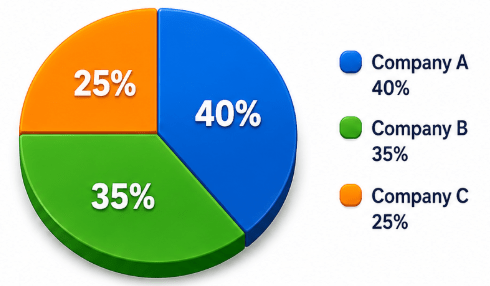
Example Problem 3 – Pie Chart Interpretation

Example Problem 4 – Analytical Comparison
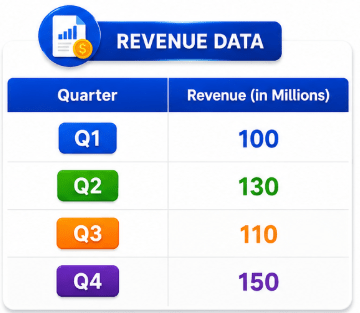



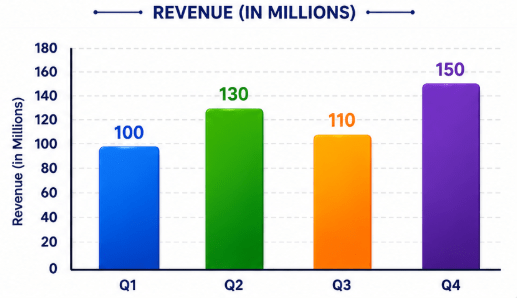
Example Problem 5 – Mixed Graph Analysis
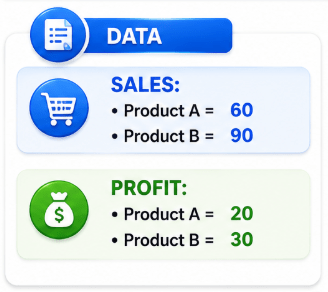
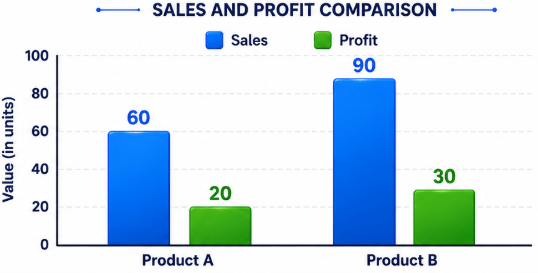


Example Problem 6 – Percentage Growth
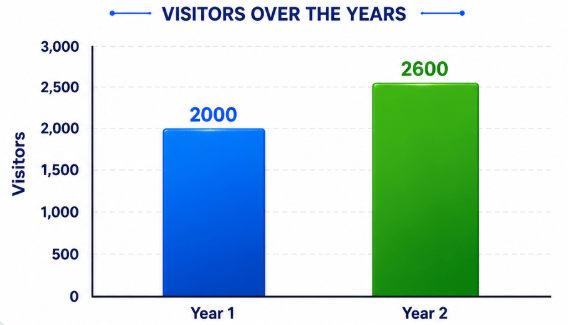
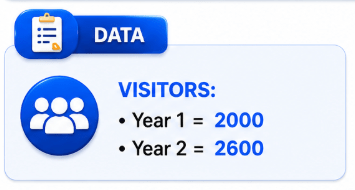
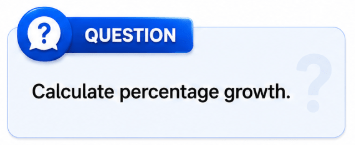

Practice Problems
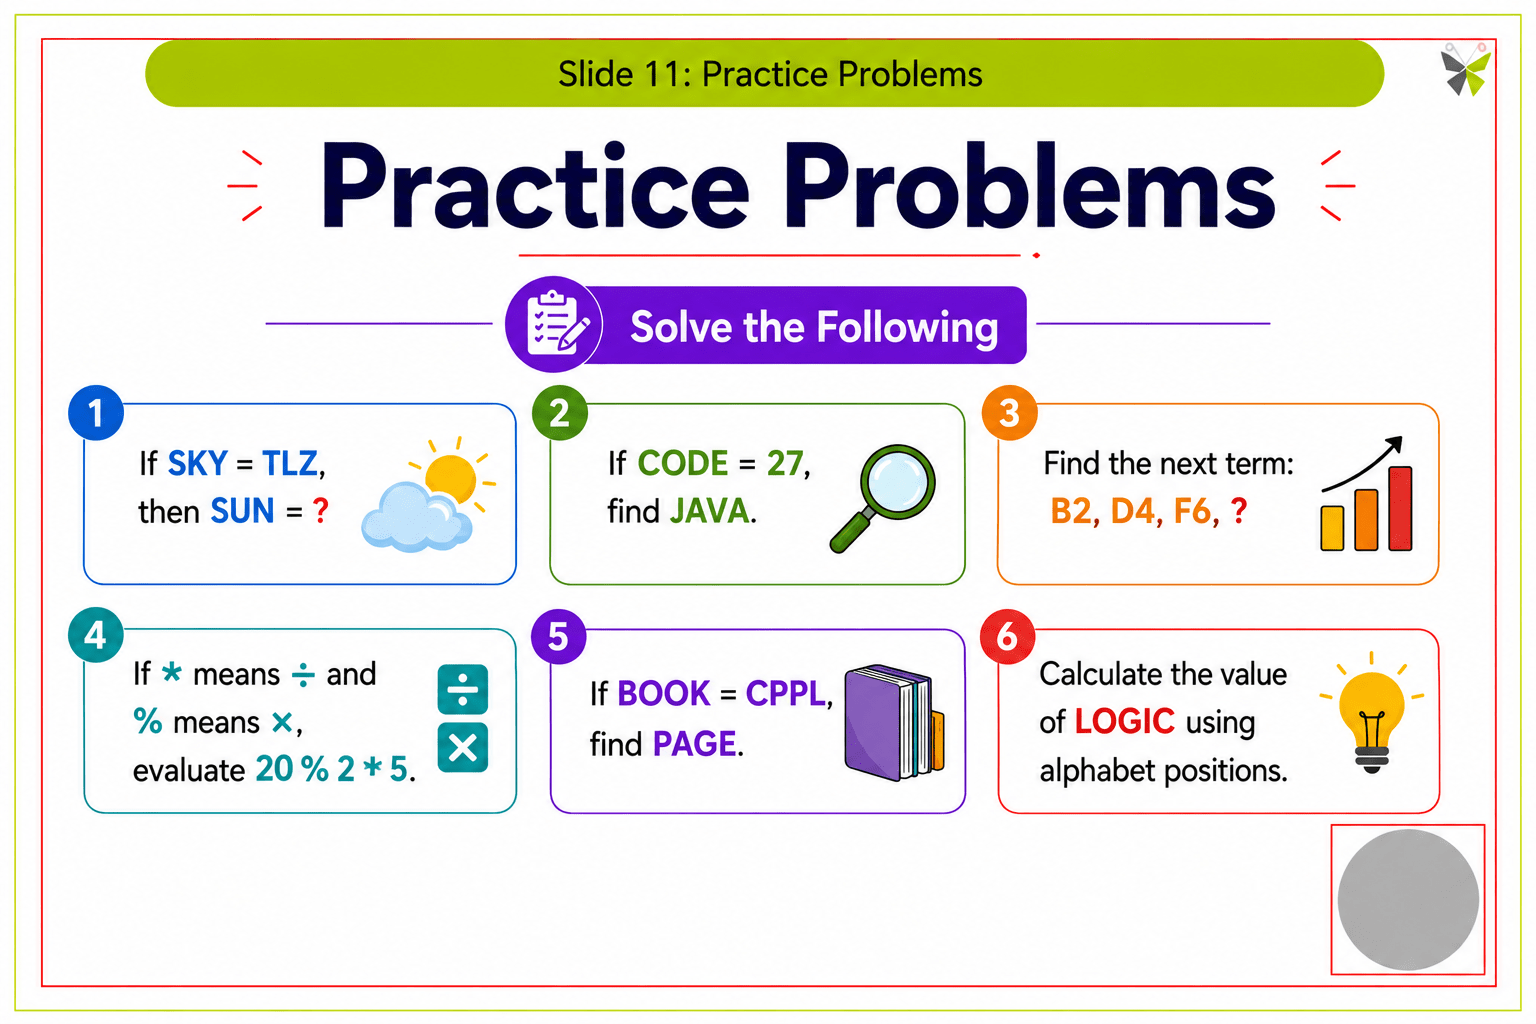
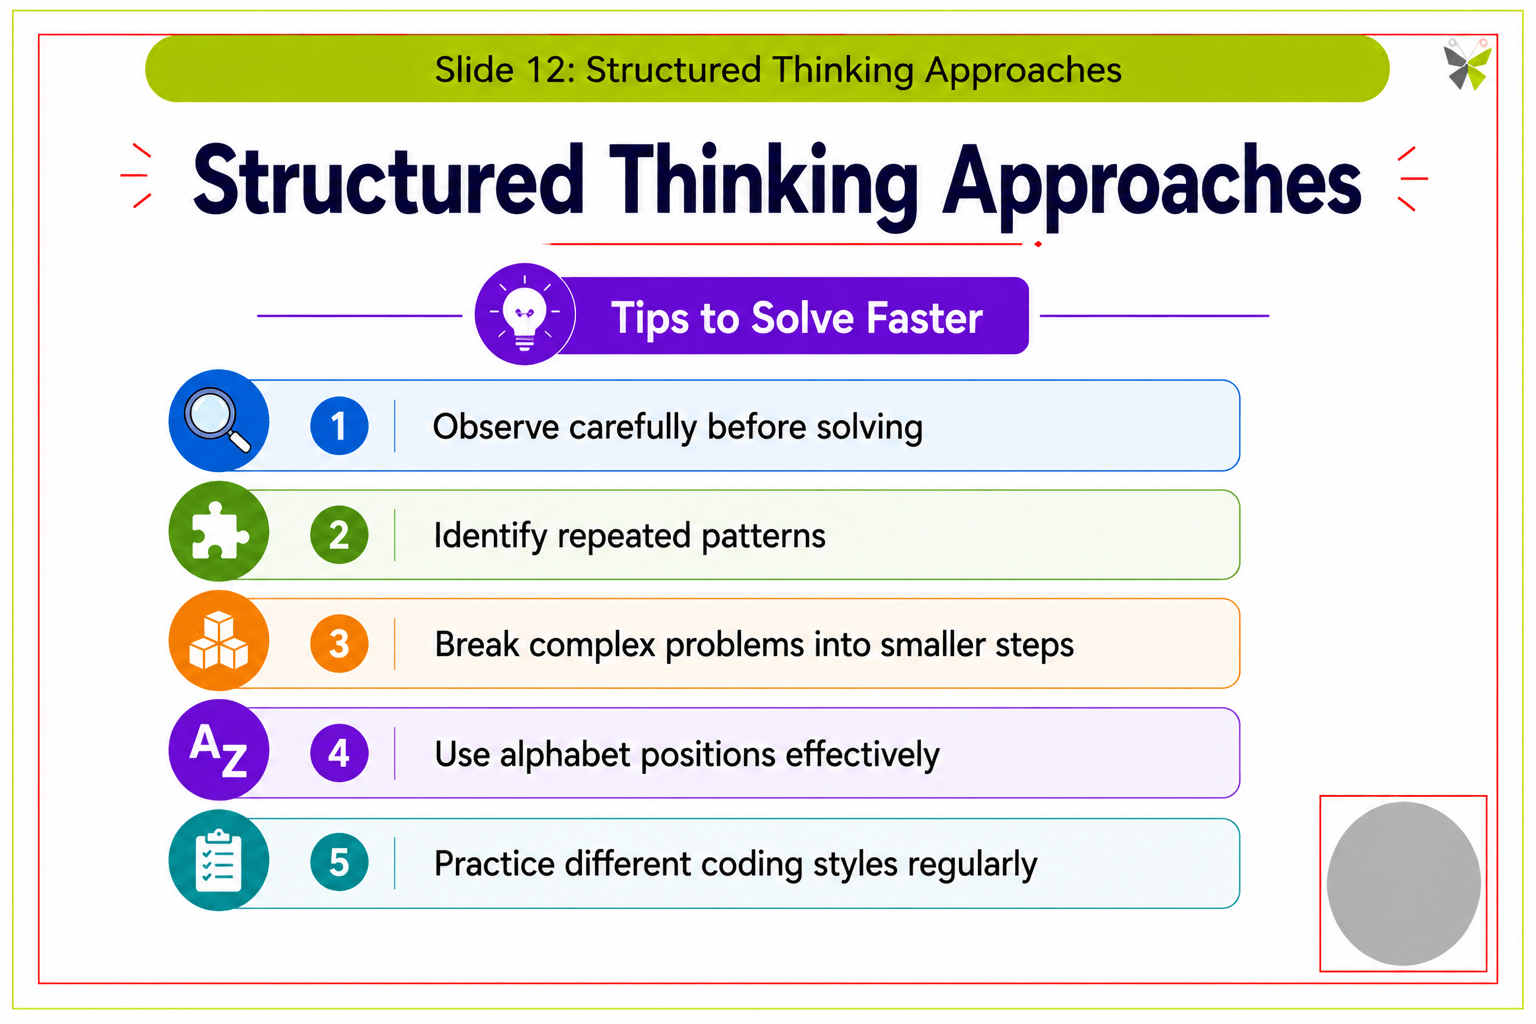
Structured Thinking Approaches
Key Takeaways
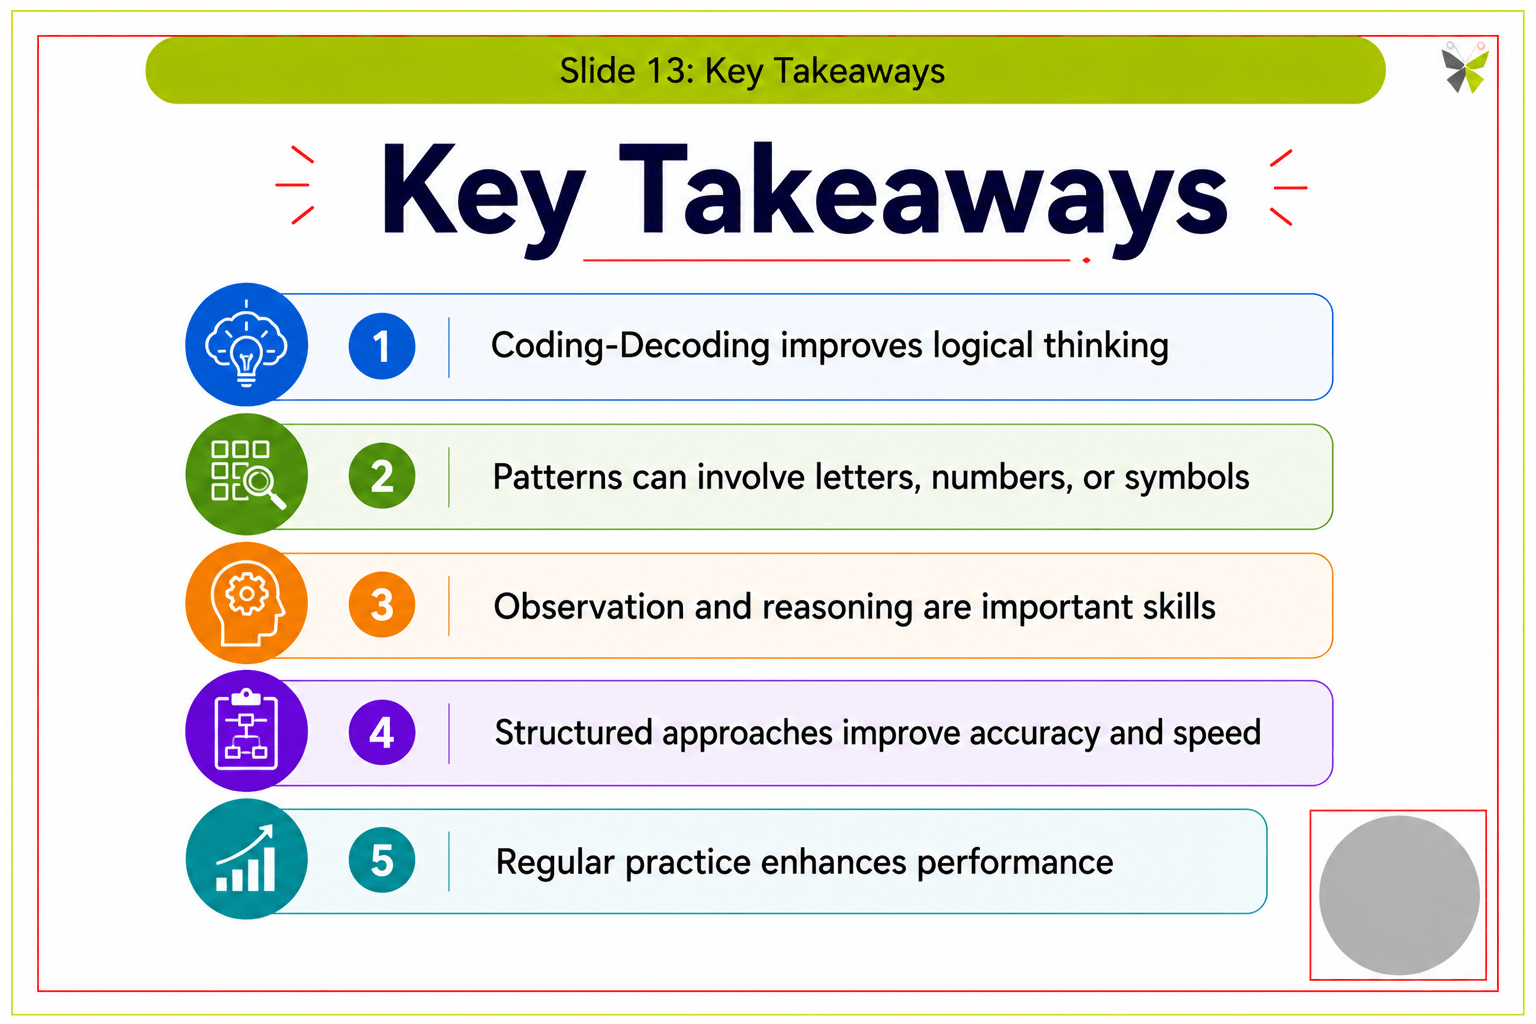
Summary
5
Developed analytical decision-making capabilities
4
Performed quick data calculations
3
Compared trends and patterns visually
2
Analysed bar graphs, line graphs, and pie charts
1
Read and interpreted graphical data accurately
Quiz
If CAT is coded as DBU, how is DOG coded?
A. EPH
B. DPH
C. EPG
D. FPH

Quiz-Answer
Which platform is mainly used for professional networking and B2B marketing ?
A. Facebook
B. Instagram
C. LinkedIn
D. Snapchat