Understand Data Distribution and Skewness

Business Scenario

Welcome!
Today is your tenth day as a Junior Data Analyst at a retail analytics company.
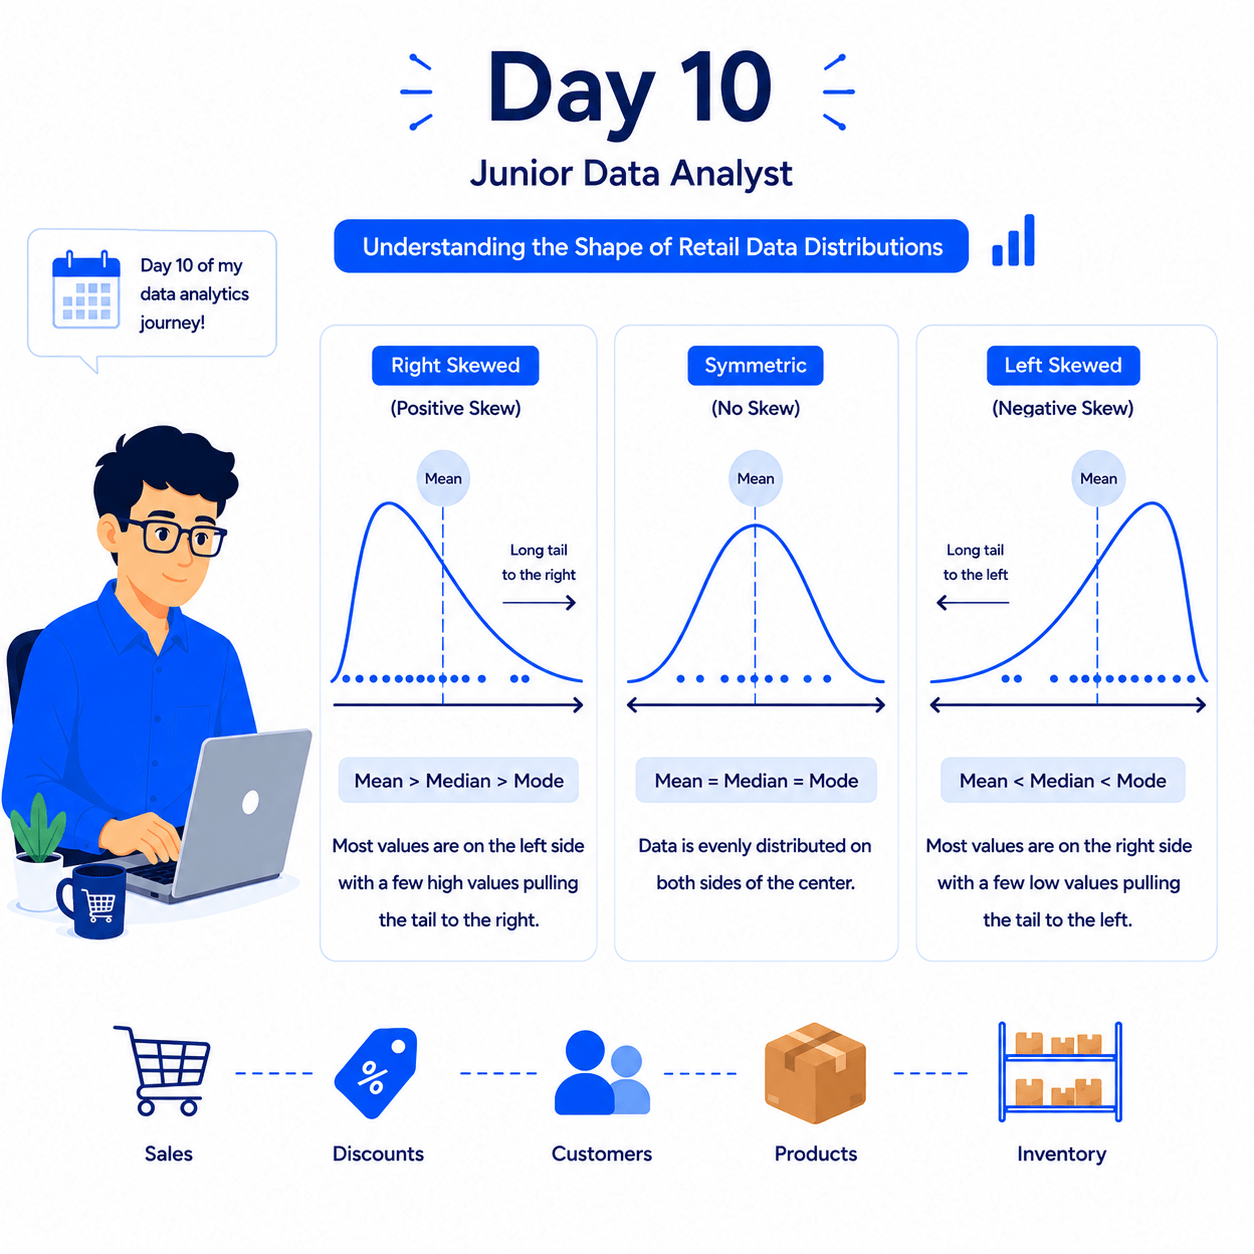
After measuring data spread using Variance and Standard Deviation, businesses also need to understand the shape of data distribution. Data may be distributed symmetrically or may be skewed toward higher or lower values.
Pre-Lab Preparation
Click here to download previous lab file: DM LAB 9

Git Pull
git pull origin branchNameTopic: Decoding Your Data
1) Decoding Skewness: Understanding Data Distribution
Understanding skewness helps analysts identify unusual sales patterns, customer purchasing behavior, inventory trends, and revenue distribution across retail operations.
Click to download Dataset : Retail_Dataset_Cleaned
Task 1: Understanding Skewness
management wants to know whether sales and operational metrics are evenly distributed or influenced by extreme values. This helps the company identify top-performing products, customer purchasing behavior, and operational inefficiencies.
Open Google Colab
1
2
Import Required Libraries
import pandas as pd
import numpy as np
3
Upload the Retail Dataset
4
Load Dataset Using Pandas
df = pd.read_csv("/content/Retail_Dataset_Modified.csv")

print("Dataset Loaded Successfully")
Display First Five Records
5
df.head()6
Check Dataset Information
df.info()7
Calculate Revenue Skewness
revenue_skew = df["Revenue"].skew()
print("Revenue Skewness:", revenue_skew)
8
Calculate Units Sold Skewness
units_skew = df["Units_Sold"].skew()
print("Units Sold Skewness:", units_skew)
9
8
Calculate Delivery Time Skewness

delivery_skew = df["Delivery_Time"].skew()
print("Delivery Time Skewness:", delivery_skew)
10
Compare Skewness Values
comparison = pd.DataFrame({
    "Metric": ["Revenue",
               "Units Sold",
               "Delivery Time"],
    "Skewness": [revenue_skew,
                 units_skew,
                 delivery_skew]
})

comparison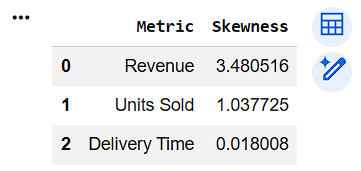
Great job!
You have successfully completed your lab on Measure Data Spread Using Dispersion Metrics.
Checkpoint
In this lab, you have: Calculated Variance for business metrics, Measured Standard Deviation of sales data, Analyzed Revenue variability, Evaluated Inventory fluctuations, Examined Customer Satisfaction consistency, Compared dispersion across multiple retail metrics, Extracted meaningful insights from data spread
You are now ready to move to the next stage of Junior Data Analyst.
Git Push
git push origin branchNameNext-Lab Preparation
Topic: Decoding Your Data
1) Decoding Skewness: Understanding Data Distribution