Perform Advanced Matrix Operations Using NumPy

Business Scenario

Welcome!
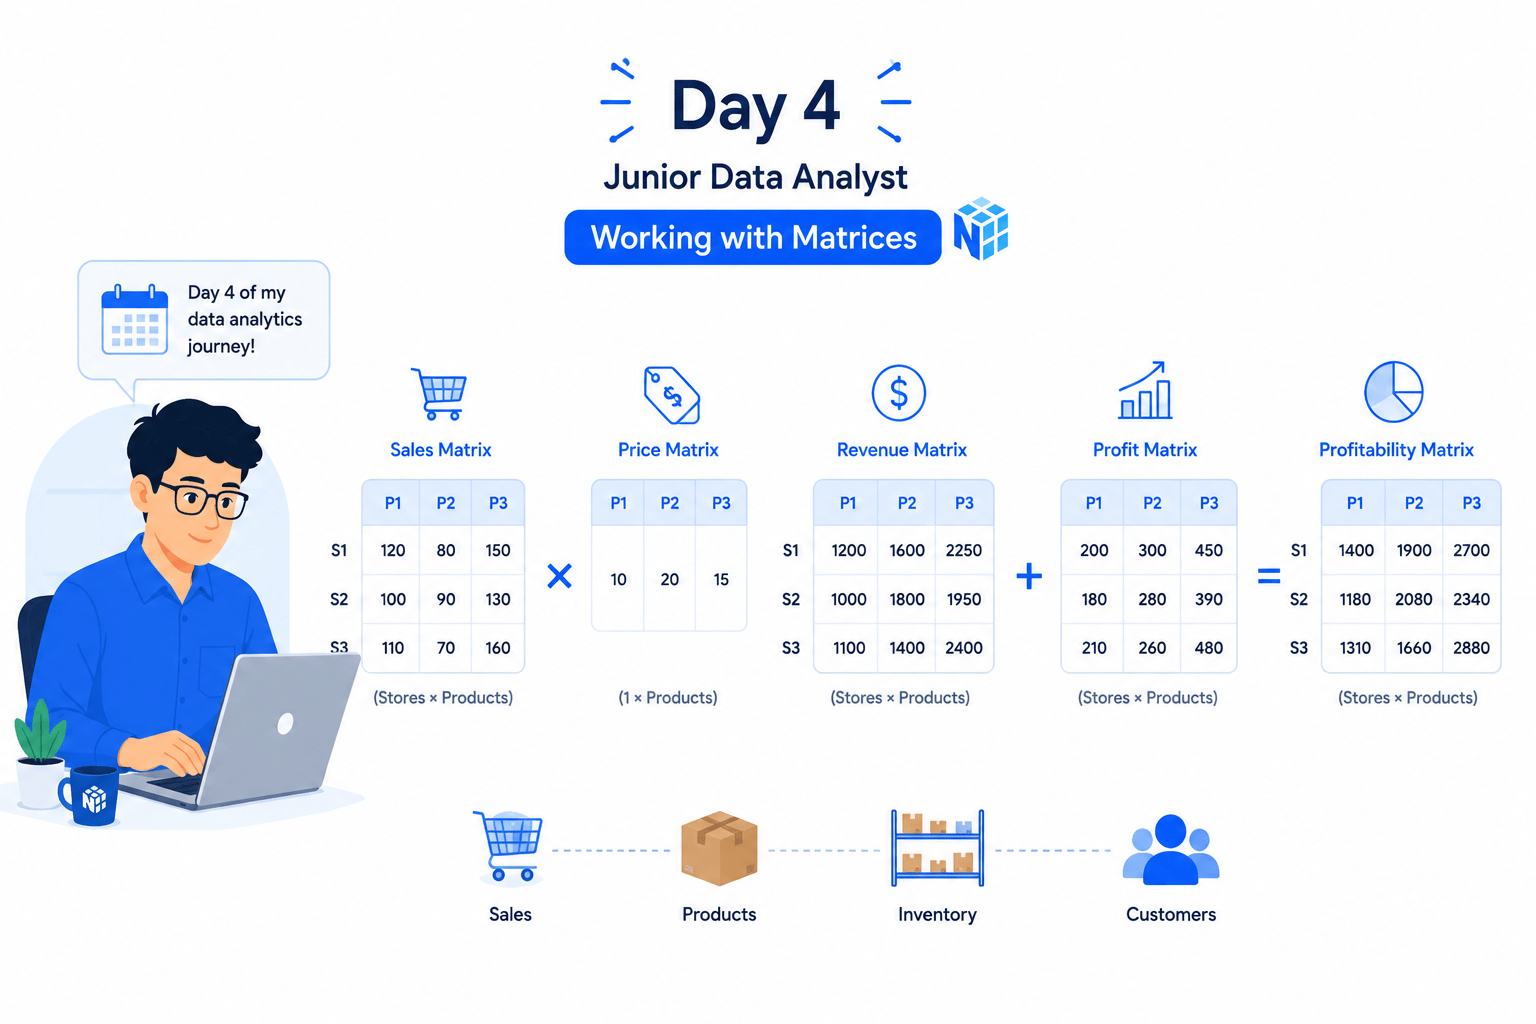
Today is your fourth day as a Junior Data Analyst at a retail analytics company.
Retail businesses often organize sales, profit, inventory, and customer information into matrix structures. Data analysts use matrix operations to perform calculations, compare business metrics, and transform data efficiently for advanced analysis.
Pre-Lab Preparation
Topic : Essential Array Operations with NumPy
1) The Matrix Toolkit
git pull origin branchName
Git Pull
Click to download Dataset : Retail_Dataset
Click here to download previous lab file: DM LAB 2
Task 1: Apply Indexing and Slicing
In retail analytics, multiple business metrics such as Revenue, Units Sold, Profit Margin, and Shipping Cost can be represented as matrices. Matrix operations allow analysts to perform calculations across large datasets efficiently.
What is a Matrix?
A matrix is a two-dimensional arrangement of data organized into rows and columns.
Matrix operations are mathematical computations performed on matrices, such as addition, multiplication, transposition, and aggregation.
Open Google Colab
1
2
Import Required Libraries
import pandas as pd
import numpy as np
Upload the Retail Dataset
3
Load Dataset Using Pandas
5

df = pd.read_csv("/content/Retail_Dataset_Modified.csv")

print("Dataset Loaded Successfully")
4
Create NumPy Array from Revenue Column
revenue_array = np.array(df["Revenue"])

print(revenue_array)
7
6
Access the First Revenue Value Using Indexing
print("First Revenue Value:")
print(revenue_array[0])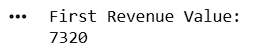
Access the Last Revenue Value
print("Last Revenue Value:")
print(revenue_array[-1])
8
Slice the First Five Revenue Records
print("First Five Revenue Values:")
print(revenue_array[0:5])
9
Slice Revenue Values from Index 10 to 20
print("Revenue Values from Index 10 to 20:")
print(revenue_array[10:21])
11
10
Create a Two-Dimensional Array
sales_array = np.array(df[["Units_Sold", "Profit_Margin"]])

print(sales_array)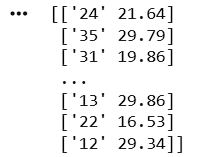
Access the First Row of the Array
print("First Row:")
print(sales_array[0])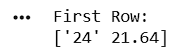
Activity
Create a NumPy array using the Shipping_Cost column and perform the following operations:
- Display the first value.
- Display the last value.
- Display the first five records using slicing.
Task 2: Perform Operations
12
Access the Profit Margin Column

print("Profit Margin Column:")
print(sales_array[:,1])
1
After extracting data using indexing and slicing, analysts often perform calculations on selected portions of data to identify trends and business performance.
Display the First 10 Revenue Values
first_ten = revenue_array[0:10]
print(first_ten)
2
Find Total Revenue of First 10 Records
print("Total Revenue:")
print(np.sum(first_ten))
3

Find Highest Revenue from First 10 Records
print("Maximum Revenue:")
print(np.max(first_ten))
4
Find Lowest Revenue from First 10 Records
print("Lowest Revenue:")
print(np.min(first_ten))
Great job!
You have successfully completed your lab on Apply Indexing and Slicing for Data Analysis.In this lab, you have: Created NumPy arrays from retail data, Applied indexing techniques to access individual elements, Used slicing to retrieve ranges of records.
You are now ready to move to the next stage of Junior Data Analyst.
Checkpoint
Next-Lab Preparation
Git Push
git push origin branchNameTopic: Essential Array Operations with NumPy
1) The Matrix Toolkit