Analyze Data Using Descriptive Statistics

Business Scenario

Welcome!
Today is your eighth day as a Junior Data Analyst at a retail analytics company.
Retail businesses generate huge amounts of data every day through sales transactions, customer purchases, inventory updates, and product performance records. Before making business decisions, analysts must understand the overall characteristics of the data.
Descriptive Statistics helps analysts summarize large datasets into meaningful information.
By calculating measures such as Mean, Median, Mode, Minimum, Maximum, and Standard Deviation, analysts can quickly understand customer behavior, sales trends, and product performance.

Pre-Lab Preparation
Topic: Decoding Your Data
1) Unraveling the World of Data and Its Insights
2) The Basics of Statistics: Descriptive Insights
Click here to download previous lab file: DM LAB 7

Git Pull
git pull origin branchNameClick to download Dataset : Retail_Dataset_Cleaned
Task 1: Mean, Median and Mode Analysis
Retail organizations continuously generate large amounts of sales, inventory, customer, and operational data. Looking at individual records alone makes it difficult to understand overall business performance. Data analysts use descriptive statistics to summarize data and identify patterns quickly.

Three of the most important measures used in descriptive statistics are Mean, Median, and Mode.
What is Descriptive Statistics?
Descriptive Statistics is the process of summarizing and describing the main characteristics of a dataset.
Open Google Colab
1
2
Import Required Libraries
import pandas as pd
import numpy as np
3
Upload the Retail Dataset
4
Load Dataset Using Pandas
df = pd.read_csv("/content/Retail_Dataset_Modified.csv")

print("Dataset Loaded Successfully")
Display First Five Records
5
df.head()6
Check Dataset Information
df.info()7
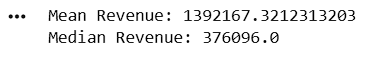
Calculate Mean Revenue
The Mean represents the average value.
Mean = Sum of Values / Number of Values
Formula
mean_revenue = df["Revenue"].mean()

print("Mean Revenue:", mean_revenue)
Calculate Median Revenue
The Median is the middle value after sorting data.
8
median_revenue = df["Revenue"].median()

print("Median Revenue:", median_revenue)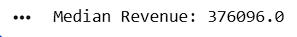
9
8
Compare Mean and Median
comparison = pd.DataFrame({
    "Statistic": ["Mean Revenue", "Median Revenue"],
    "Value": [mean_revenue, median_revenue]
})

comparison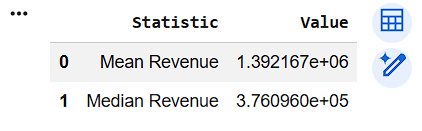
Calculate Mean Units Sold
10
mean_units = df["Units_Sold"].mean()

print("Average Units Sold:", mean_units)
Calculate Median Delivery Time
11
median_delivery = df["Delivery_Time"].median()

print("Median Delivery Time:", median_delivery)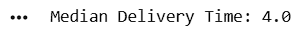
Calculate Mode Product Category
12
mode_category = df["Category"].mode()

print("Most Common Product Category:")
print(mode_category)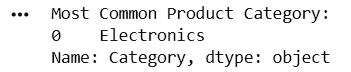
Display Statistical Results
print("Mean Revenue:", mean_revenue)
print("Median Revenue:", median_revenue)
13
Task 2: Statistical Summaries
After understanding individual statistical measures such as Mean, Median, and Mode, analysts often need a complete overview of the dataset. Calculating each statistic separately can be time-consuming, especially when working with large datasets.
Why Statistical Summaries?
Instead of calculating statistics one by one, Pandas provides a quick summary of numerical data using describe().

Generate Summary Statistics
1
df.describe()2
Summary of Revenue and Profit Margin
df[[
    "Revenue",
    "Profit_Margin"
]].describe()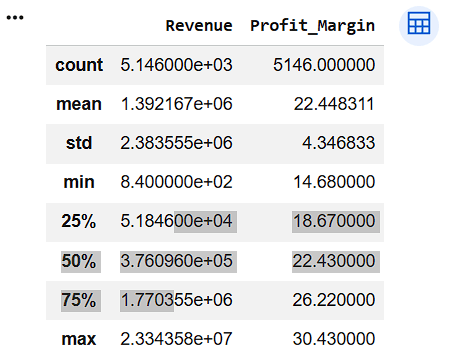
3
Summary of Inventory Data
df[[
    "Quantity_Available",
    "Units_Sold"
]].describe()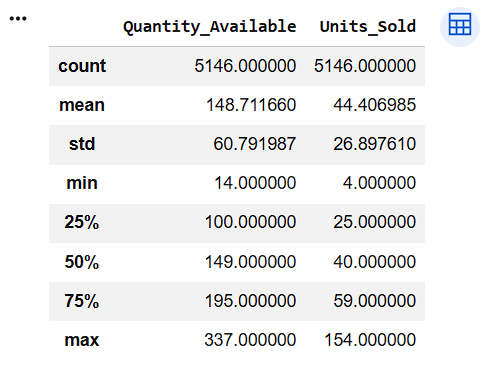
4
Summary of Customer Satisfaction
df[[
    "Customer_Satisfaction"
]].describe()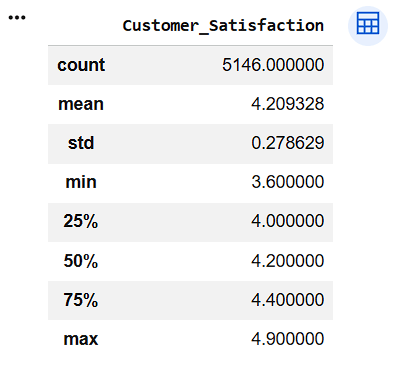
Generate Summary for All Columns
5
df.describe(include="all")6
Calculate Range of Revenue
revenue_range = (
    df["Revenue"].max() -
    df["Revenue"].min()
)

print("Revenue Range:", revenue_range)
Calculate Standard Deviation of Revenue
revenue_std = df["Revenue"].std()

print("Revenue Standard Deviation:", revenue_std)
Calculate Variance of Revenue
revenue_variance = df["Revenue"].var()

print("Revenue Variance:", revenue_variance)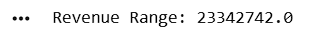
7
8

Create Summary Table
summary_table = pd.DataFrame({
    "Statistic": [
        "Mean Revenue",
        "Median Revenue",
        "Revenue Std Dev",
        "Revenue Variance"
    ],
    "Value": [
        df["Revenue"].mean(),
        df["Revenue"].median(),
        df["Revenue"].std(),
        df["Revenue"].var()
    ]
})

summary_table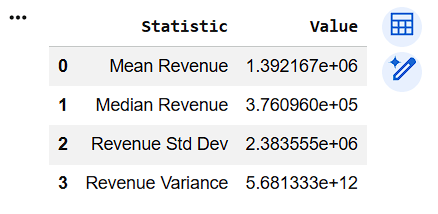
9
8
Verify Dataset Information
df.info()10
Great job!
You have successfully completed your lab on Analyze Data Using Descriptive Statistics. In this lab, you have:Calculated Mean, Median, and Mode, Generated statistical summaries using describe(), Analyzed key business metrics, Measured data spread using Range, Variance, and Standard Deviation, Extracted meaningful insights from data
You are now ready to move to the next stage of Junior Data Analyst.
Checkpoint
Git Push
git push origin branchNameNext-Lab Preparation
Topic: Decoding Your Data
1) Measuring Data Spread: Dispersion Insights