Building Interactive Dashboards

Drill-Down Reports and Visual Best Practices


Learning Outcome
5
Combine drill-down functionality with effective visual design
4
Apply visual best practices for clarity and usability
3
Design reports that support multi-level exploration
2
Identify when drill-down reporting is appropriate
1
Explain what drill-down reports are
Learners should know....
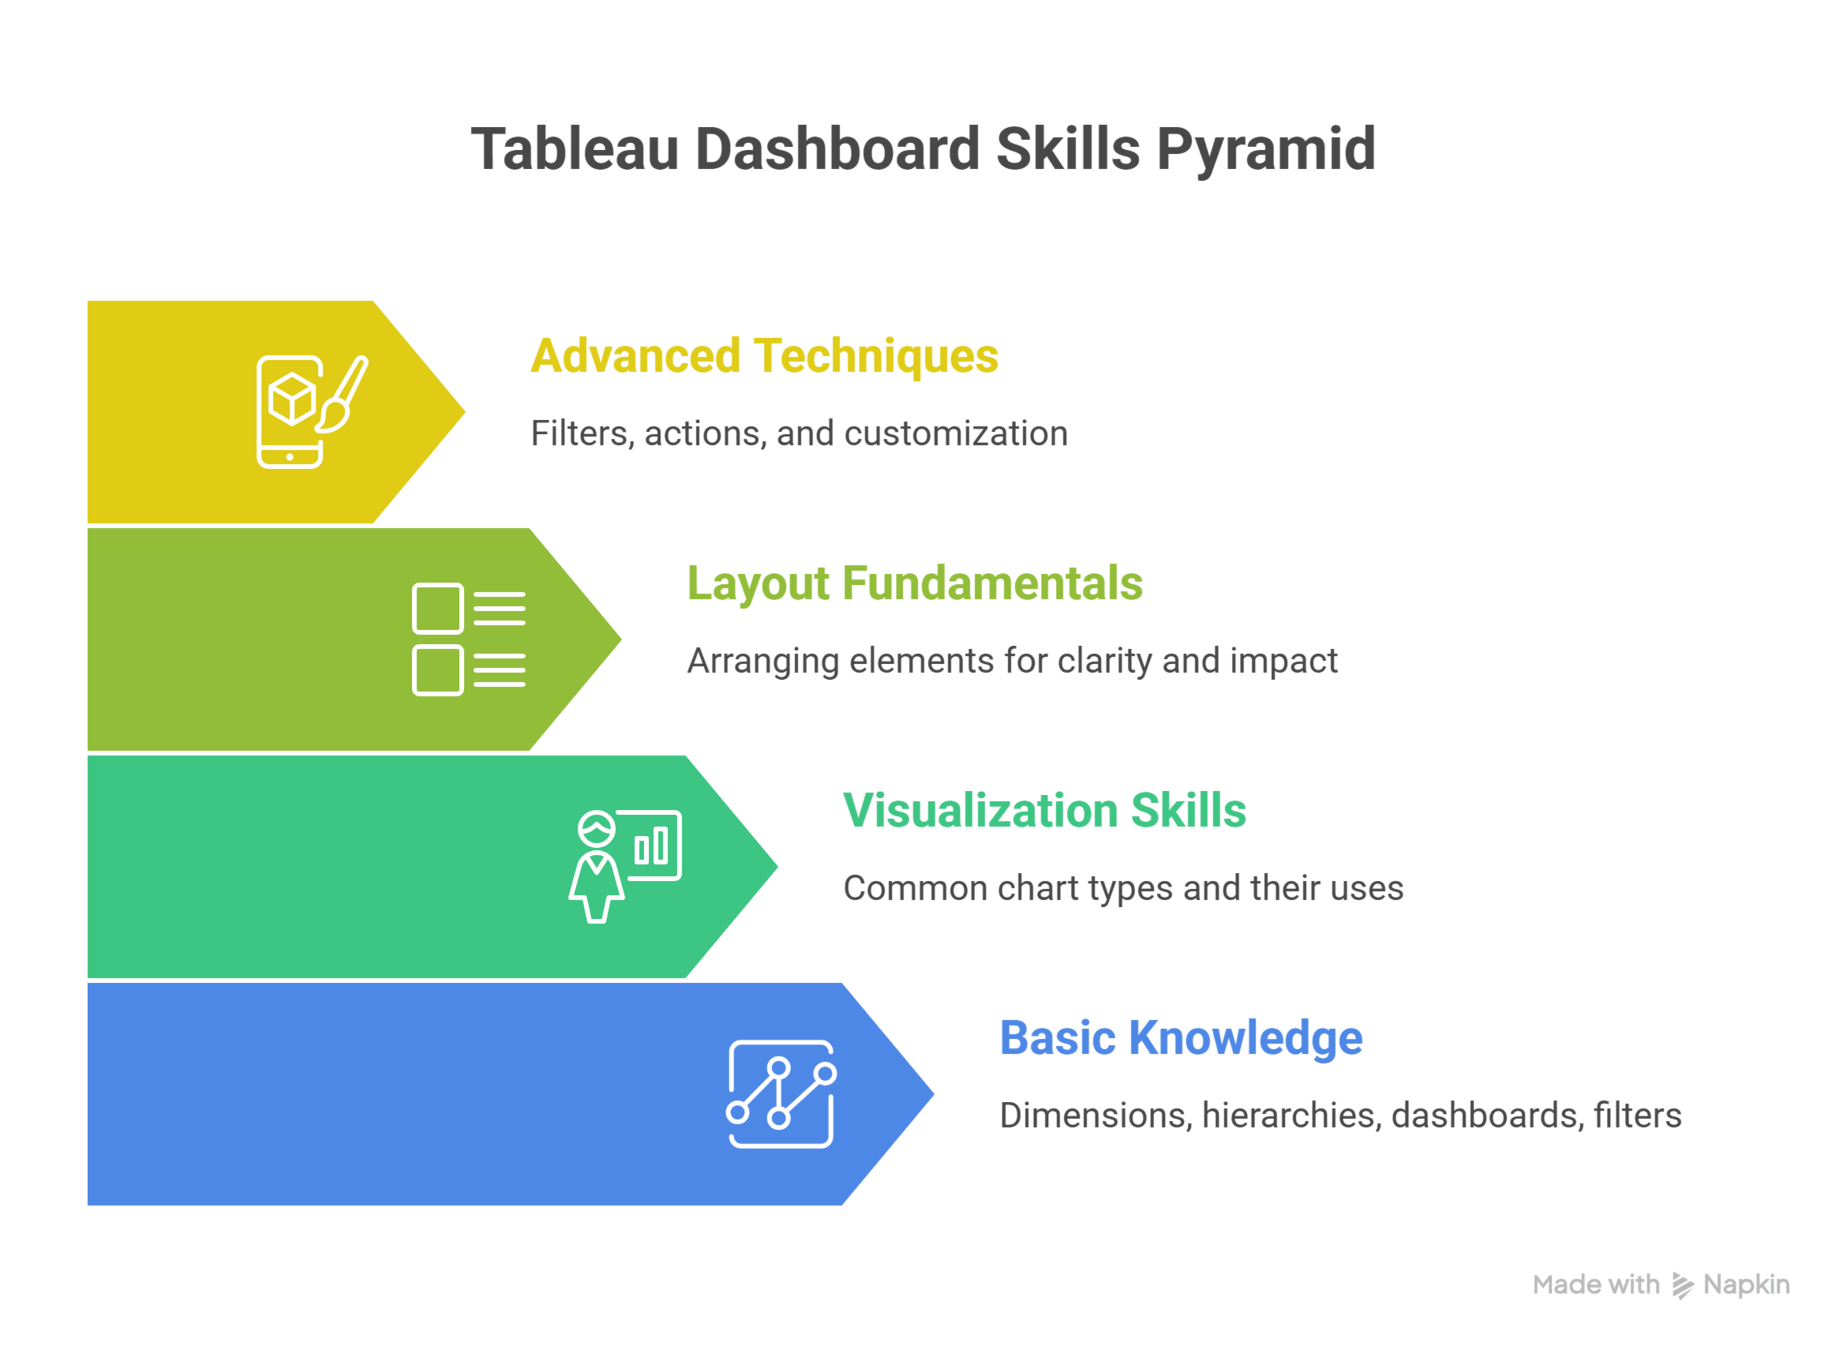
Advanced Techniques: Filters, actions, and customization
Layout Fundamentals: Arranging elements for clarity and impact
Visualization Skills: Common chart types and
their uses
Basic Knowledge: Dimensions, hierarchies, dashboards, filters
You’re looking at a map...
At first, you see only States
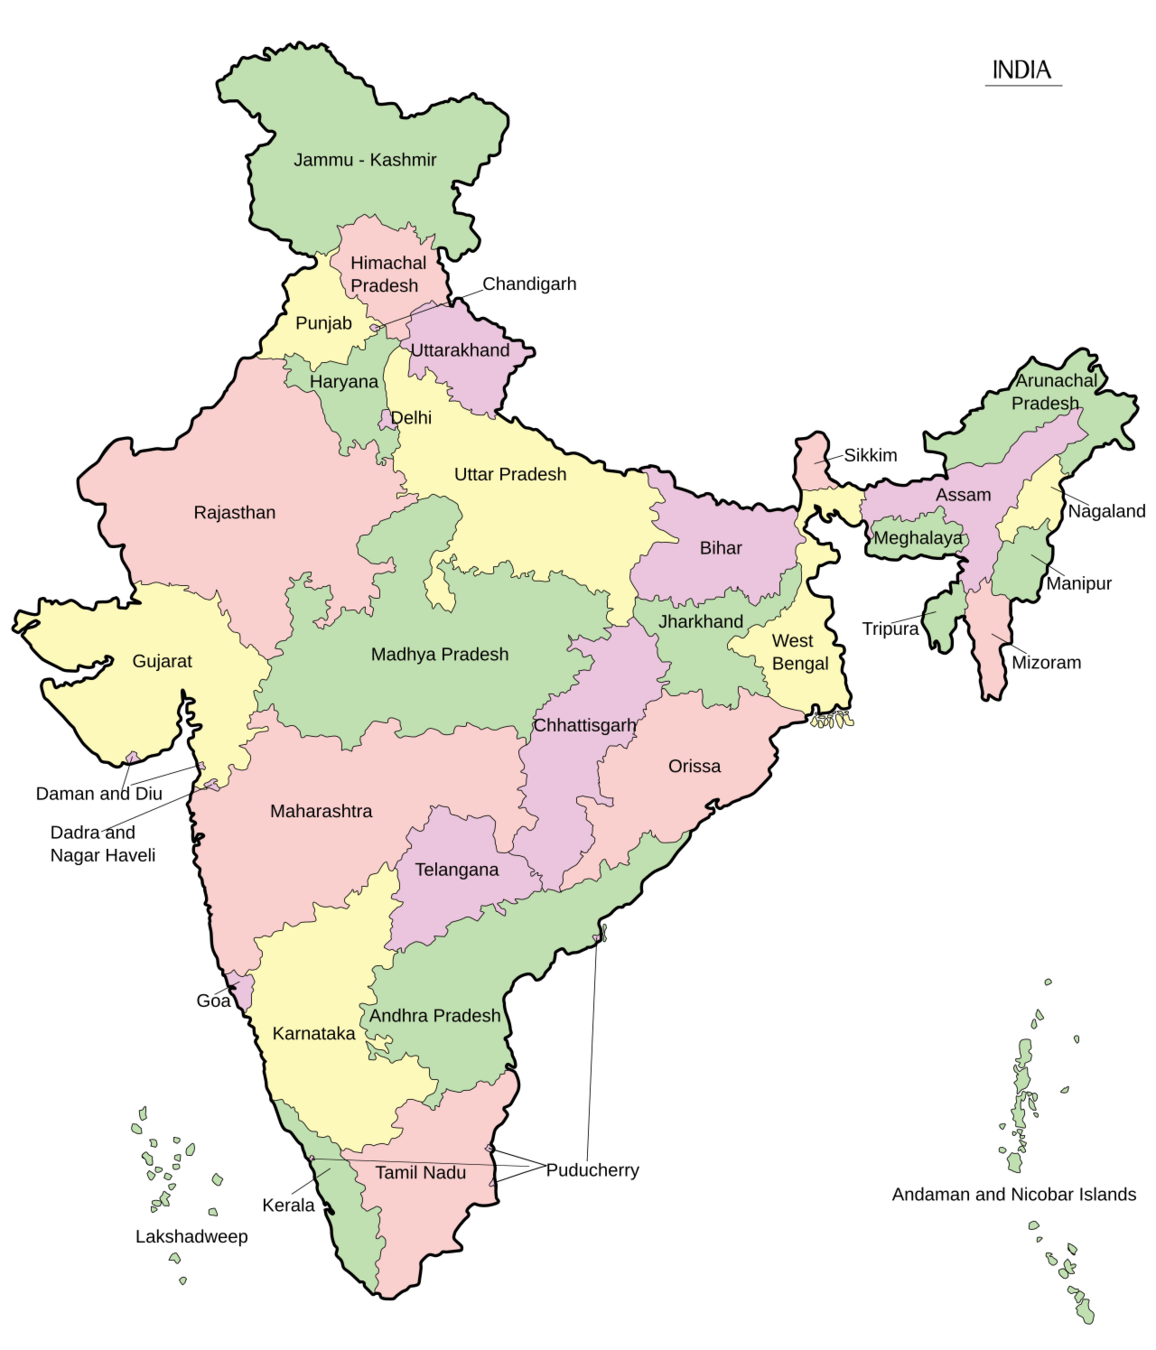
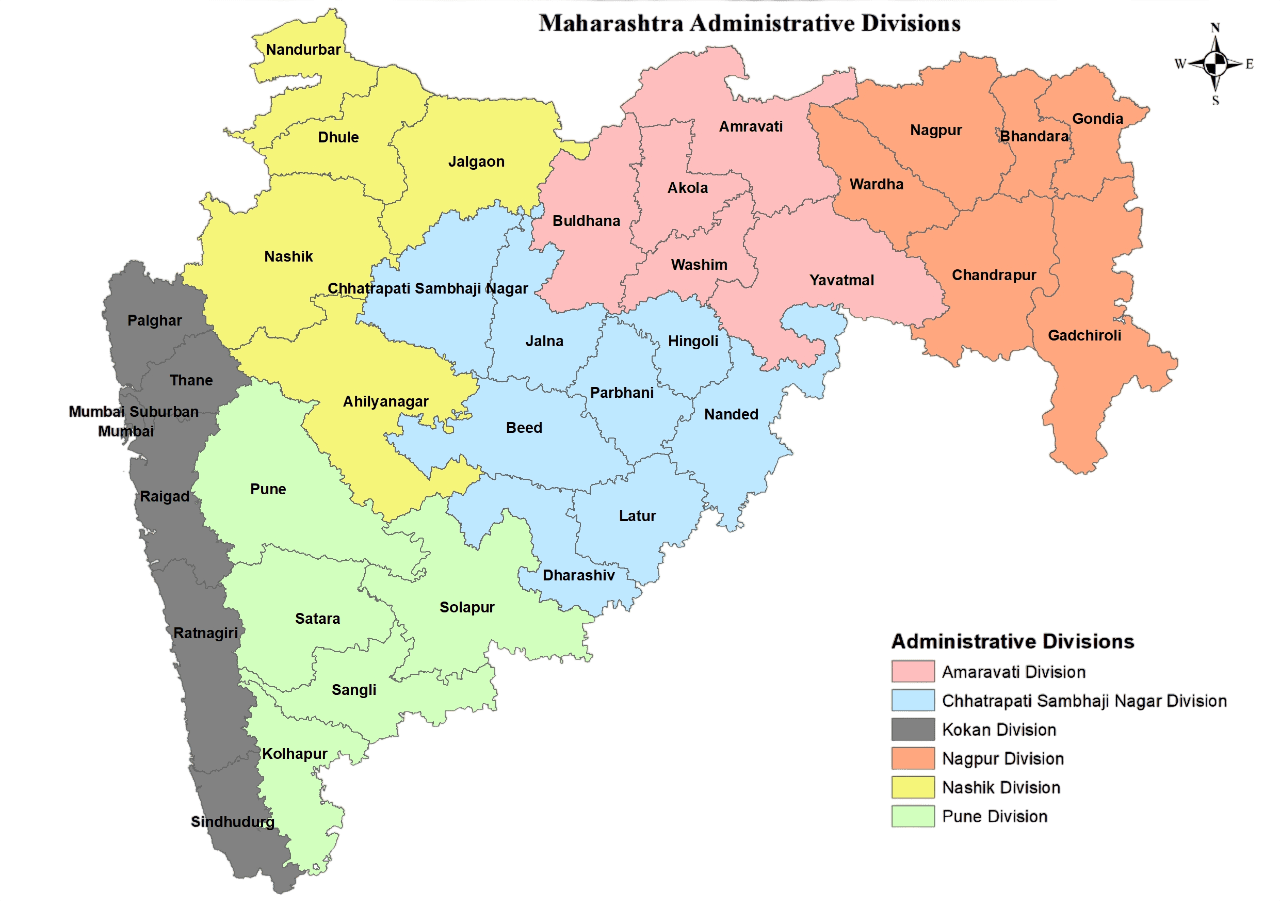
You zoom in

Now you see Cities...

Each level answers a different question

Country
States
City
Nothing feels cluttered, nothing feels lost
How do you move deeper without getting overwhelmed?

This is the idea behind Drill-down reports paired with good visual design.
We now discover how drill-down reports work and how to design them effectively....
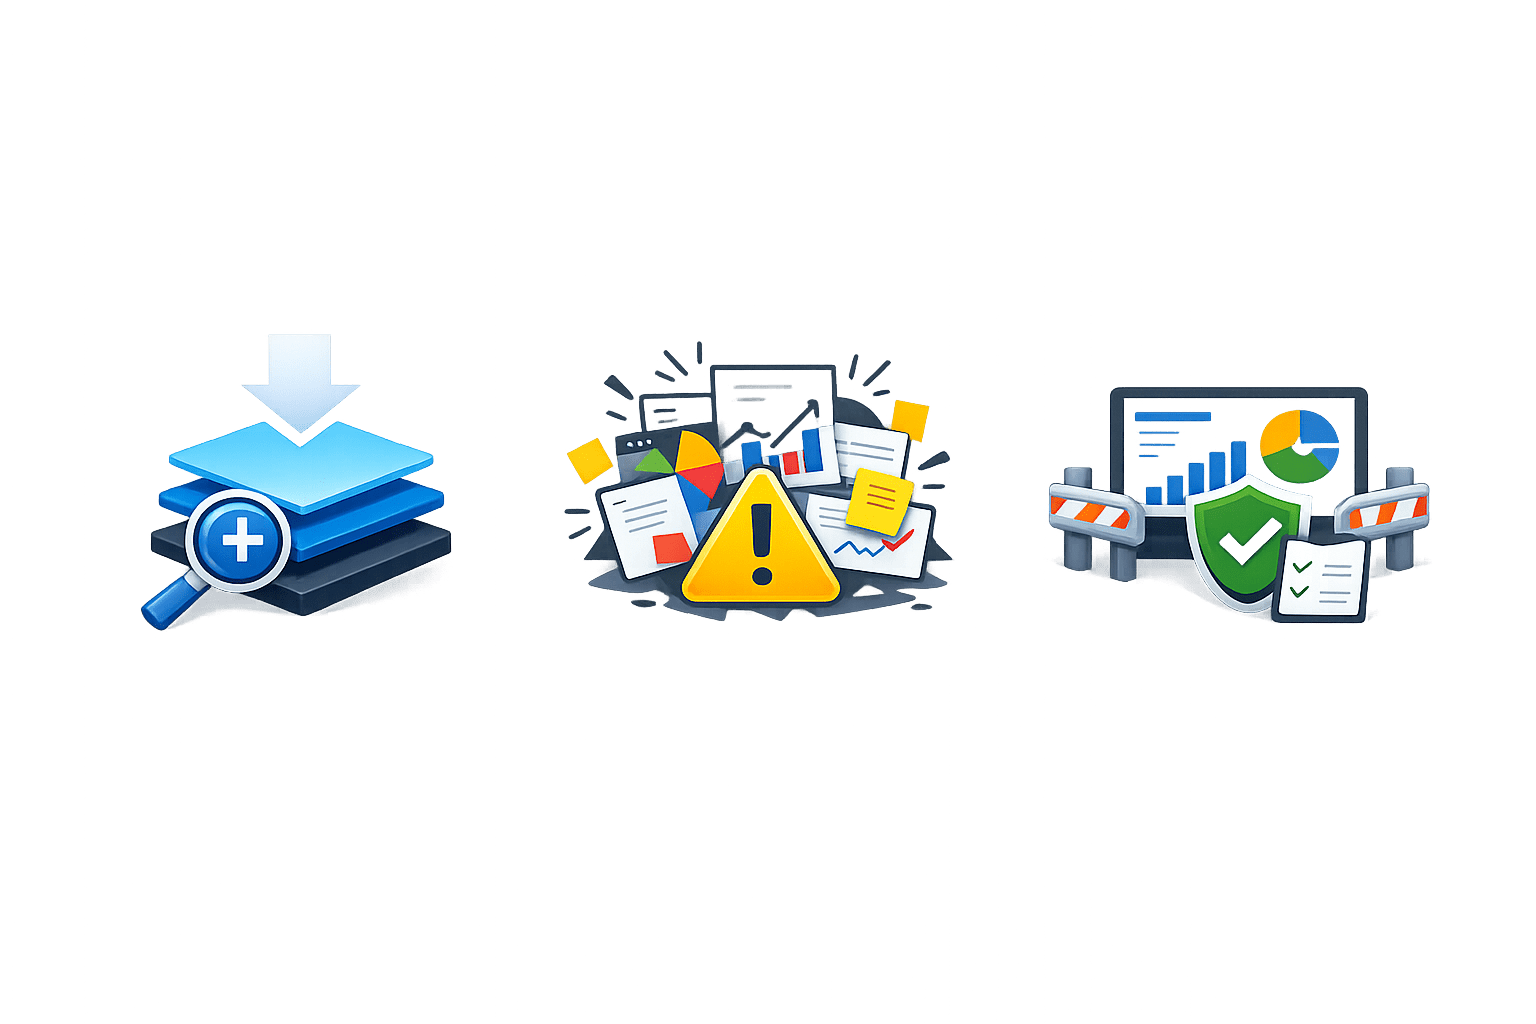
Drill-down reports enable progressive detail
But more detail can easily lead to clutter
Visual best practices act as guardrails
What is a Drill-Down Report?

A report that allows users to move from:
Summary → Detail
High-level → Granular views
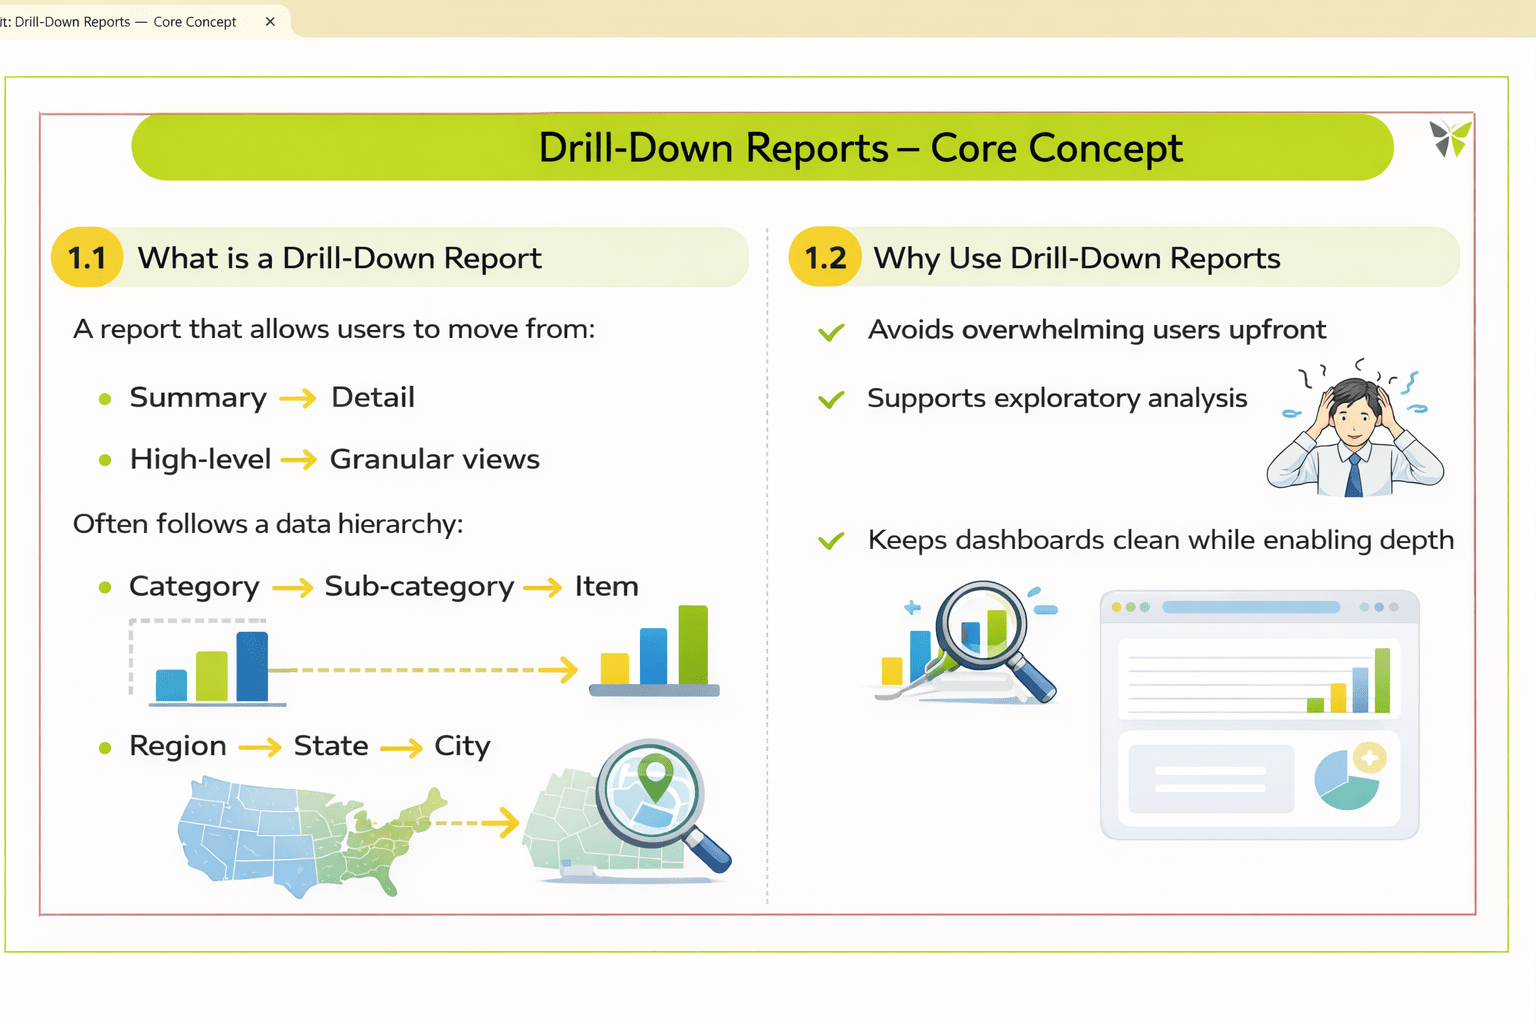
It often follows a data hierarchy:
Category → Sub-category → Item
Region → State → City
But why do we need them?
Use cases of Drill-Down Reports:
Avoids information overload

Enables quick exploration

Keeps dashboards clean

Reveals detailed insights on demand

Supports better decision-making

How Drill-Down Works in Tableau
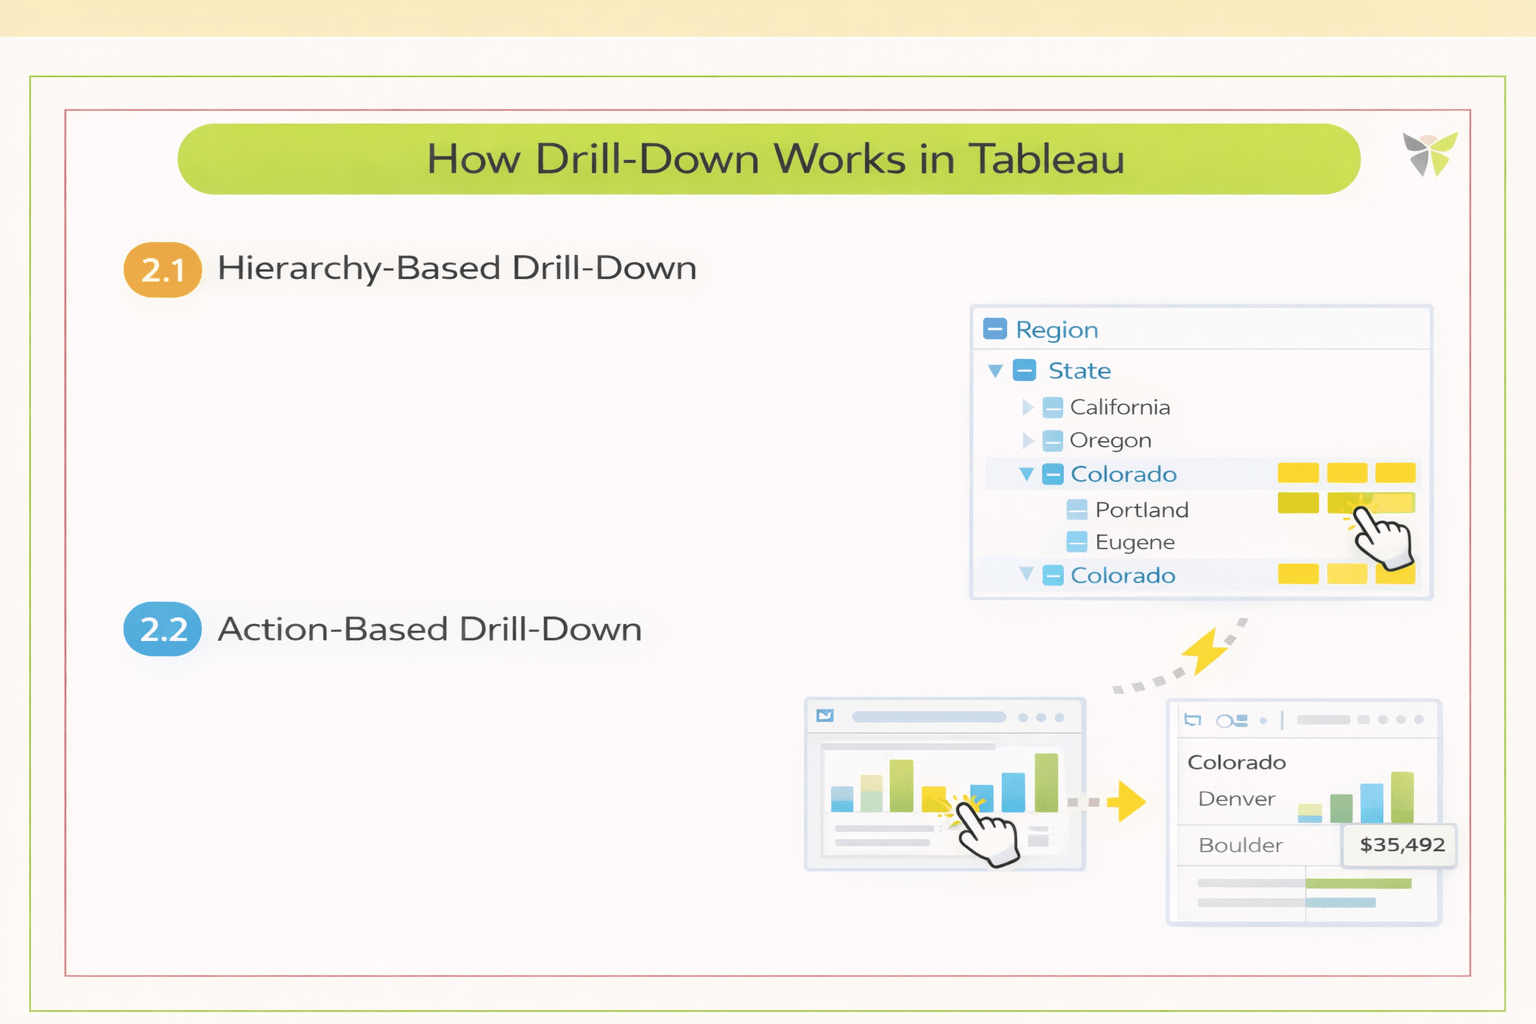
Hierarchy-Based Drill-Down
Uses predefined hierarchies in dimensions
Users expand or collapse levels within a single view


Action-Based Drill-Down
Uses dashboard actions to navigate to deeper views
Maintains context while changing detail level
Designing Effective Drill-Down Experiences
Show only essential information at each level
Progressive Disclosure

Visual Continuity
Maintain consistent colors, layout, and chart types

User Orientation & Context
Help users stay oriented while drilling down


On-Demand Detail Reveal
Reveal details when the user asks, not by default
Visual Best Practices
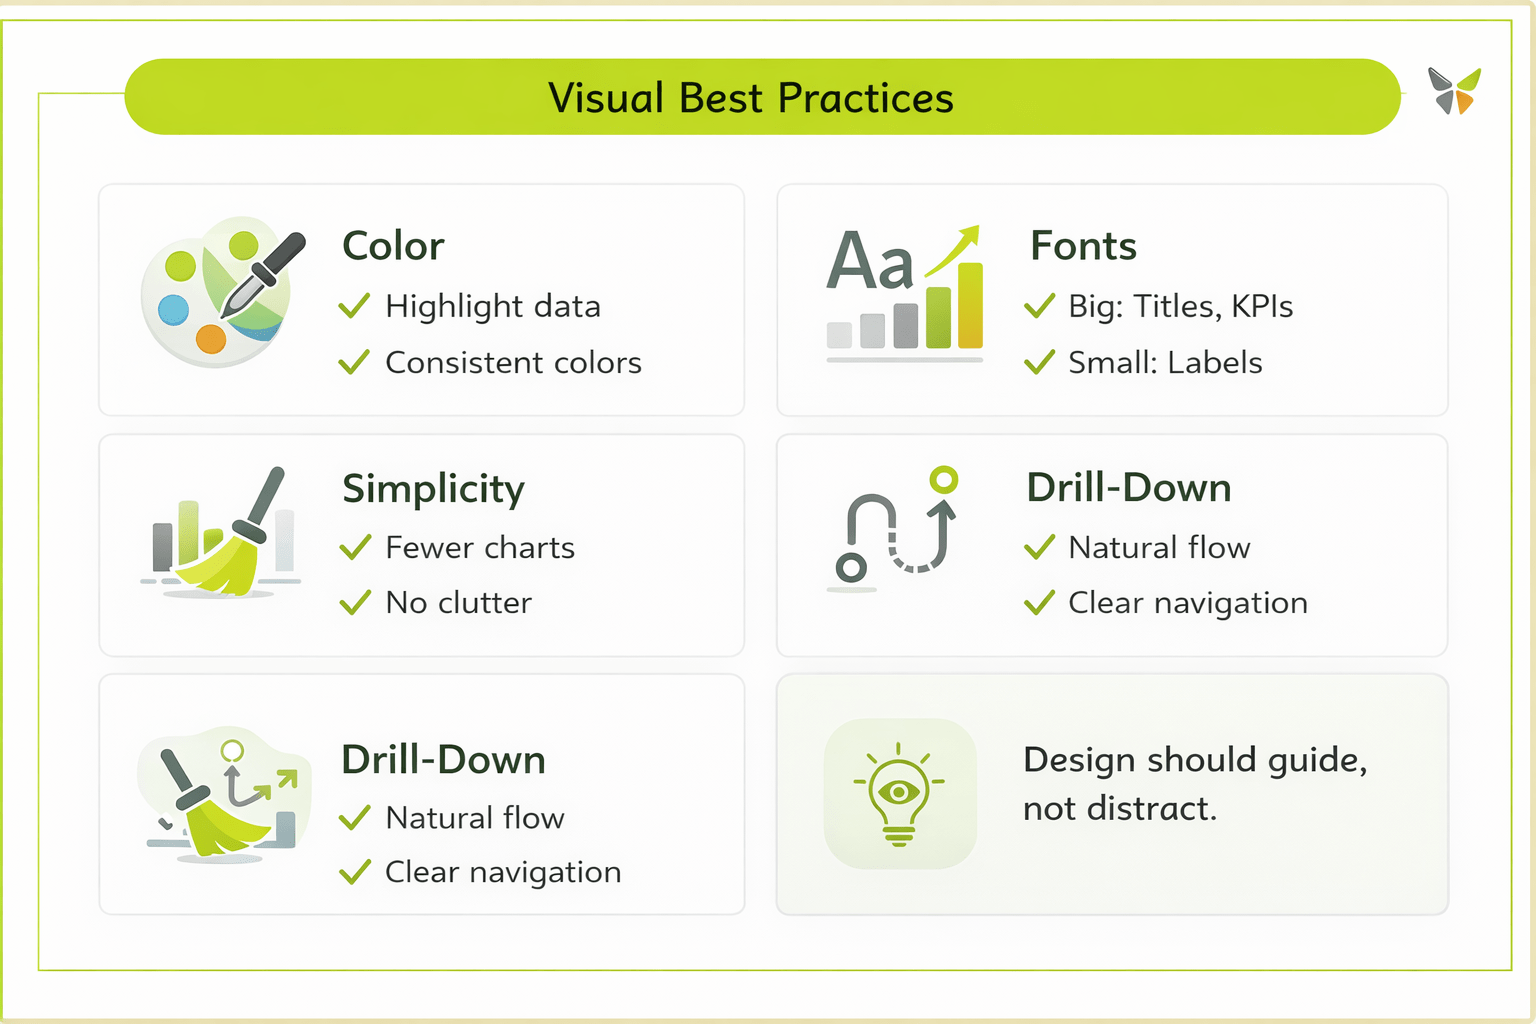
Design should guide,
not distract
5
Together, they create intuitive and effective dashboards
4
Good color use, font hierarchy, and simplicity are essential
3
Visual best practices ensure clarity at every level
2
They allow users to move from summary to detail smoothly
1
Drill-down reports enable in-depth exploration
Summary
Quiz
What is the primary purpose of drill-down reports?
A. To explore data progressively from summary to detail
B. To maintain user orientation
C. To highlight key data and categories
D. To avoid overwhelming users

Quiz-Answer
What is the primary purpose of drill-down reports?
A. To explore data progressively from summary to detail
B. To maintain user orientation
C. To highlight key data and categories
D. To avoid overwhelming users
