Topic Name

Subtopic Name


Use this slide if there is no Heading
Note - Create Content inside Red Layout
[Delete Red Outline After creating slide]
Learning Outcome(Slide2)
6
Basics of branding and messaging
5
Target audience and segmentation
4
Different marketing channels
3
Creating value for customers
2
Understanding customer needs
1
What marketing means ?
Choose cool, soft colors instead of vibrant colors
Max 6 Points for Summary & Min 4
Topic Name-Recall(Slide3)
Hook/Story/Analogy(Slide 4)
Transition from Analogy to Technical Concept(Slide 5)
What is Time Series Data?
Definition :
Time Series = A sequence of data points indexed by time.

Examples:


Stock market prices
Weather measurements
Website traffic
Sales over months
Python Libraries for Time Series
Pandas
Data handling
NumPy
Numerical computation
Statsmodels
Statistical tests & models
Matplotlib / Seaborn
Visualization


Essential libraries for time series analysis in Python
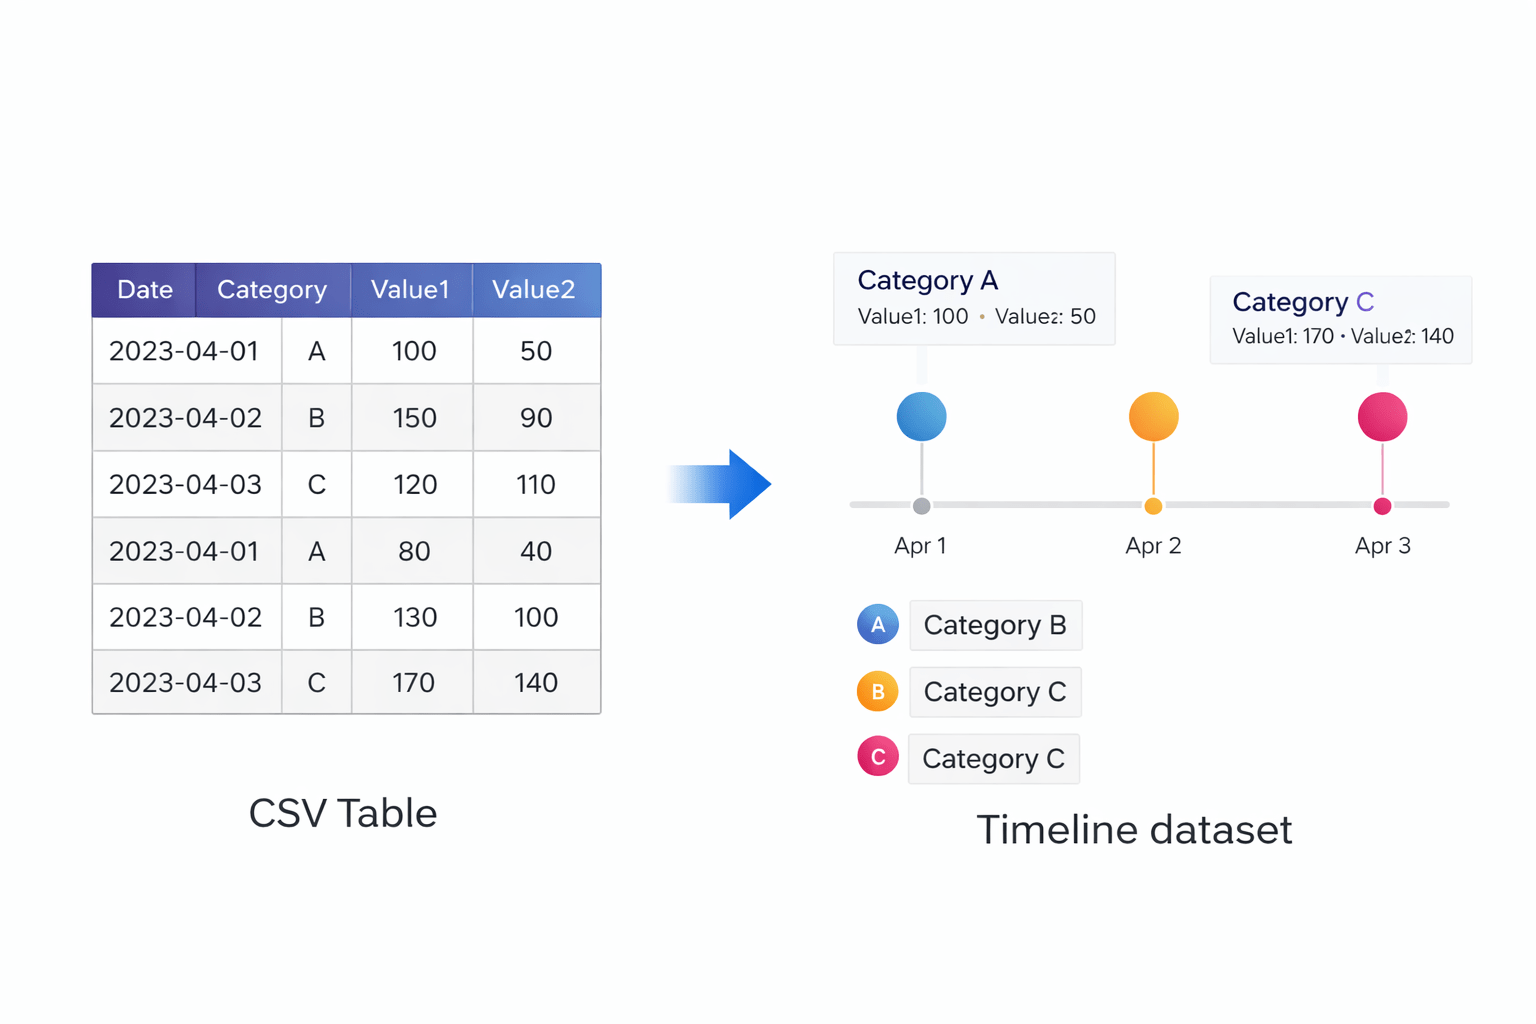
Loading Time Series Data
Reading time-based datasets
Key step:
Convert date column into datetime index

Example concept:
parse_dates
index_col
This allows time-based operations

Fixing Time Frequency
Why frequency matters
Time series must have consistent intervals
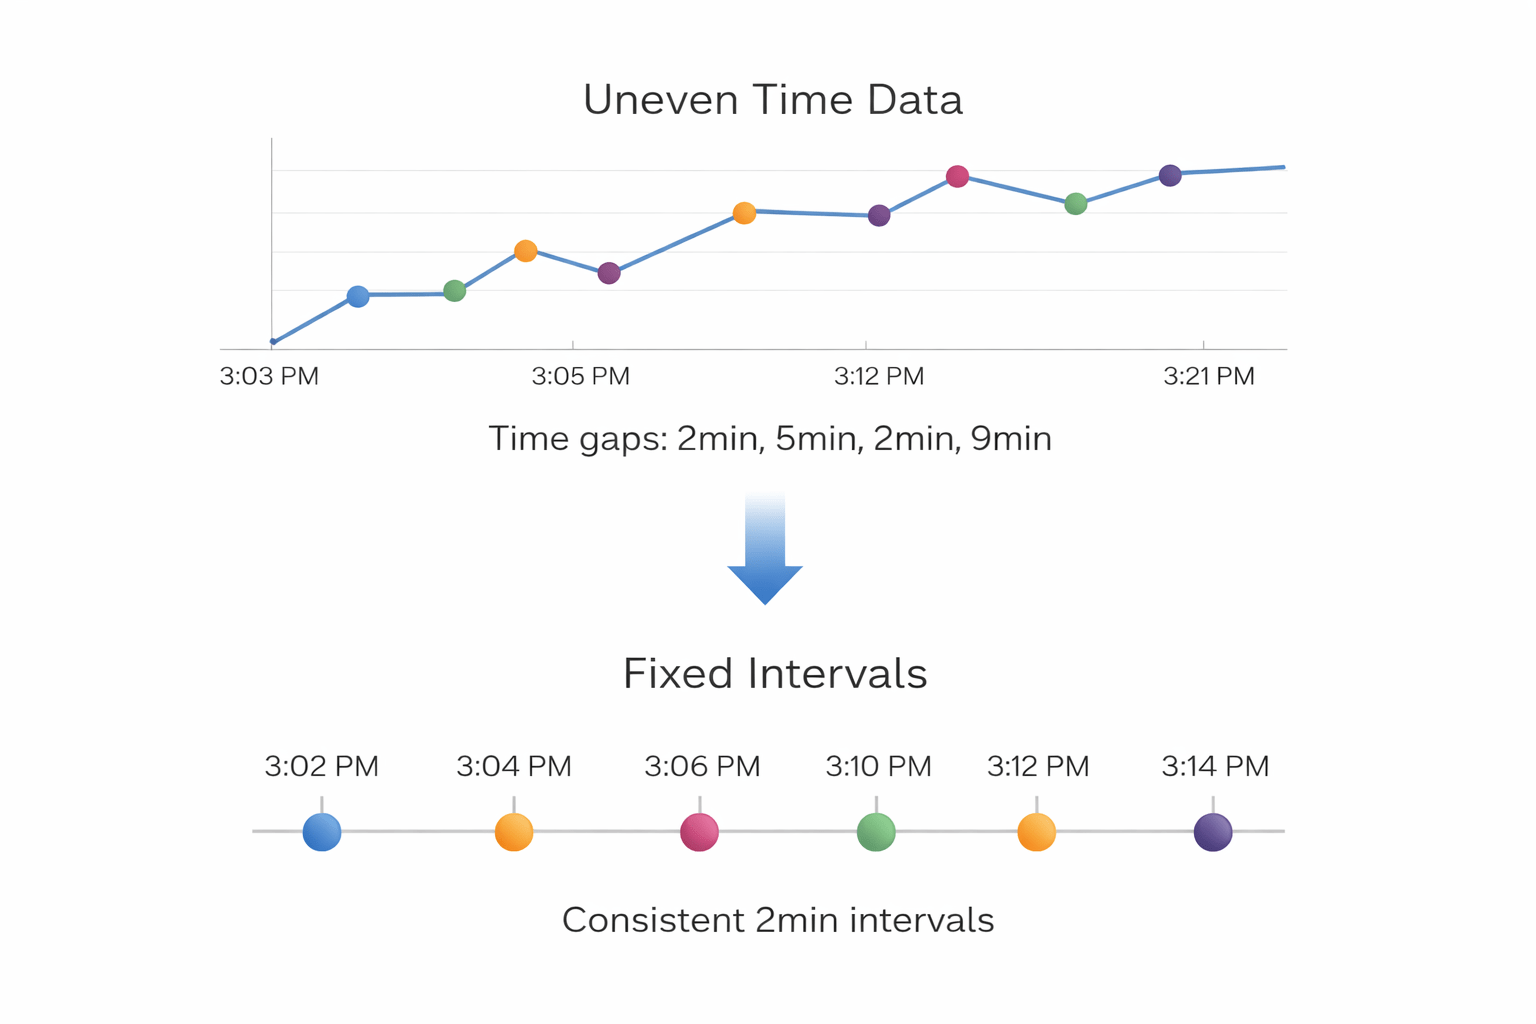

Example frequencies:


Using:
asfreq()
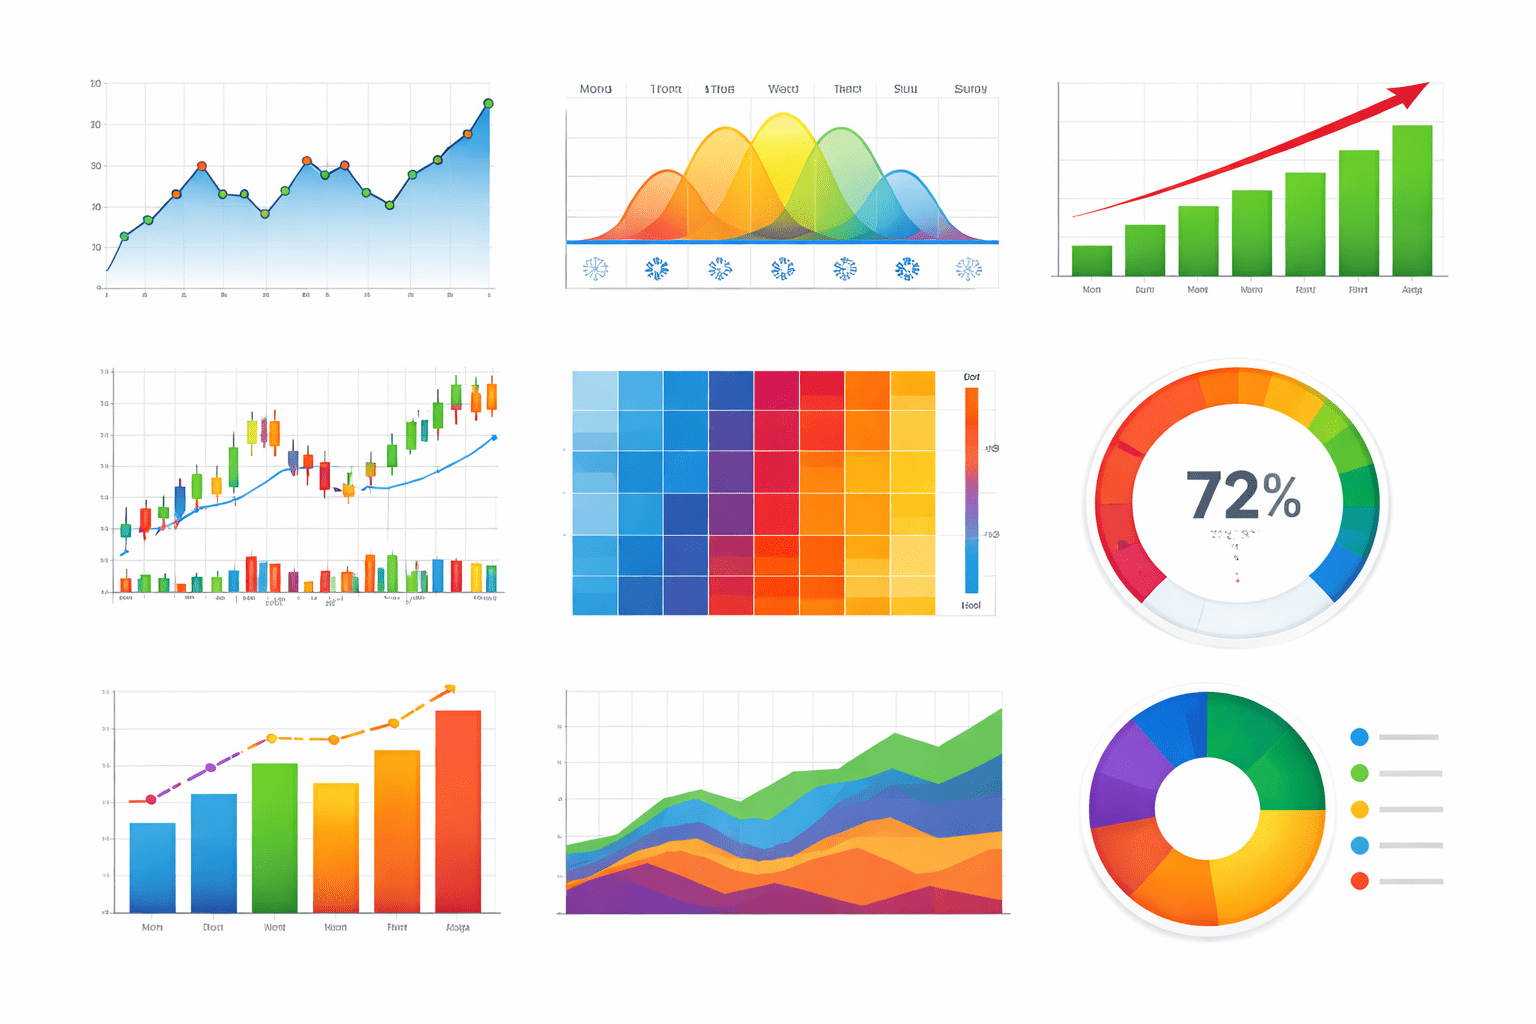
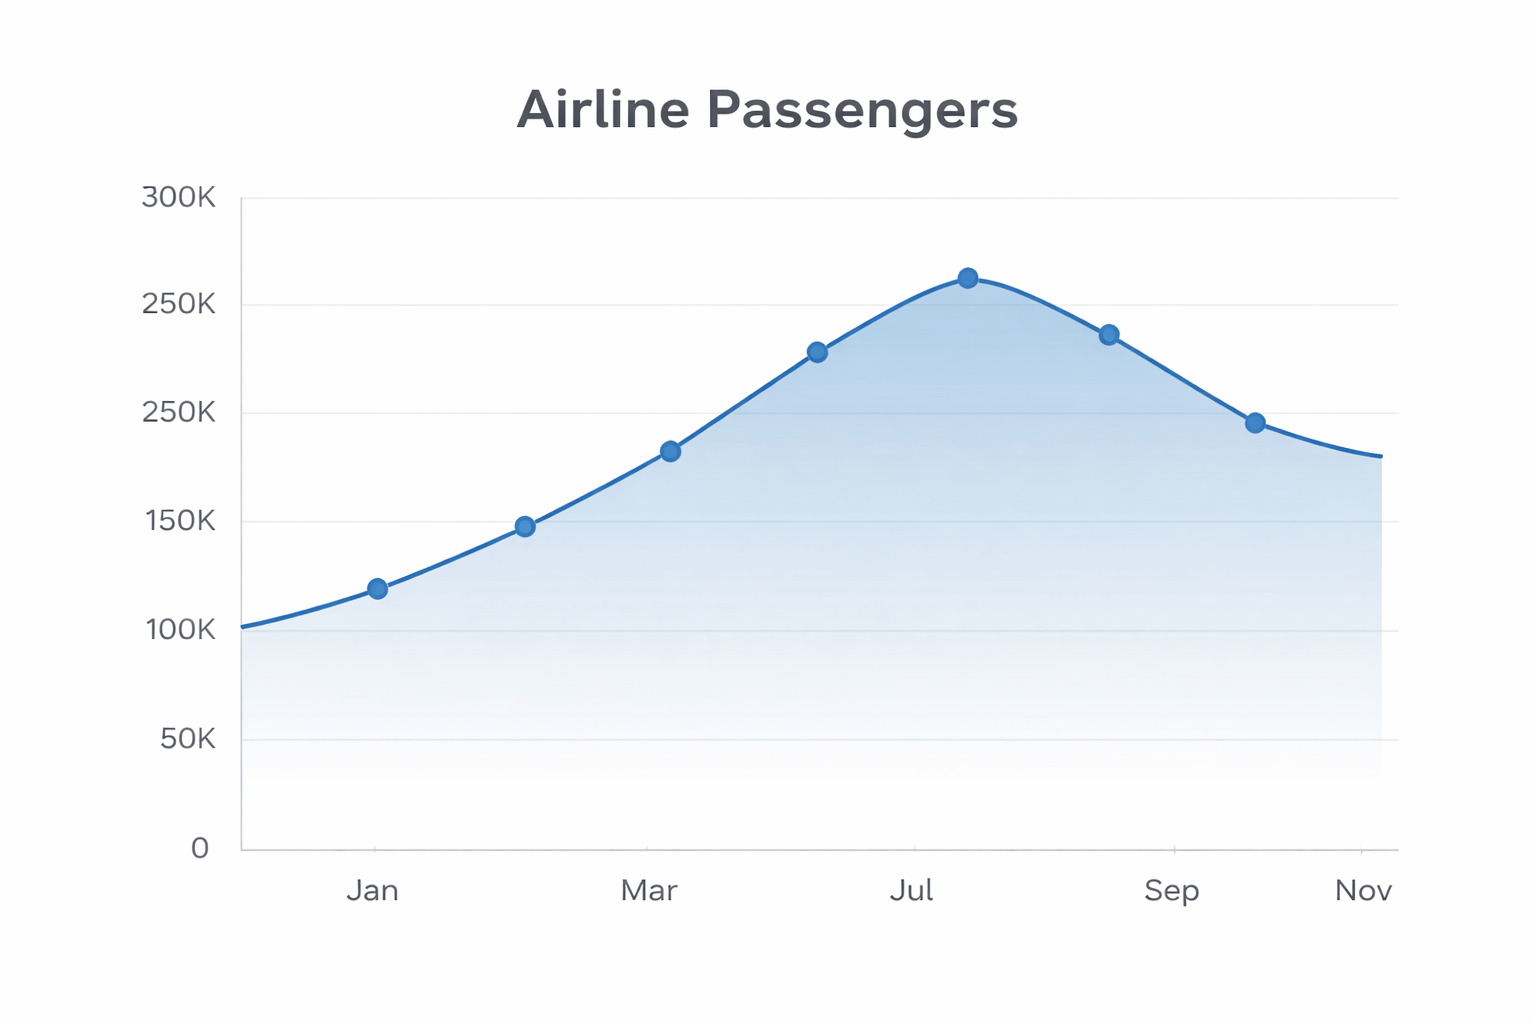
Time Series Visualization
Plotting reveals:
Trends
Seasonal patterns
Anomalies


Basic plot:
df.plot()

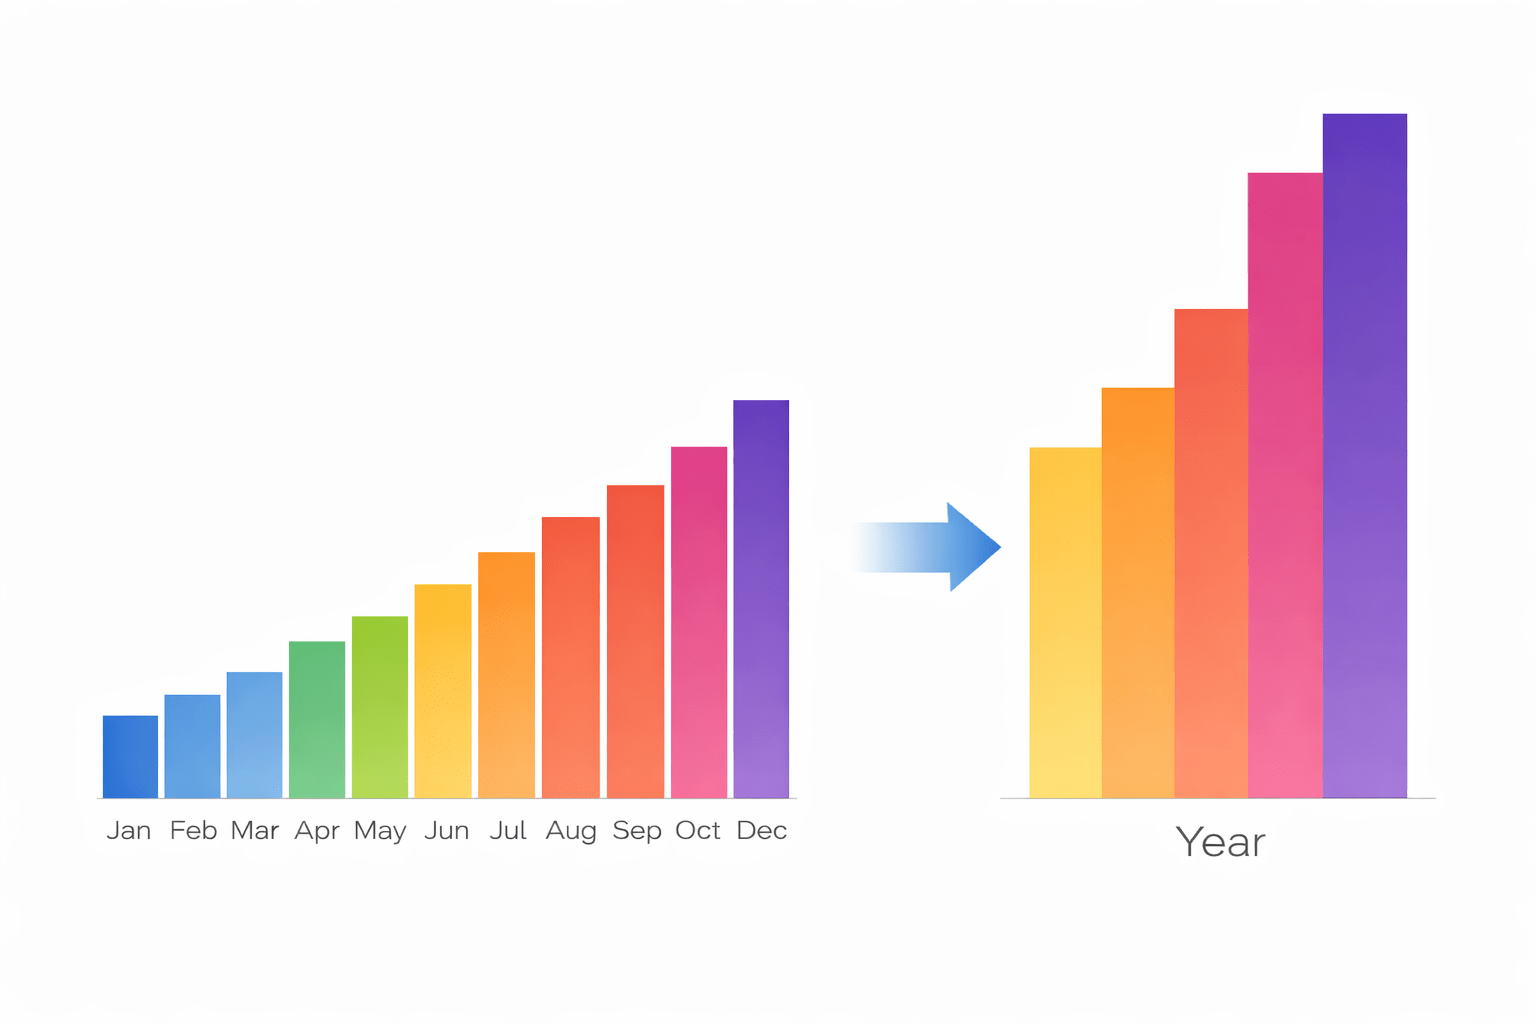
Resampling Data
Resampling = Changing time granularity
Two types:
Downsampling
Upsampling
Monthly
Yearly
Monthly
Daily
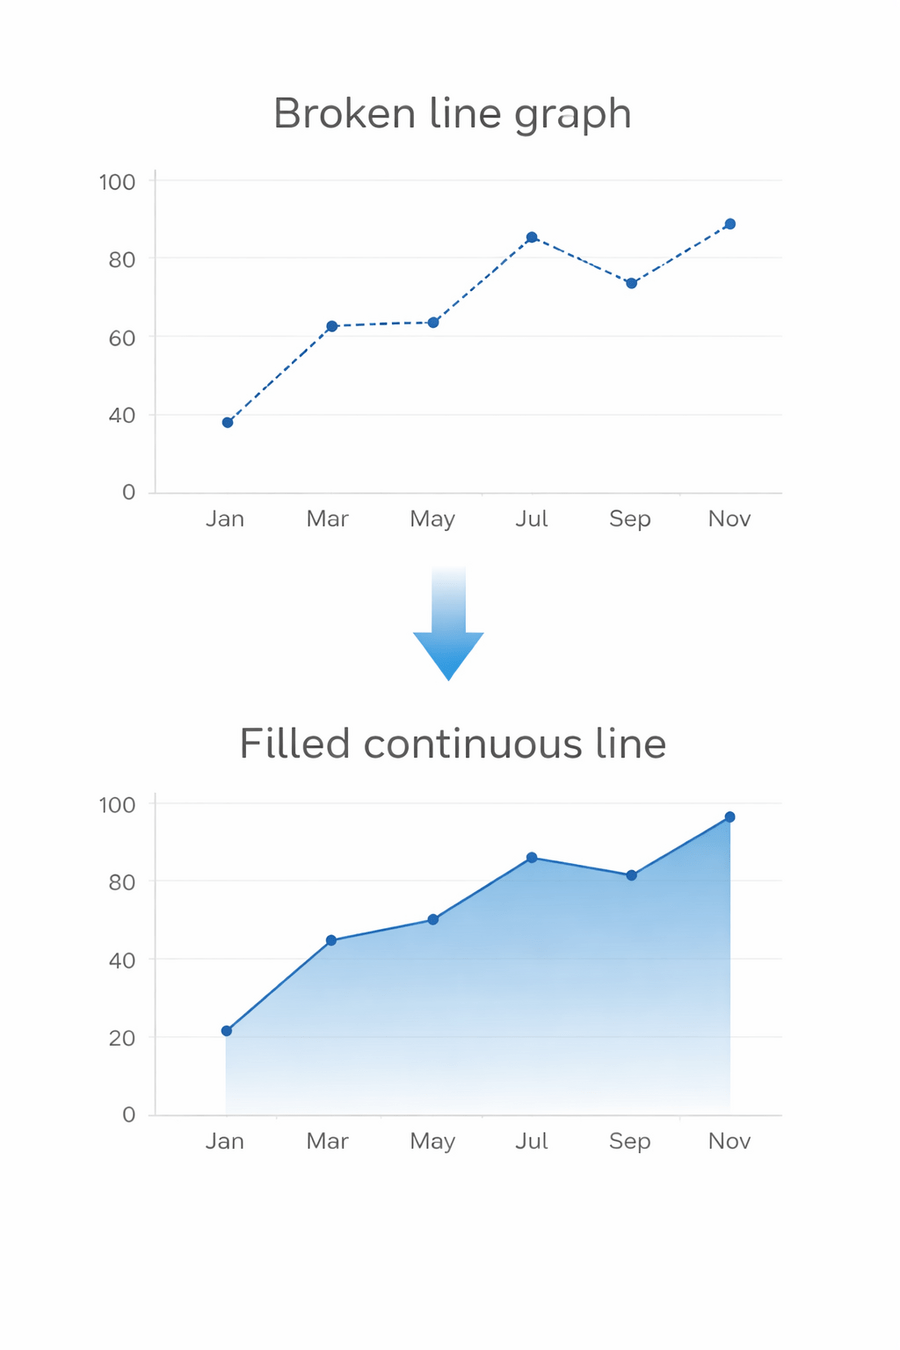
Handling Missing Data
Real datasets often have missing time points

Common methods:
Forward Fill (ffill)
Propagate last valid observation forward
Backward Fill (bfill)
Propagate next valid observation backward

Interpolation
Estimate values between known points
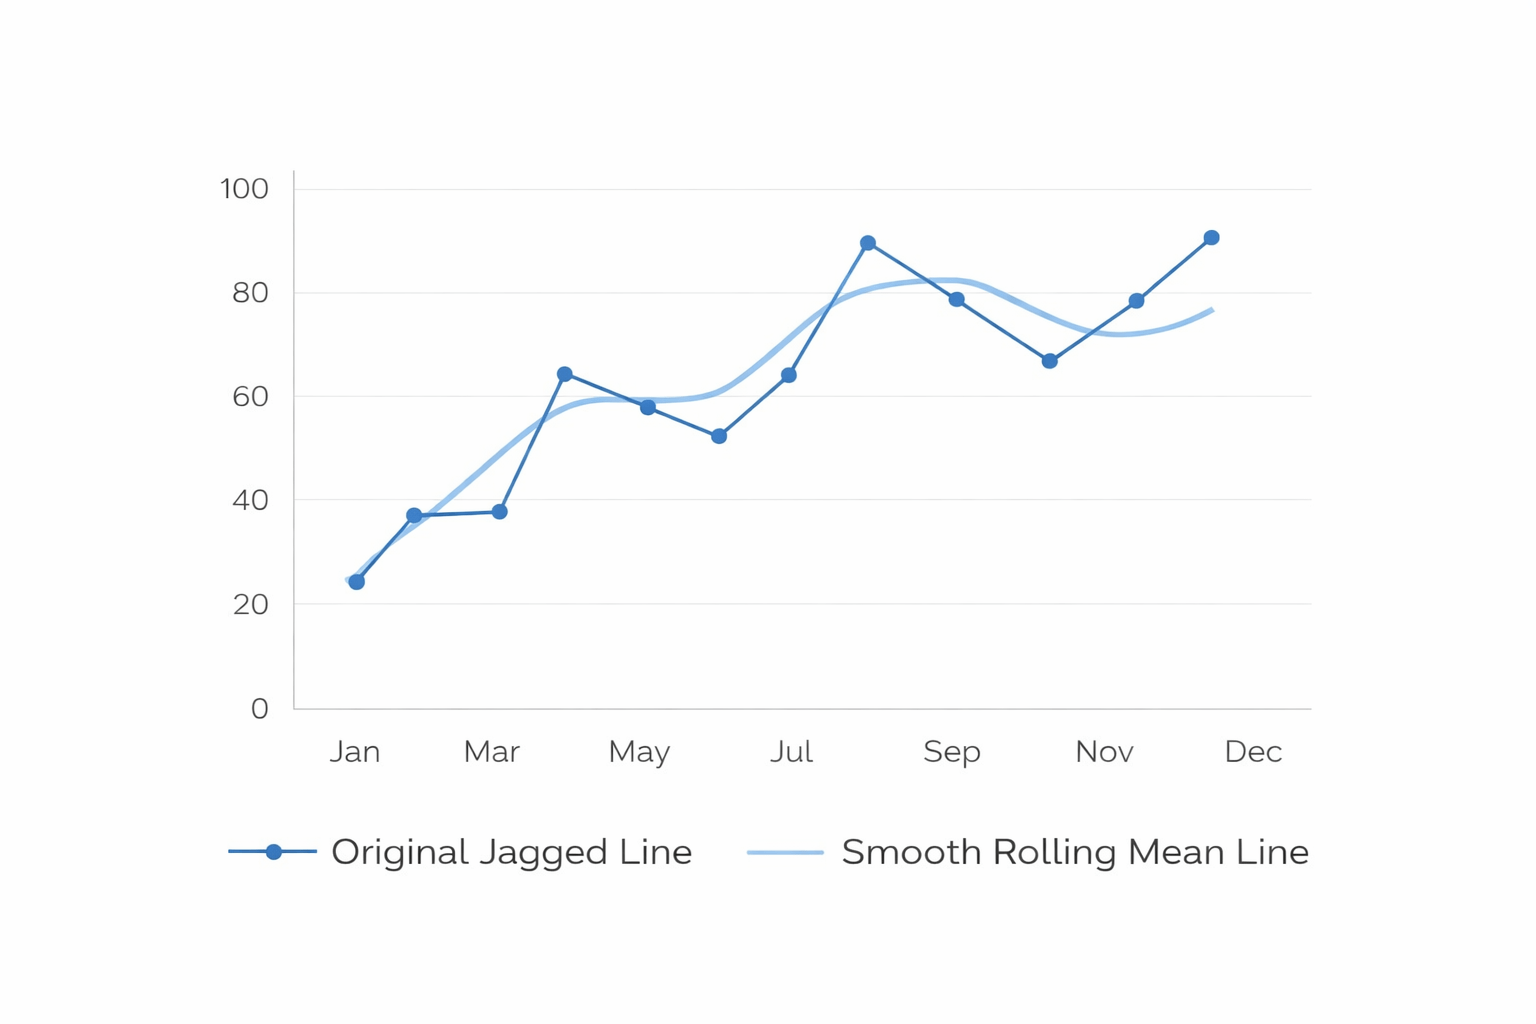
Rolling Statistics
Used to smooth noisy data
Example:
12-month rolling average
Helps reveal long-term trend

Time-based Filtering
We can easily filter time ranges

Examples:
Example concept:
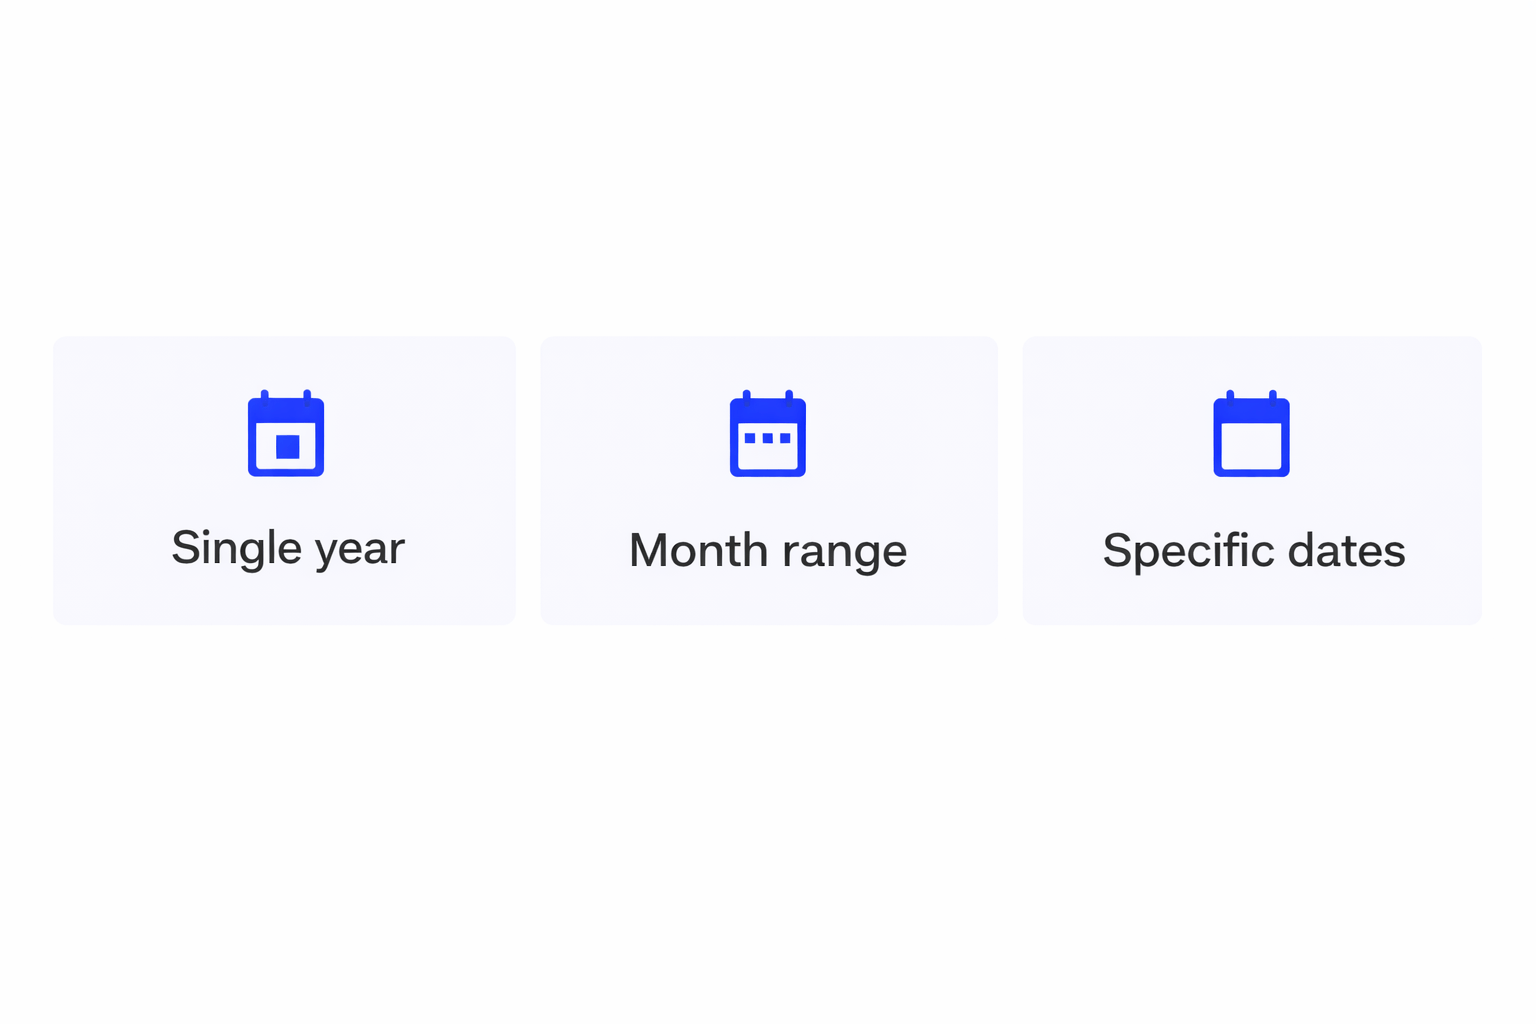
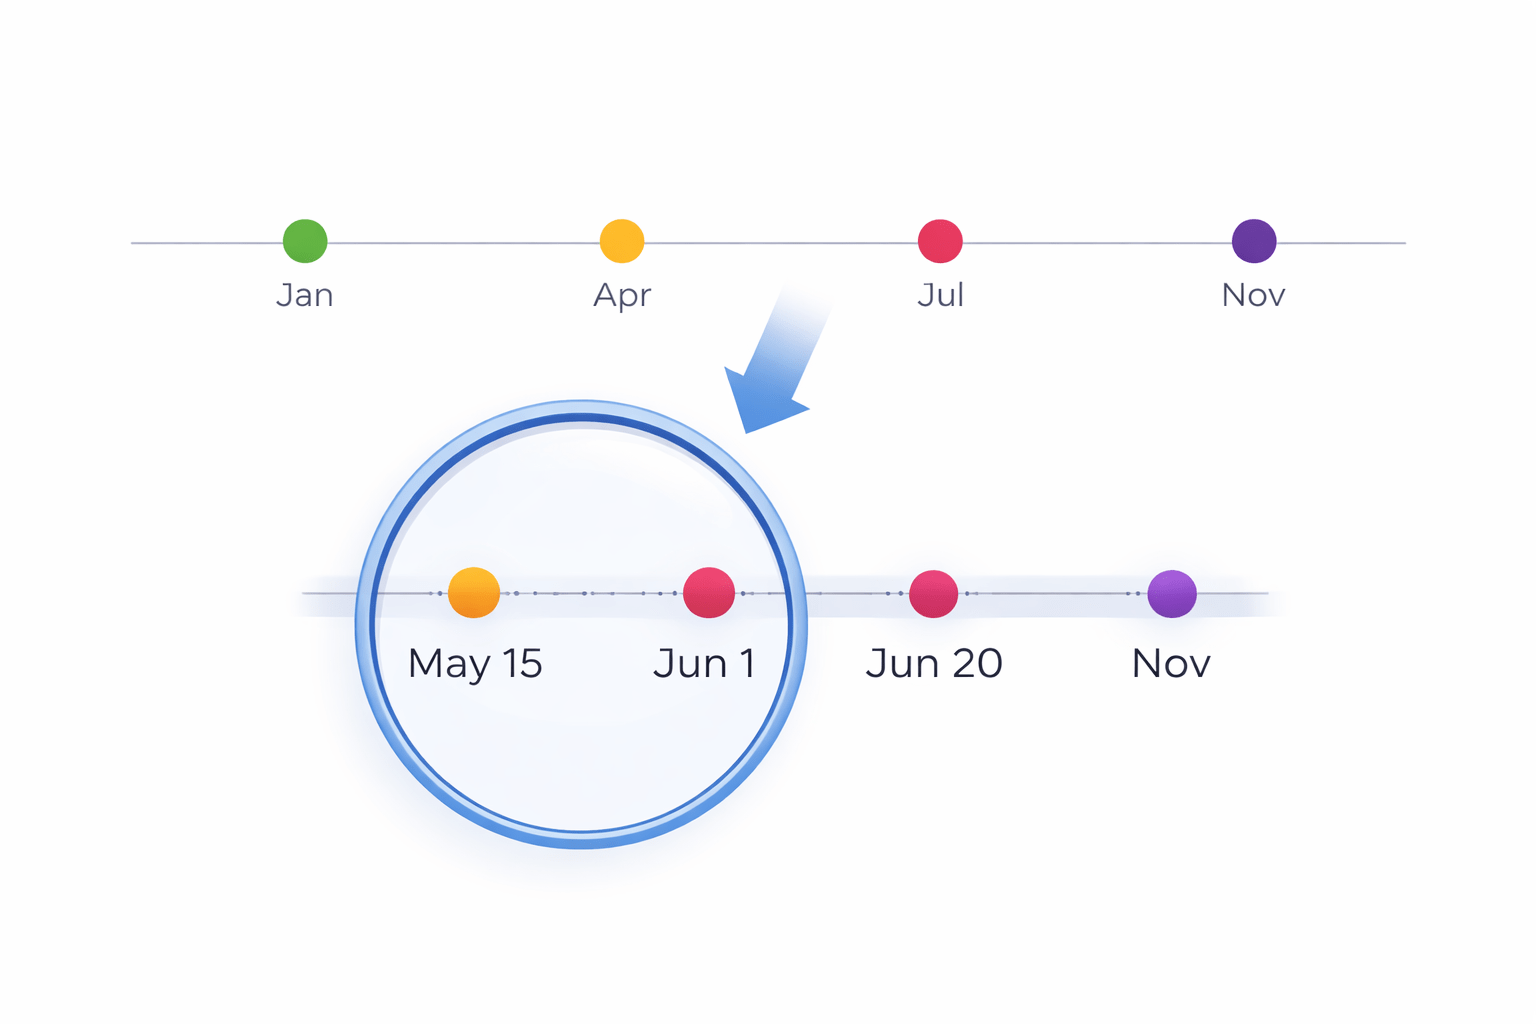
df['1952':'1953']
df['1952']
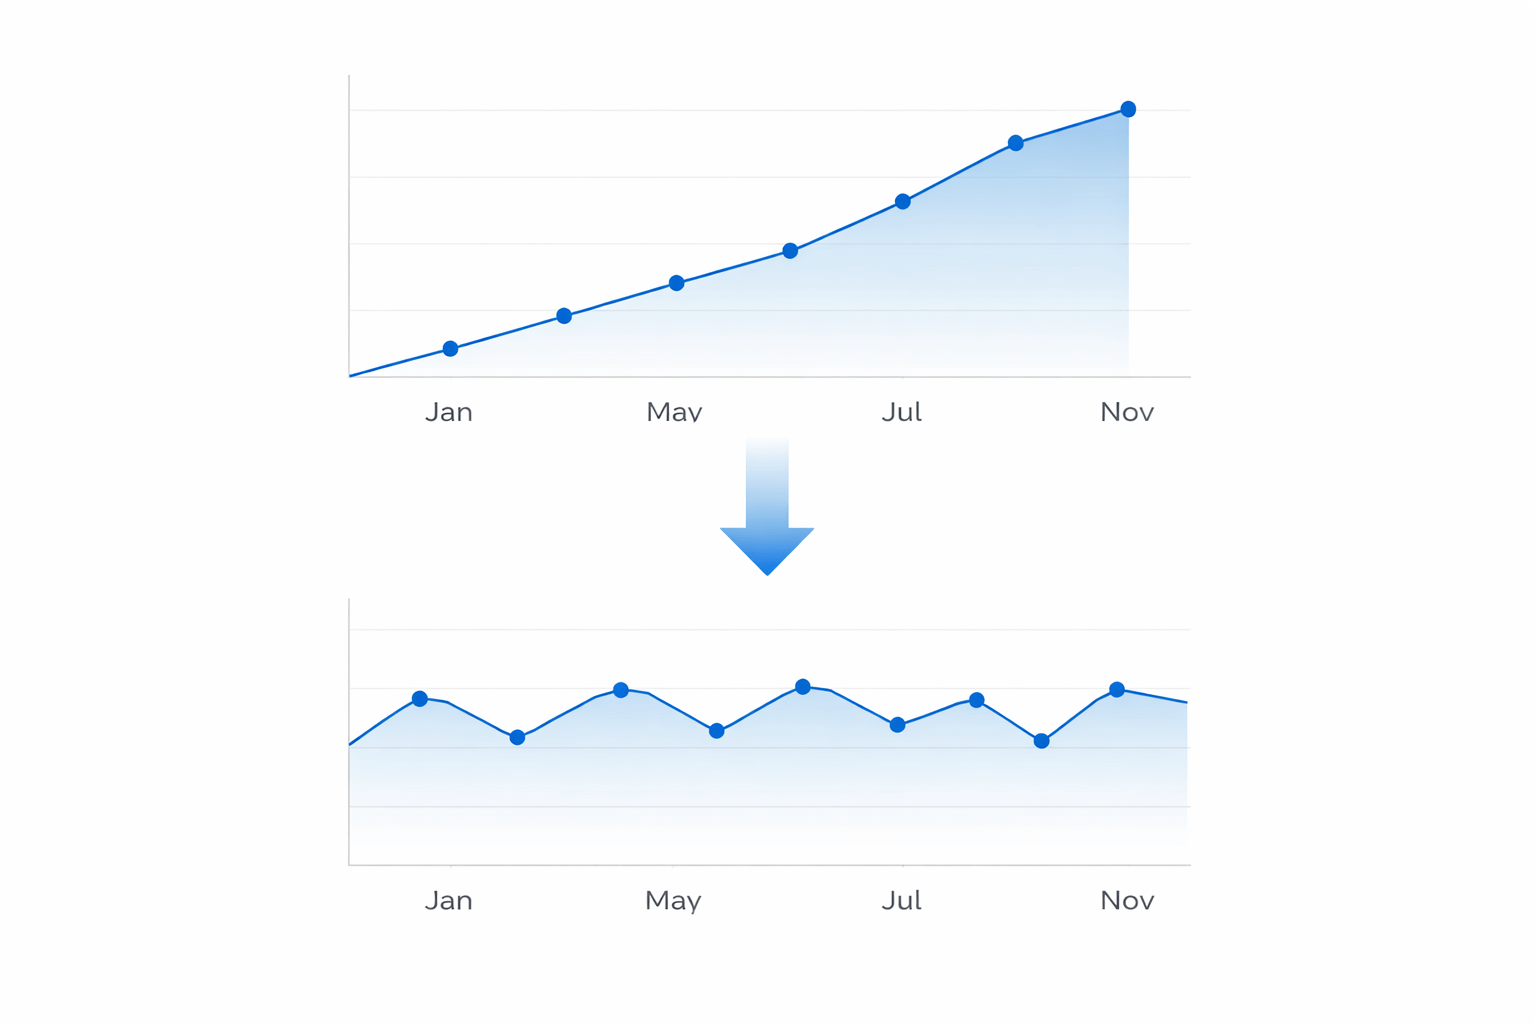
Removing Trends (Differencing)
Many time series contain trend
Differencing helps make data stable

Formula concept:
Current value - Previous value
Summary
5
Build strong branding
4
Use different marketing channels
3
Target the right audience
2
Create and communicate value
1
Understand customer needs
Choose cool, soft colors instead of vibrant colors
Max 5 Points for Summary & Min 2
Quiz
Which platform is mainly used for professional networking and B2B marketing ?
A. Facebook
B. Instagram
C. LinkedIn
D. Snapchat

Quiz-Answer
Which platform is mainly used for professional networking and B2B marketing ?
A. Facebook
B. Instagram
C. LinkedIn
D. Snapchat
