Building Interactive Dashboards

Dashboard Fundamentals


Learning Outcome
5
Customize dashboard layout and workspace effectively
4
Build a simple dashboard using worksheets
3
Understand how Tableau dashboards are structured
2
Explain why dashboards are used
1
Define what a dashboard is in Tableau
Topic Name-Recall(Slide3)
Hook/Story/Analogy(Slide 4)
Transition from Analogy to Technical Concept(Slide 5)
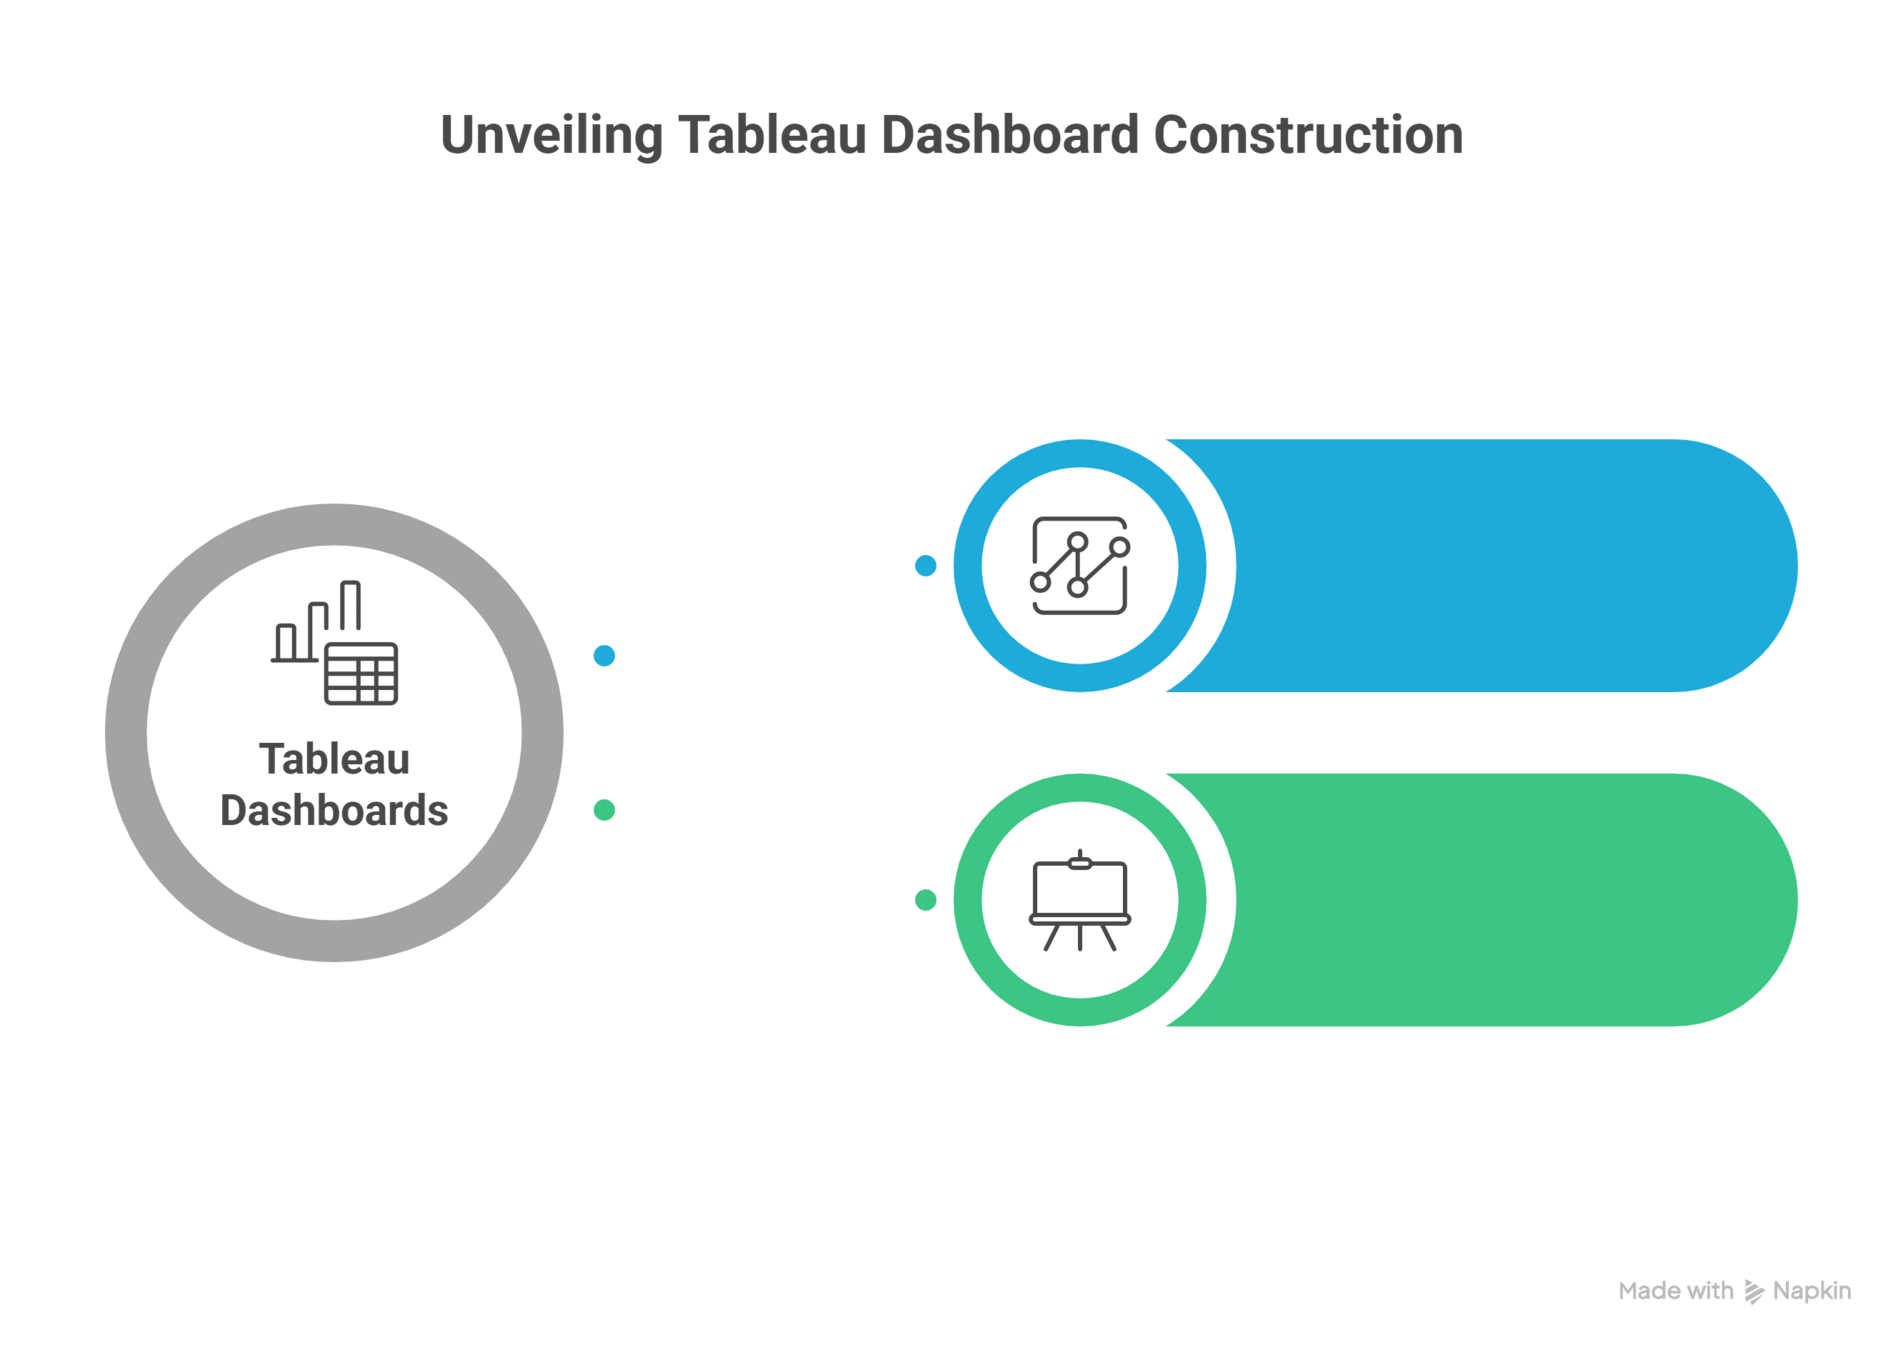
Dashboard in Tableau
A dashboard is a single visual screen that brings together key metrics and charts to help users quickly monitor performance and make informed decisions
Definition
Purpose of Dashboards


Monitor Key Metrics
High-Level Overview
Compare trends
It transforms raw data into clear, actionable insights for faster understanding and decision-making.
How Dashboards Work in Tableau
Dashboard Canvas
Worksheet-First Approach
Dashboards are built using existing worksheets
Each chart or KPI must be created separately first
The dashboard acts as a container
Visuals are dragged and placed onto the canvas
Building a Simple Dashboard

Starting the Dashboard
Adding Worksheets
Adding Titles and Text


Steps: Add Charts to Dashboard
-
Locate worksheets in the Dashboard pane
-
Drag a worksheet (e.g., Bar Chart) onto the canvas
-
Drag additional worksheets (e.g., Line Chart)
-
Resize visuals by dragging borders
Steps: Add Dashboard Title
-
Drag a Text object onto the canvas
-
Enter the dashboard title
-
Format font size, alignment, and color
Steps: Create a New Dashboard
-
Click the New Dashboard icon
-
Choose a dashboard size (Automatic or Fixed)
-
Open a blank dashboard canvas
Arranging and Aligning Dashboard Elements
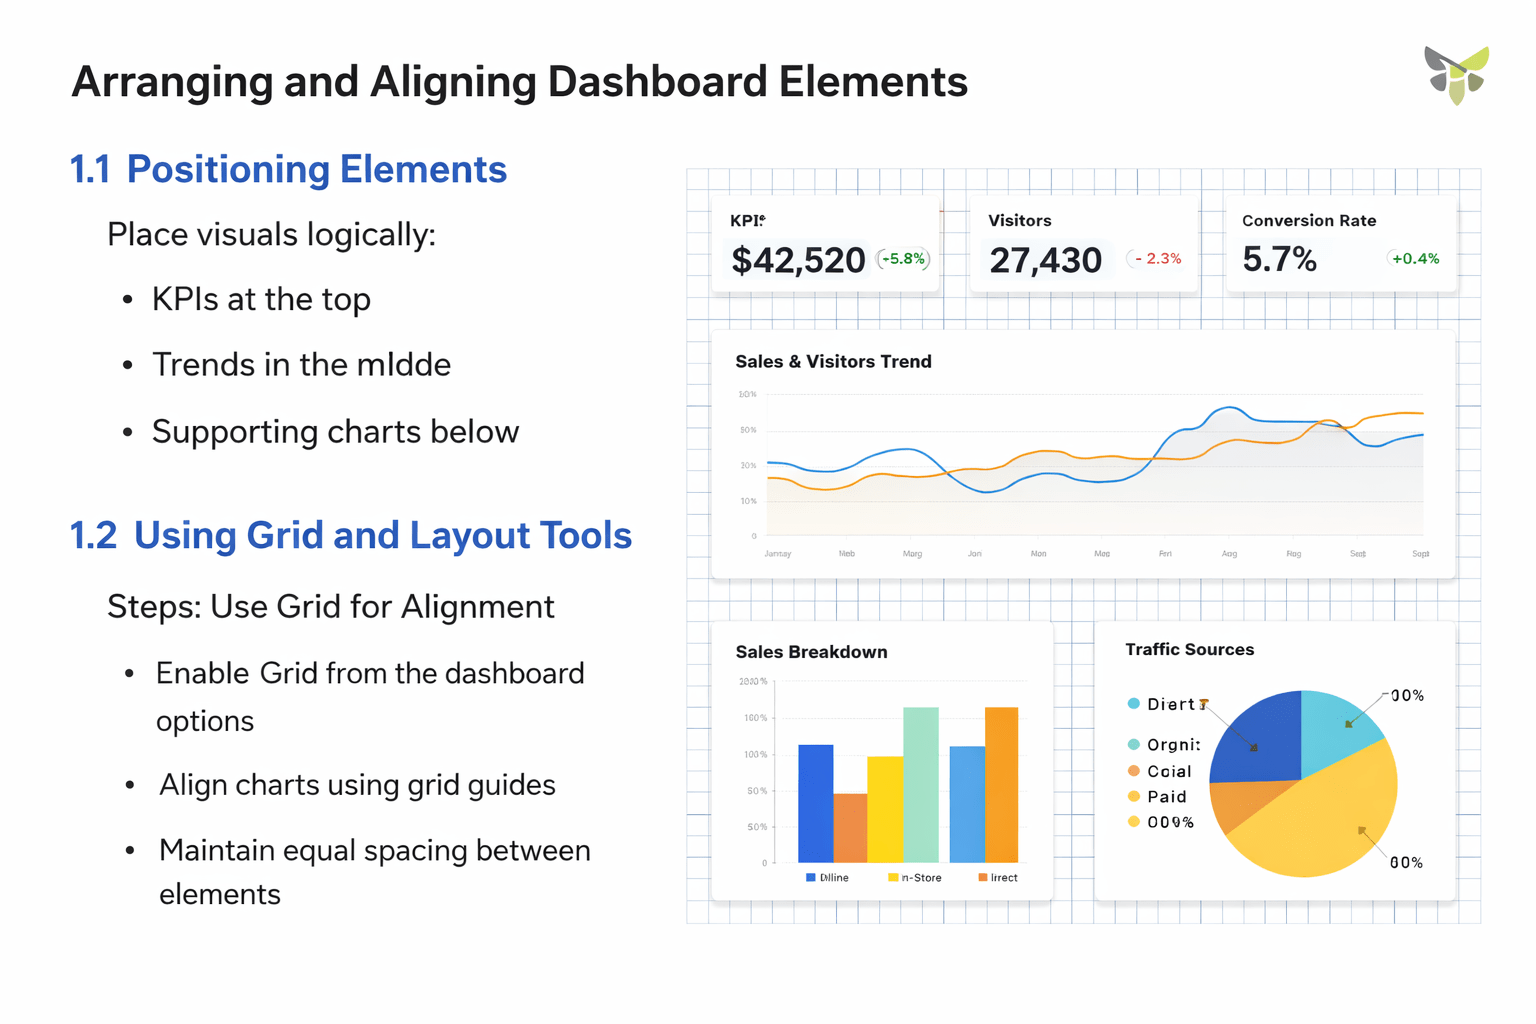
Positioning Elements
Place visuals logically:
KPIs at the top
Trends in the middle
Supporting charts below
Using Grid and Layout Tools
-
Enable Grid from the dashboard options
-
Align charts using grid guides
-
Maintain equal spacing between elements
Text
Summary
5
Workspace customization improves efficiency
4
Consistent colors and alignment enhance clarity
3
Logical layout improves readability
2
Worksheets are the building blocks of dashboards
1
Dashboards combine multiple insights into one view
Quiz
What must be created before building a dashboard?
A. Filters
B. Story line
C. Parameters
D. Worksheet

Quiz-Answer
What must be created before building a dashboard?
A. Filters
B. Story line
C. Parameters
D. Worksheet
