Future And Options

Payoff Chart

Learning Outcome
5
Analyze risk–reward using payoff diagrams.
4
Distinguish bullish, bearish, and neutral strategies.
3
Calculate maximum profit, loss, and break-even.
2
Identify Long Call, Short Call, Long Put, and Short Put payoffs.
1
Define and interpret option payoff charts.
Payoff Chart
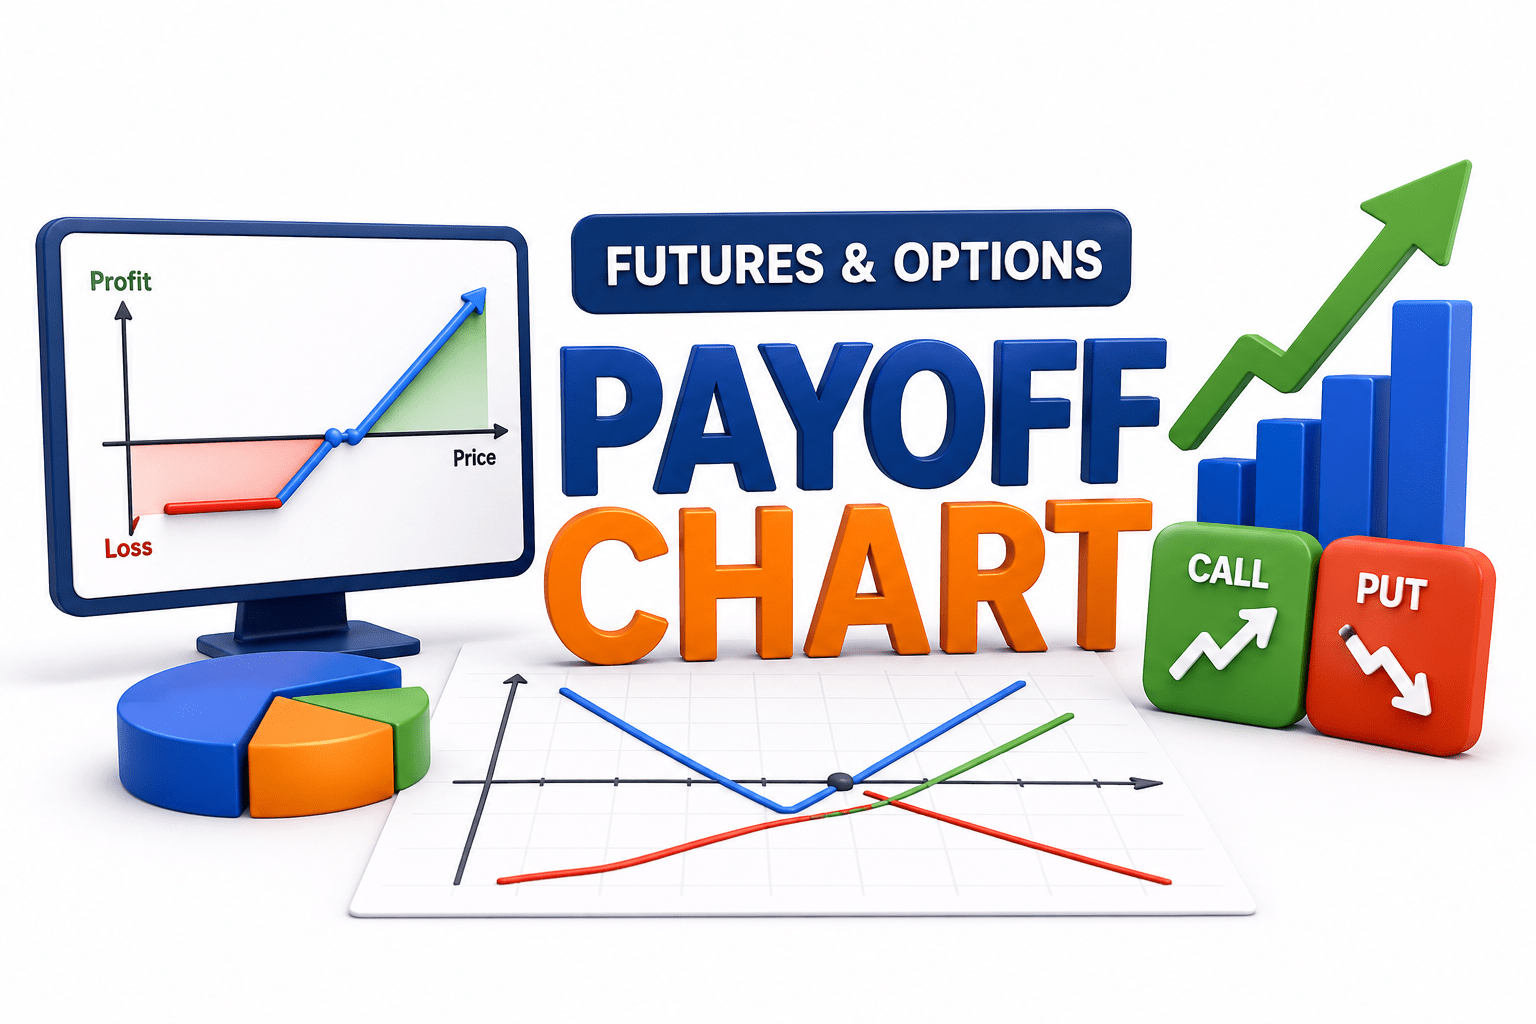
A payoff chart is a graphical representation of the net profit or loss (Y-axis) earned by an option or futures position plotted against all possible values of the underlying asset price at expiry (X-axis). It shows the complete risk-reward profile of a position at a glance.
Types of payoff chart:
1. Long Call Payoff Diagram (Bullish)
2. Short Call Payoff Diagram (Bearish / Neutral)
3. Long Put Payoff Diagram (Bearish)
4. Short Put Payoff Diagram (Bullish / Neutral)
The Two Axes
| Axis | What It Shows | Example (Nifty Options) |
|---|---|---|
| X-Axis (Horizontal) | Underlying asset price at expiry — all possible values from zero to infinity | Nifty index level at expiry: 18,000 … 19,000 … 22,000 … 25,000 |
| Y-Axis (Vertical) | Net profit or loss on the position — positive = profit (above zero), negative = loss (below zero) | P&L in ₹: +₹5,000 profit or −₹2,000 loss per unit at expiry |
Text
Text
Text
Use this slide if there is no Heading
Note - Create Content inside Red Layout
[Delete Red Outline After creating slide]
Key Features to Read on Any Payoff Chart
Break-even point — where the payoff line crosses zero — neither profit nor loss
Maximum profit — the highest point the payoff line can reach (may be unlimited)
Maximum loss — the lowest point the payoff line can go (may be unlimited for sellers)
Profit zone — region to the right or left of break-even where P&L is positive (shaded green)
Loss zone — region where P&L is negative (shaded red
Slope — the steepness of the line tells you how quickly profit/loss changes with price
Core Concepts (Slide 6)
|
The Golden Rule of Payoff Charts Every point on the payoff line answers one question: Q: 'If the Nifty expires exactly at this price, how much money do I make or lose?' |
Core Concepts (Slide 7)
Core Concepts (.....Slide N-3)
Summary
5
Build strong branding
4
Use different marketing channels
3
Target the right audience
2
Create and communicate value
1
Understand customer needs
Choose cool, soft colors instead of vibrant colors
Max 5 Points for Summary & Min 2
Quiz
Which platform is mainly used for professional networking and B2B marketing ?
A. Facebook
B. Instagram
C. LinkedIn
D. Snapchat

Quiz-Answer
Which platform is mainly used for professional networking and B2B marketing ?
A. Facebook
B. Instagram
C. LinkedIn
D. Snapchat
