Develop Executive Workforce Analysis Dashboard

Business Scenario
Welcome!

Today is your final day as a Junior Data Analyst at our HR Analytics company.
Over the past days, you have worked through the complete analytics lifecycle, starting from raw data handling to advanced reporting.

By now you have covered data cleaning, transformation, modeling, DAX calculations, KPI creation, and interactive dashboard development across multiple business scenarios including HR, sales, and population analytics.
Now, all your learning comes together in a final end-to-end reporting project focused on delivering meaningful business insights through a complete Power BI solution which supports business decision-making.
Your task is to design and present a complete Power BI solution that demonstrates end-to-end analytics capability and supports business decision-making.
Pre-Lab Preparation
Using Microsoft Power BI, you should be able to:
- Build a comprehensive interactive dashboard
- Apply drilldown and drillthrough analysis
- Use bookmarks and dynamic titles for storytelling
- Deliver strategic, decision-ready insights
git pull origin branchName
Git Pull
Topic : Develop Executive Workforce Analysis Dashboard
1) Introduction to Power BI Service
2) Managing Data Refreshes
3) Introduction to Power Apps
4) Introduction to Data Gateways
1
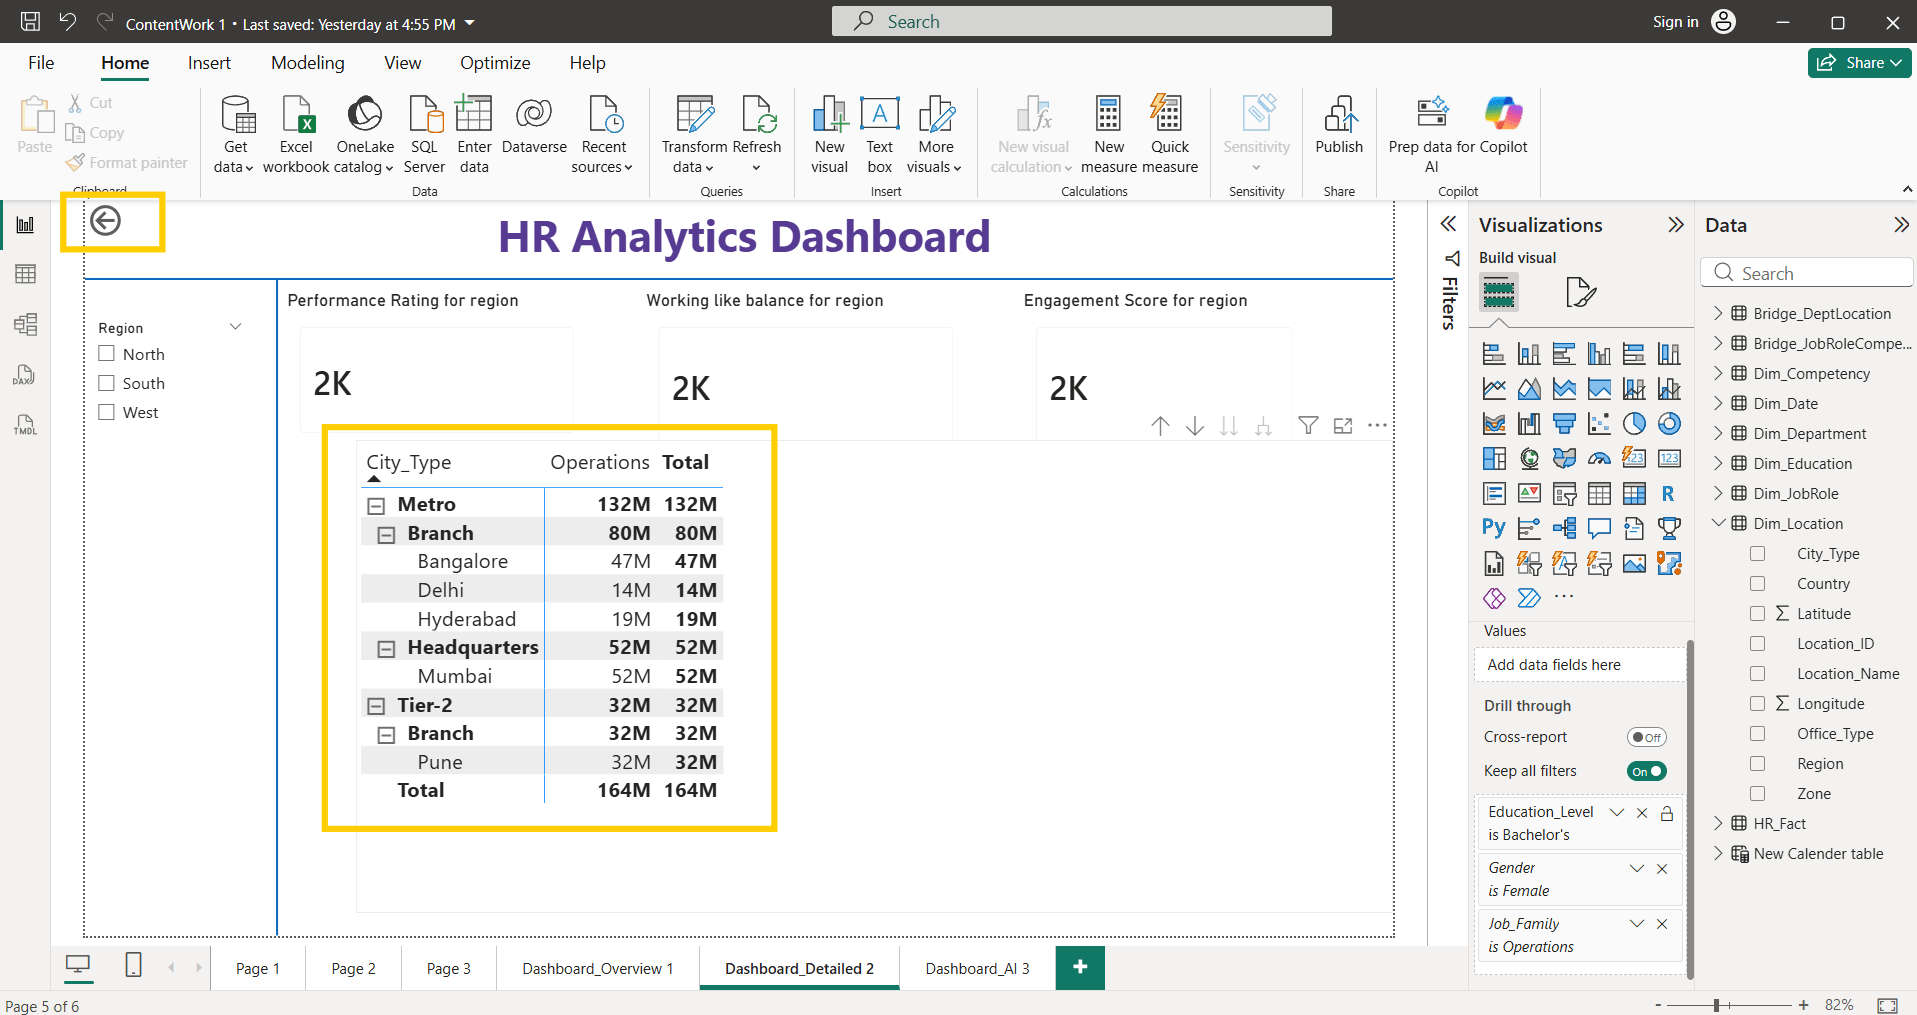
Task 1: Implementing Drill through option
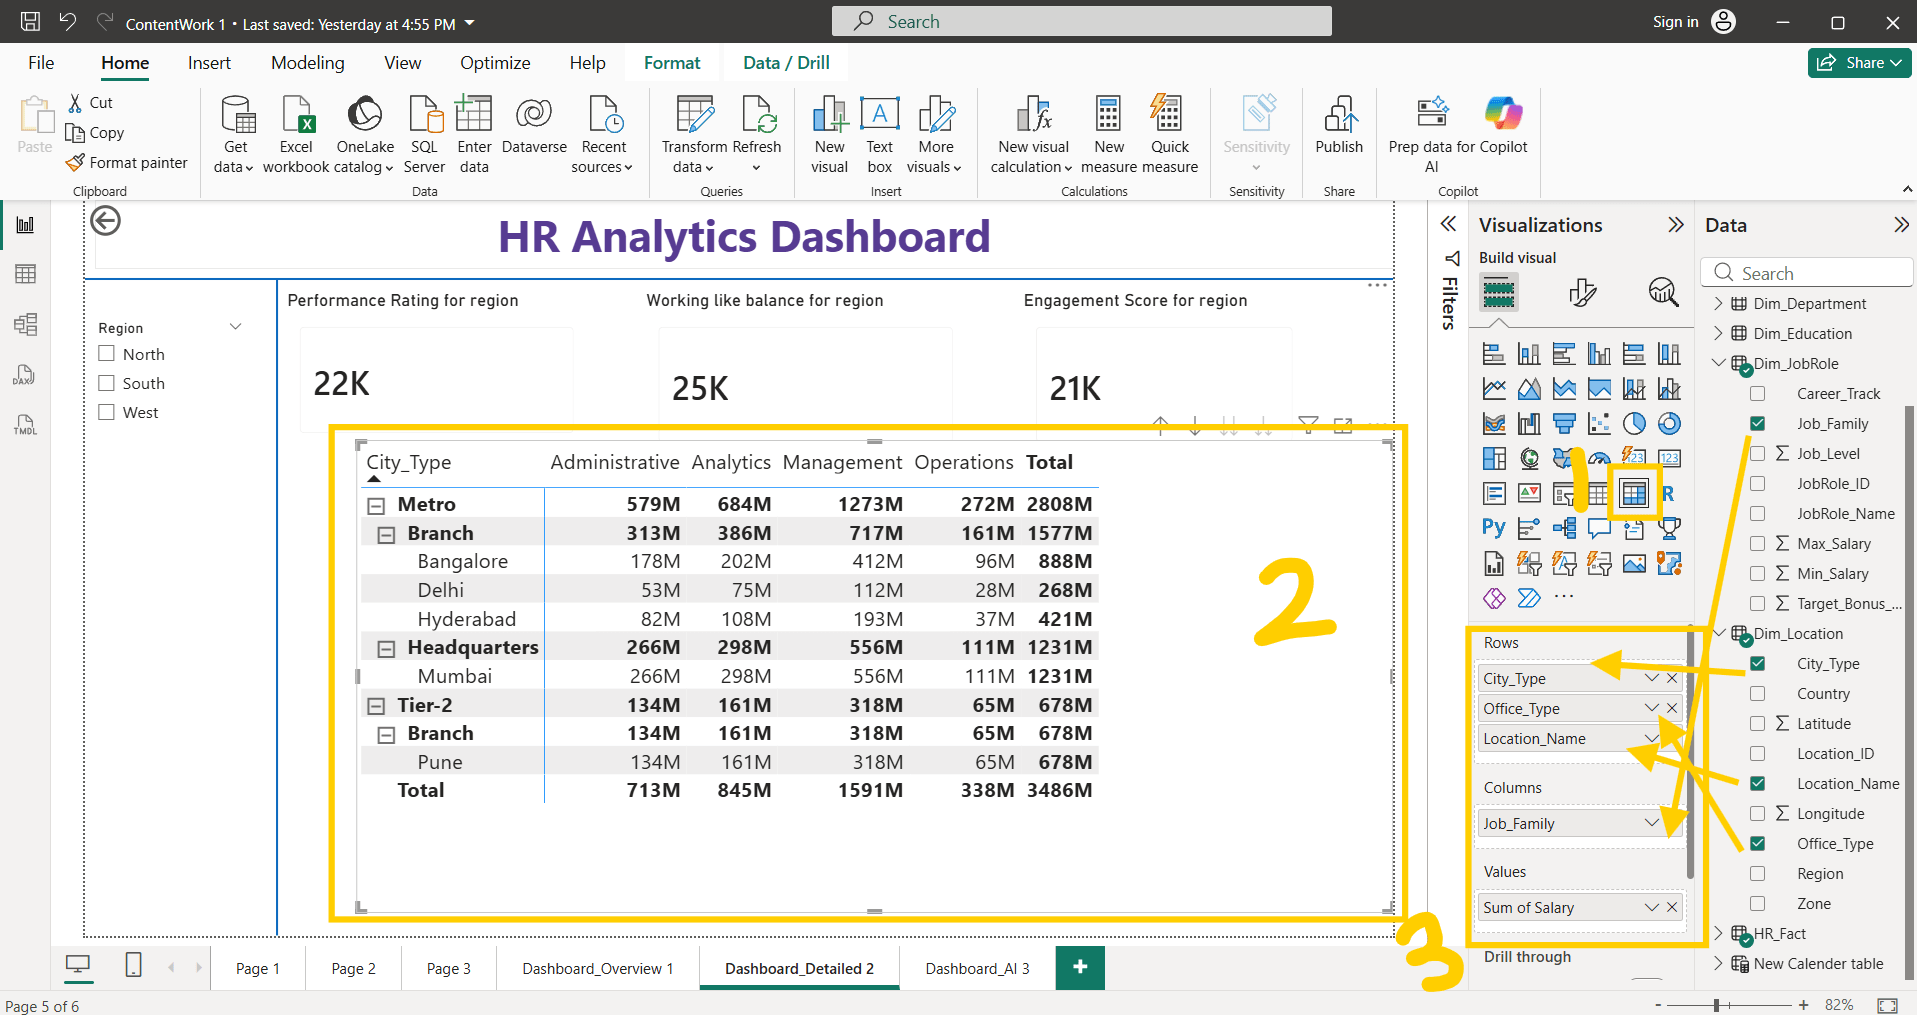
Create new dashboard for using all previous dashboard design , colour and font
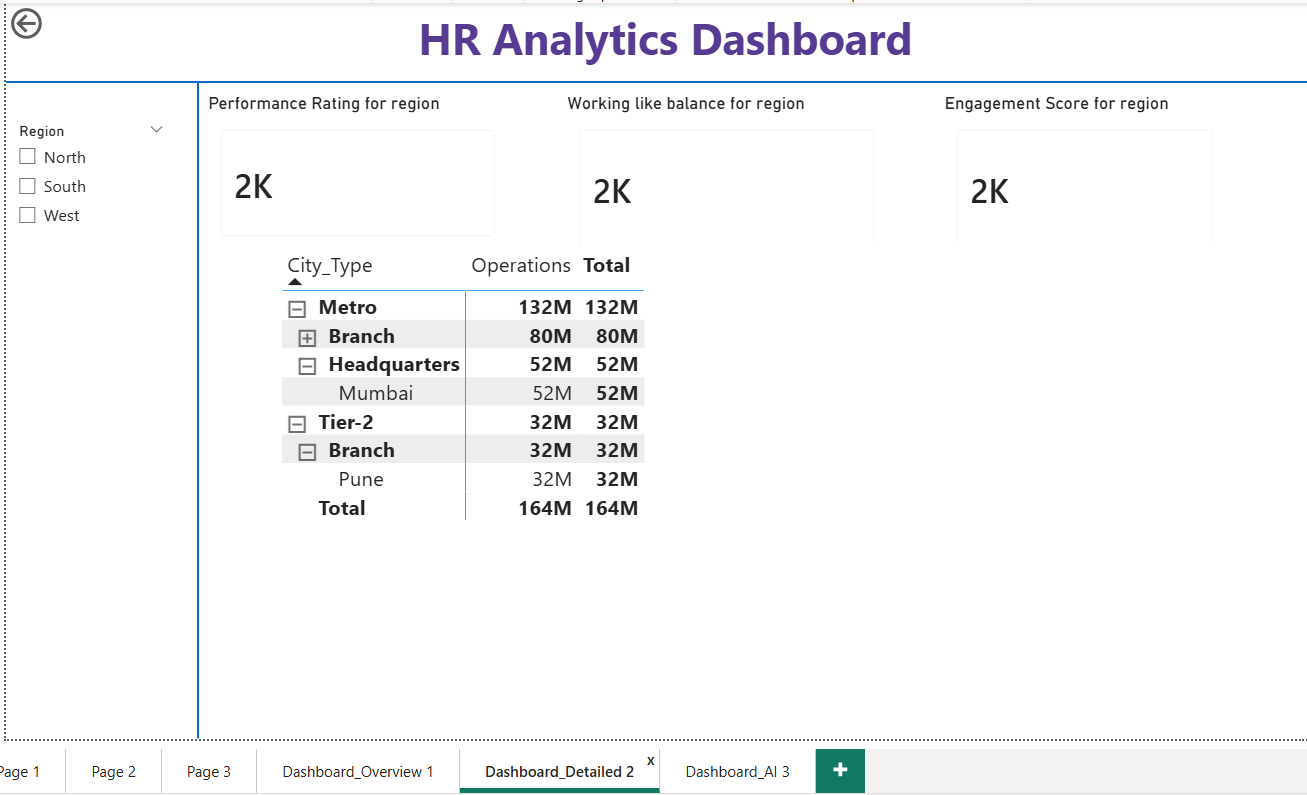
Create new Matrix visualization for detail analysis
2
3
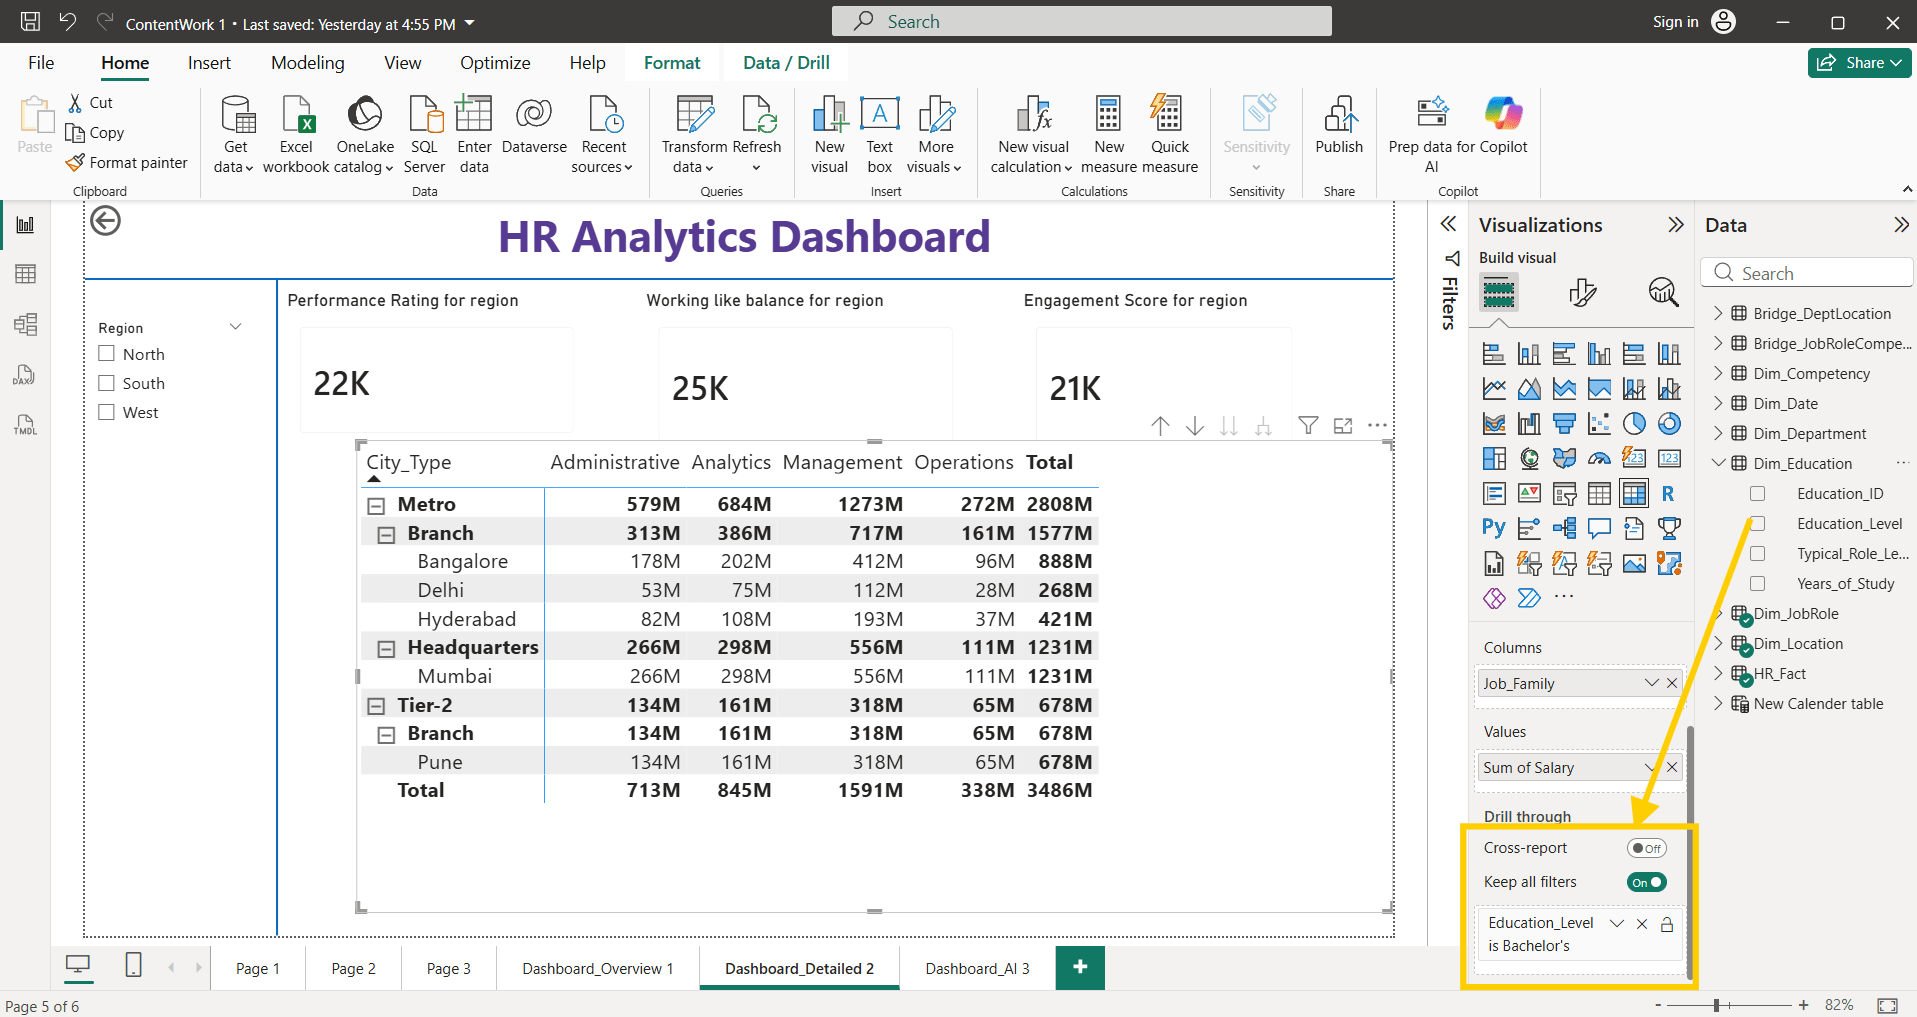
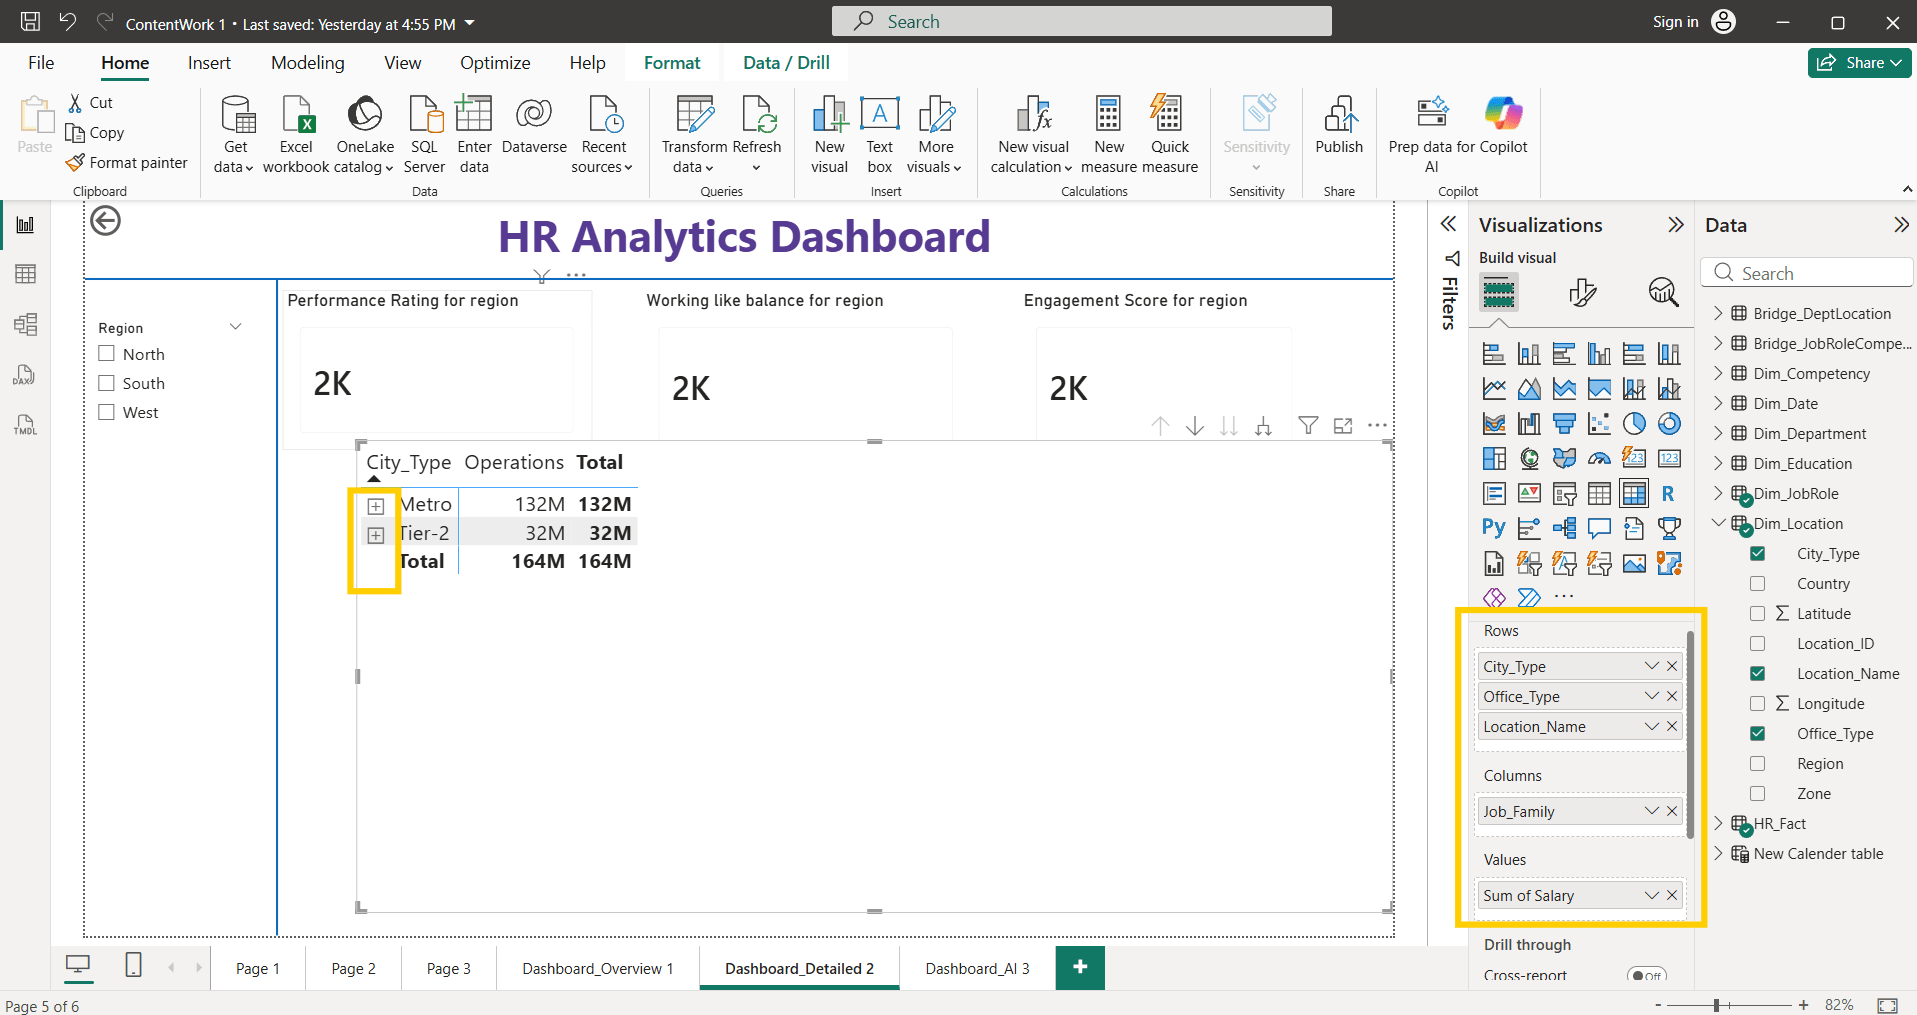
Apply drill through , keep all filters on and add education level in drill through filter option
4
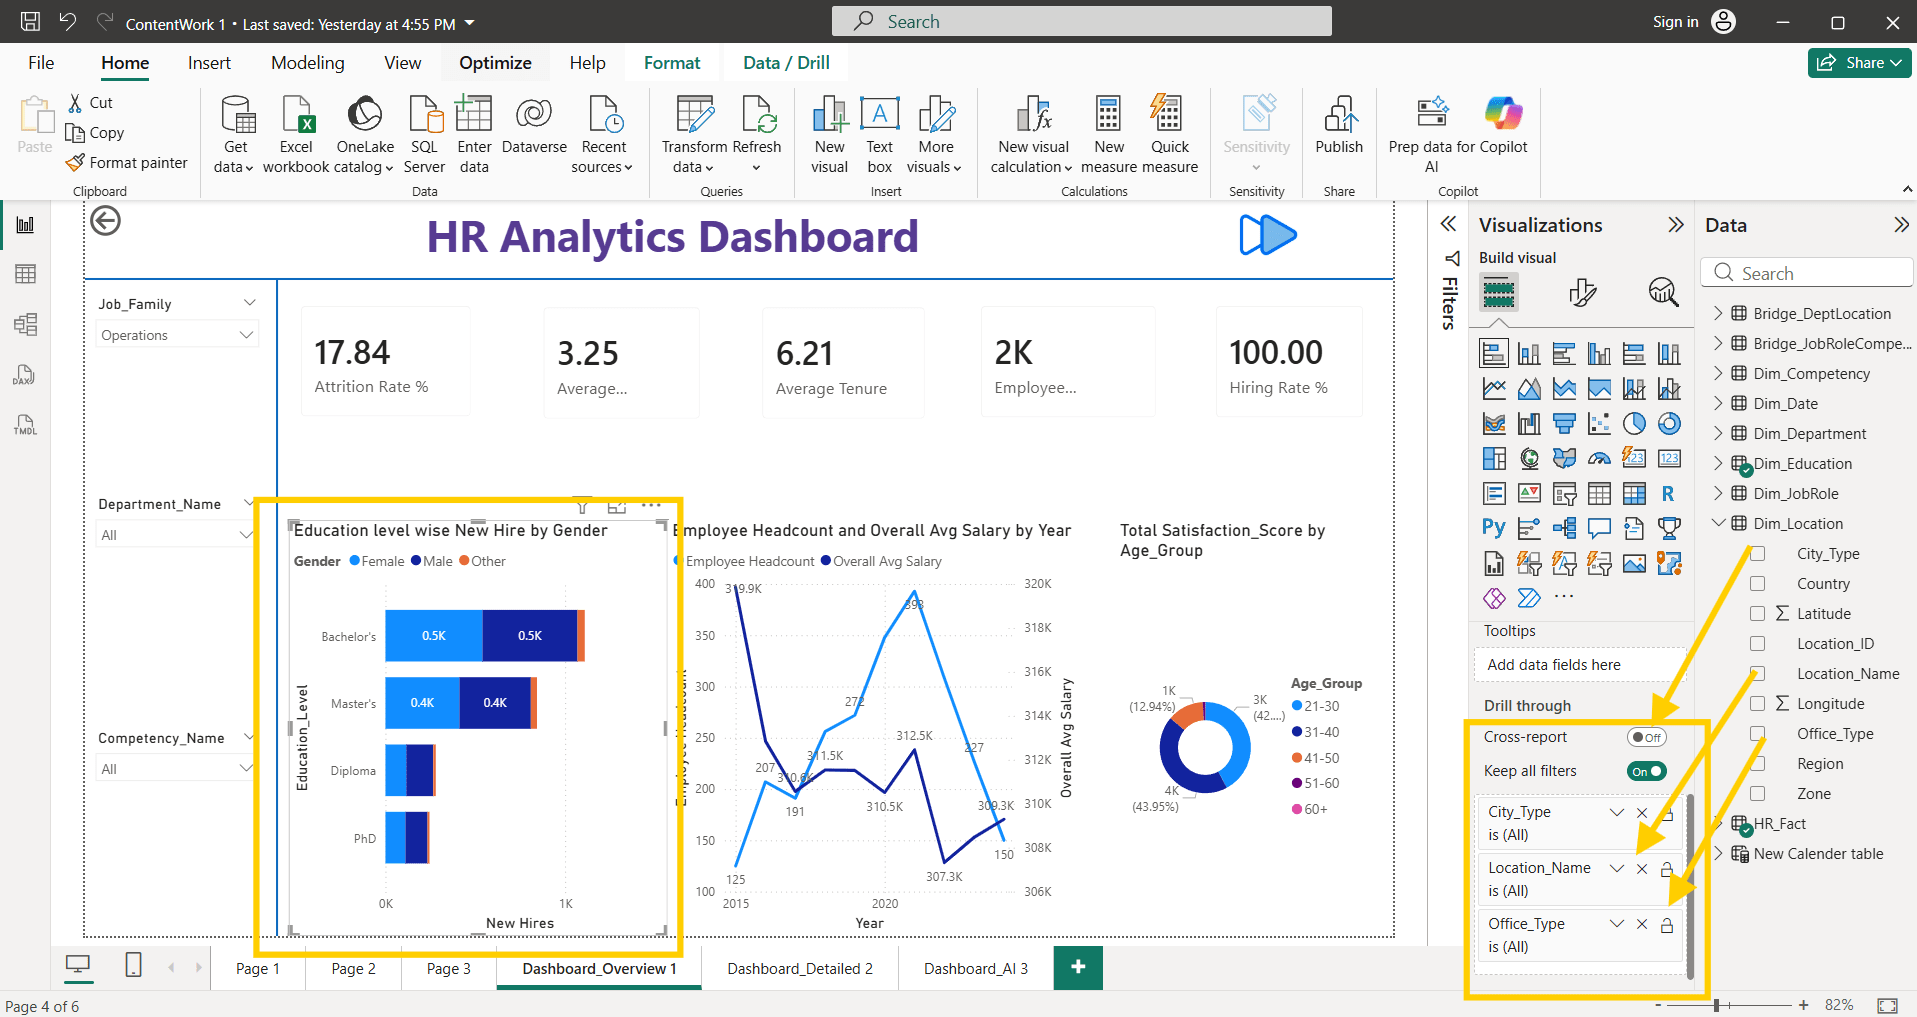
Select the bar chart, apply the drill through option and keep all filters on. Add City type, Location_name, Office_type in drill through filter option
5
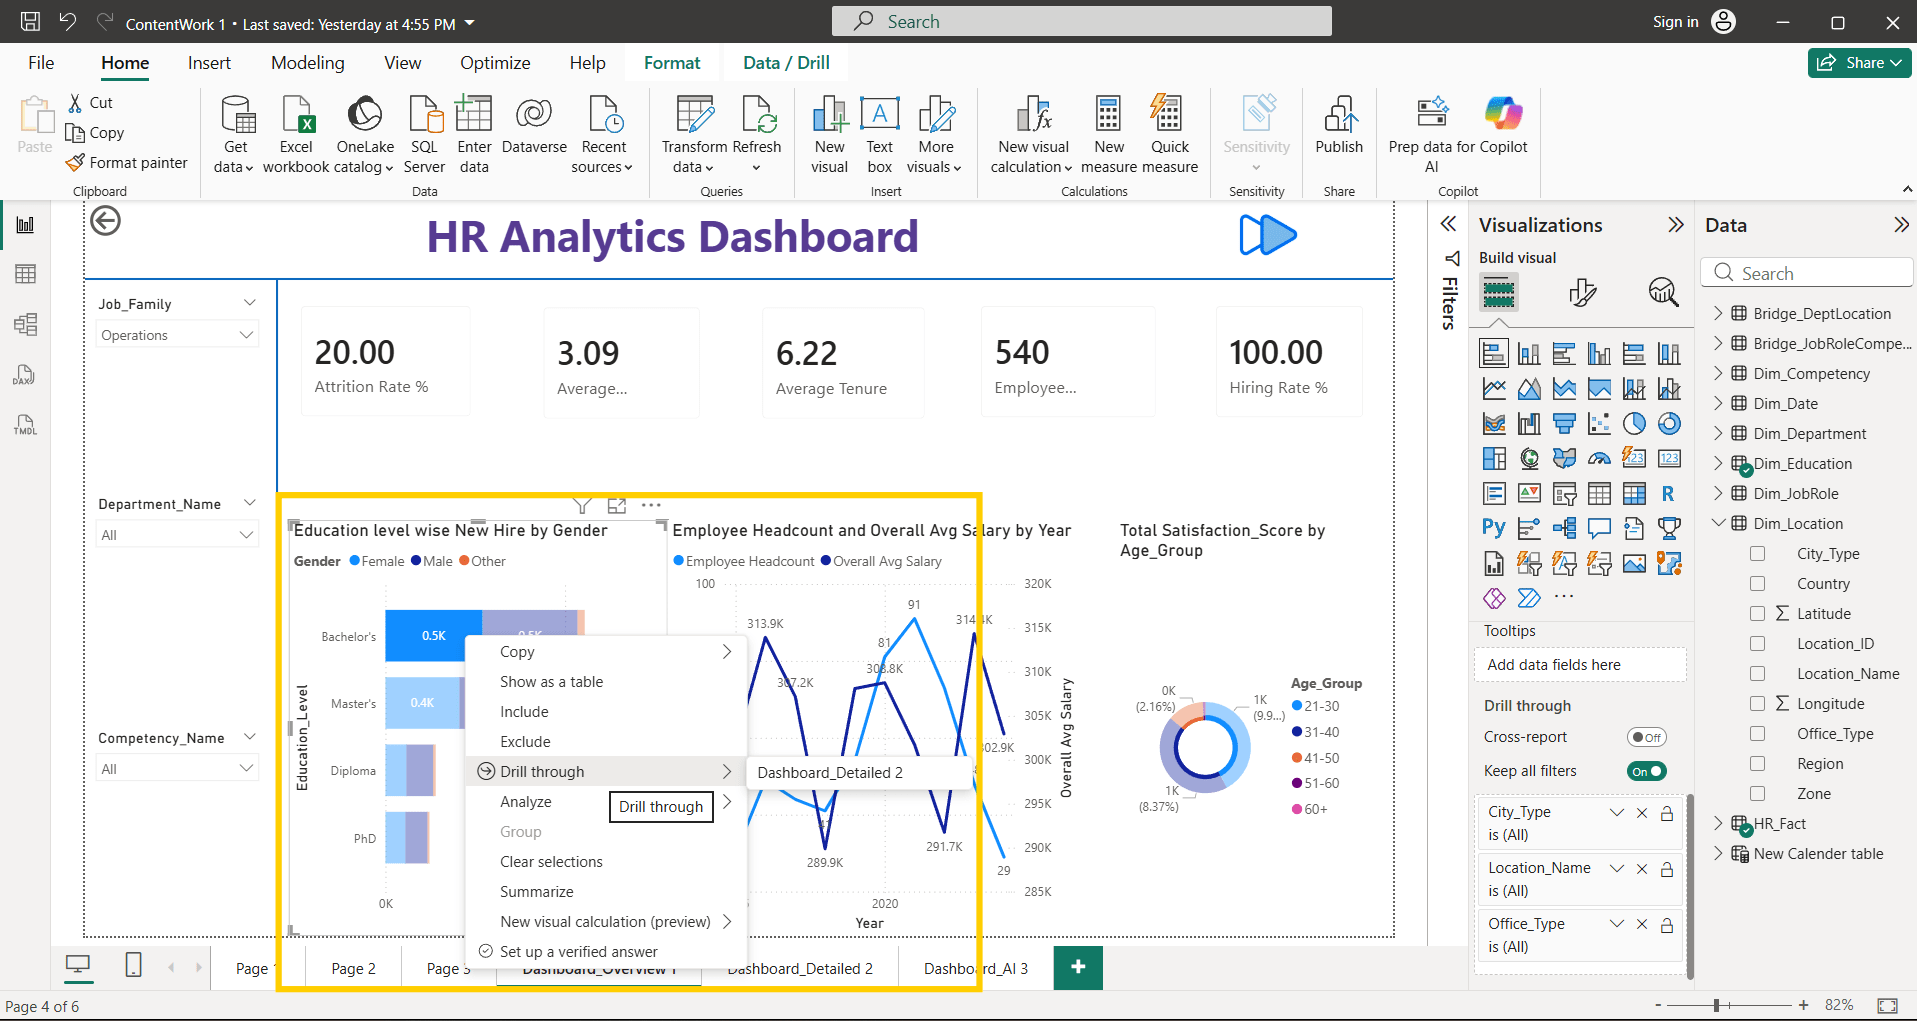
Right click on bar chart and select drill through option
6
Now it navigates to Matrix visualization and also filters data with Bachelor's degree. Back button also available for Main Dashboard
Task 2: Implementing Drill down option
1
We can add hierarchy level as city_type —> Office_type —> location_name in row part, Job_family in column part, Sum of Salary in values part
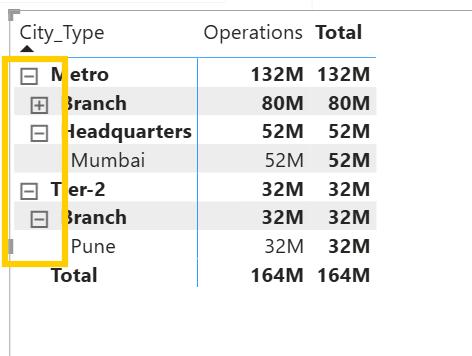
Click on + sign for go deeper level, Click on - sign for go upper level
2
Task 3: Add bookmarks
1
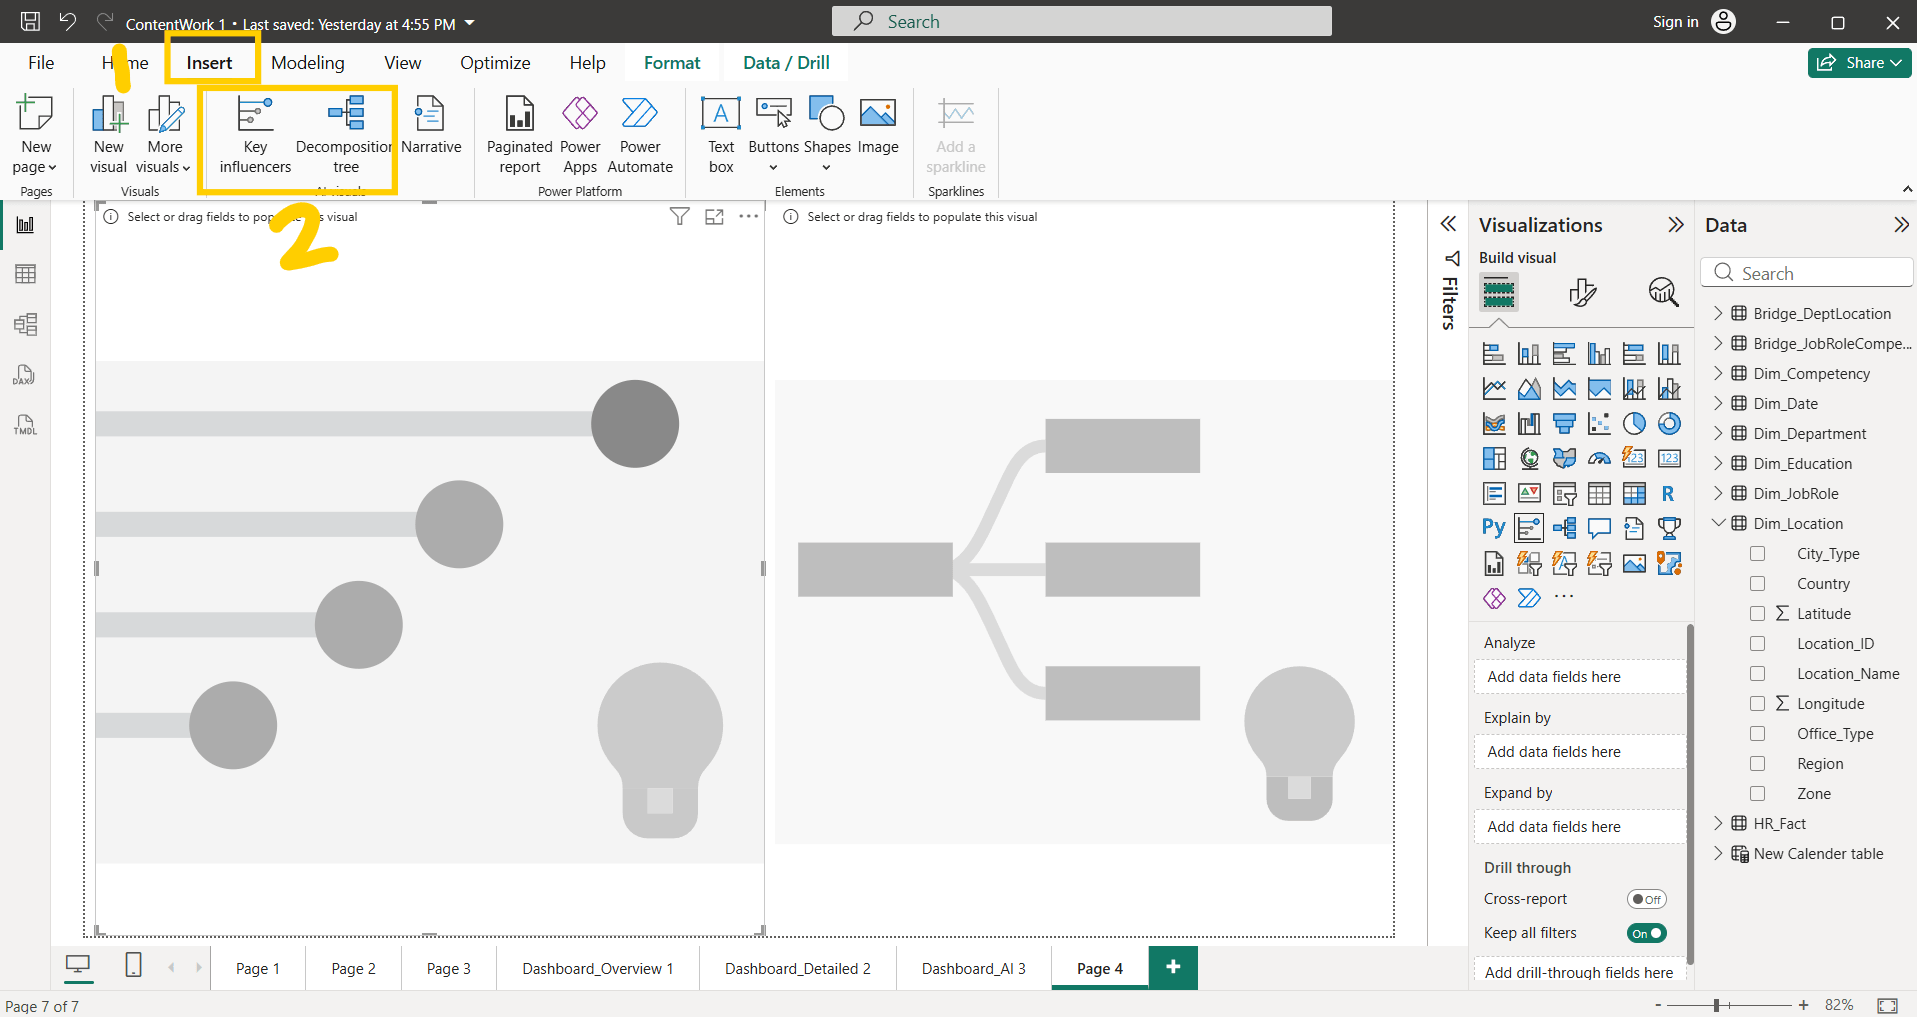
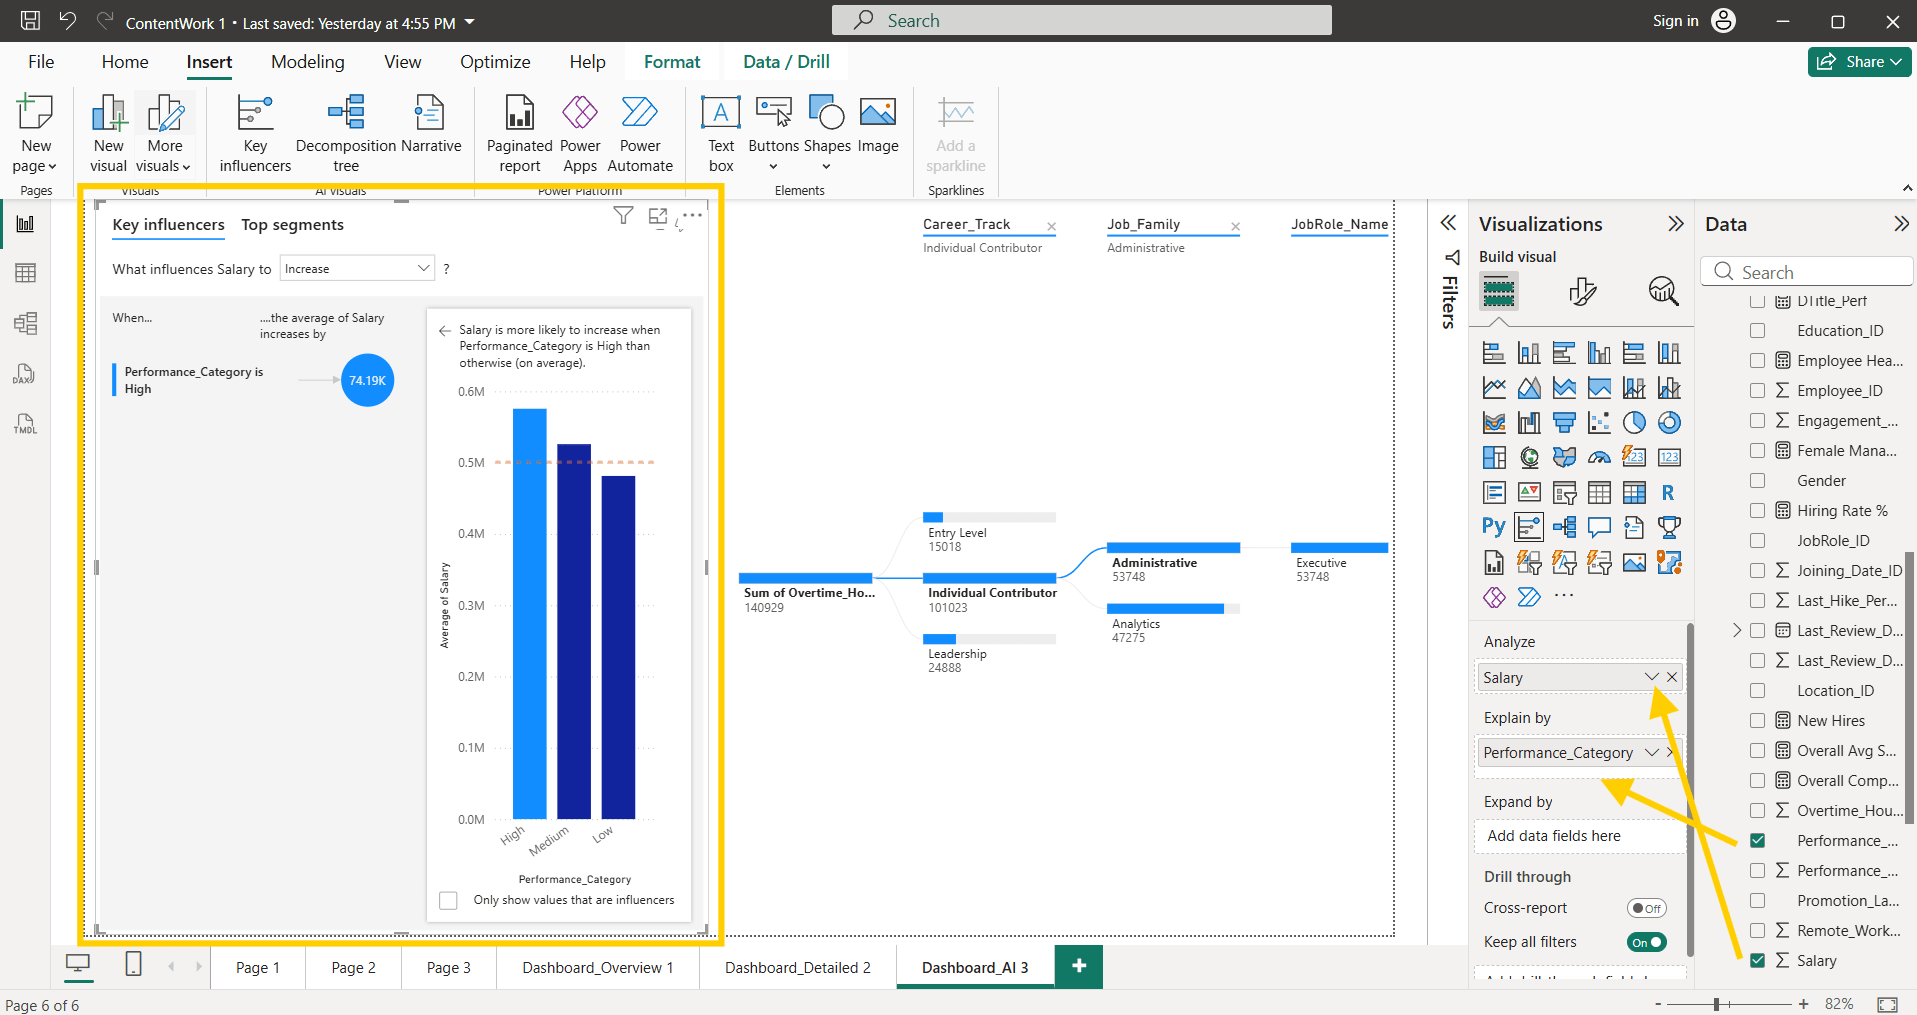
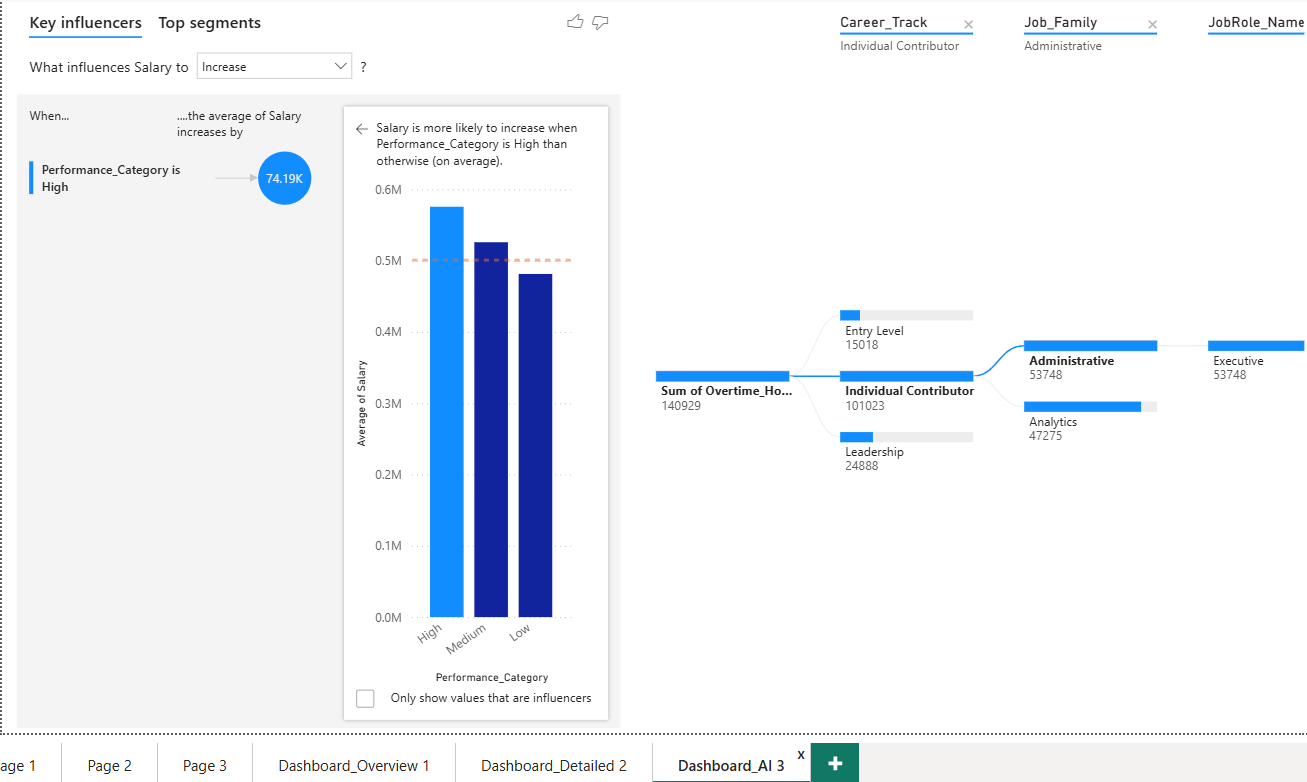
Add AI visualization from Insert Tab : Key Influencer, Decomposition key
2
For Key Influencers, add fields
a
AI visualizations
For decomposition tree , add fields
b
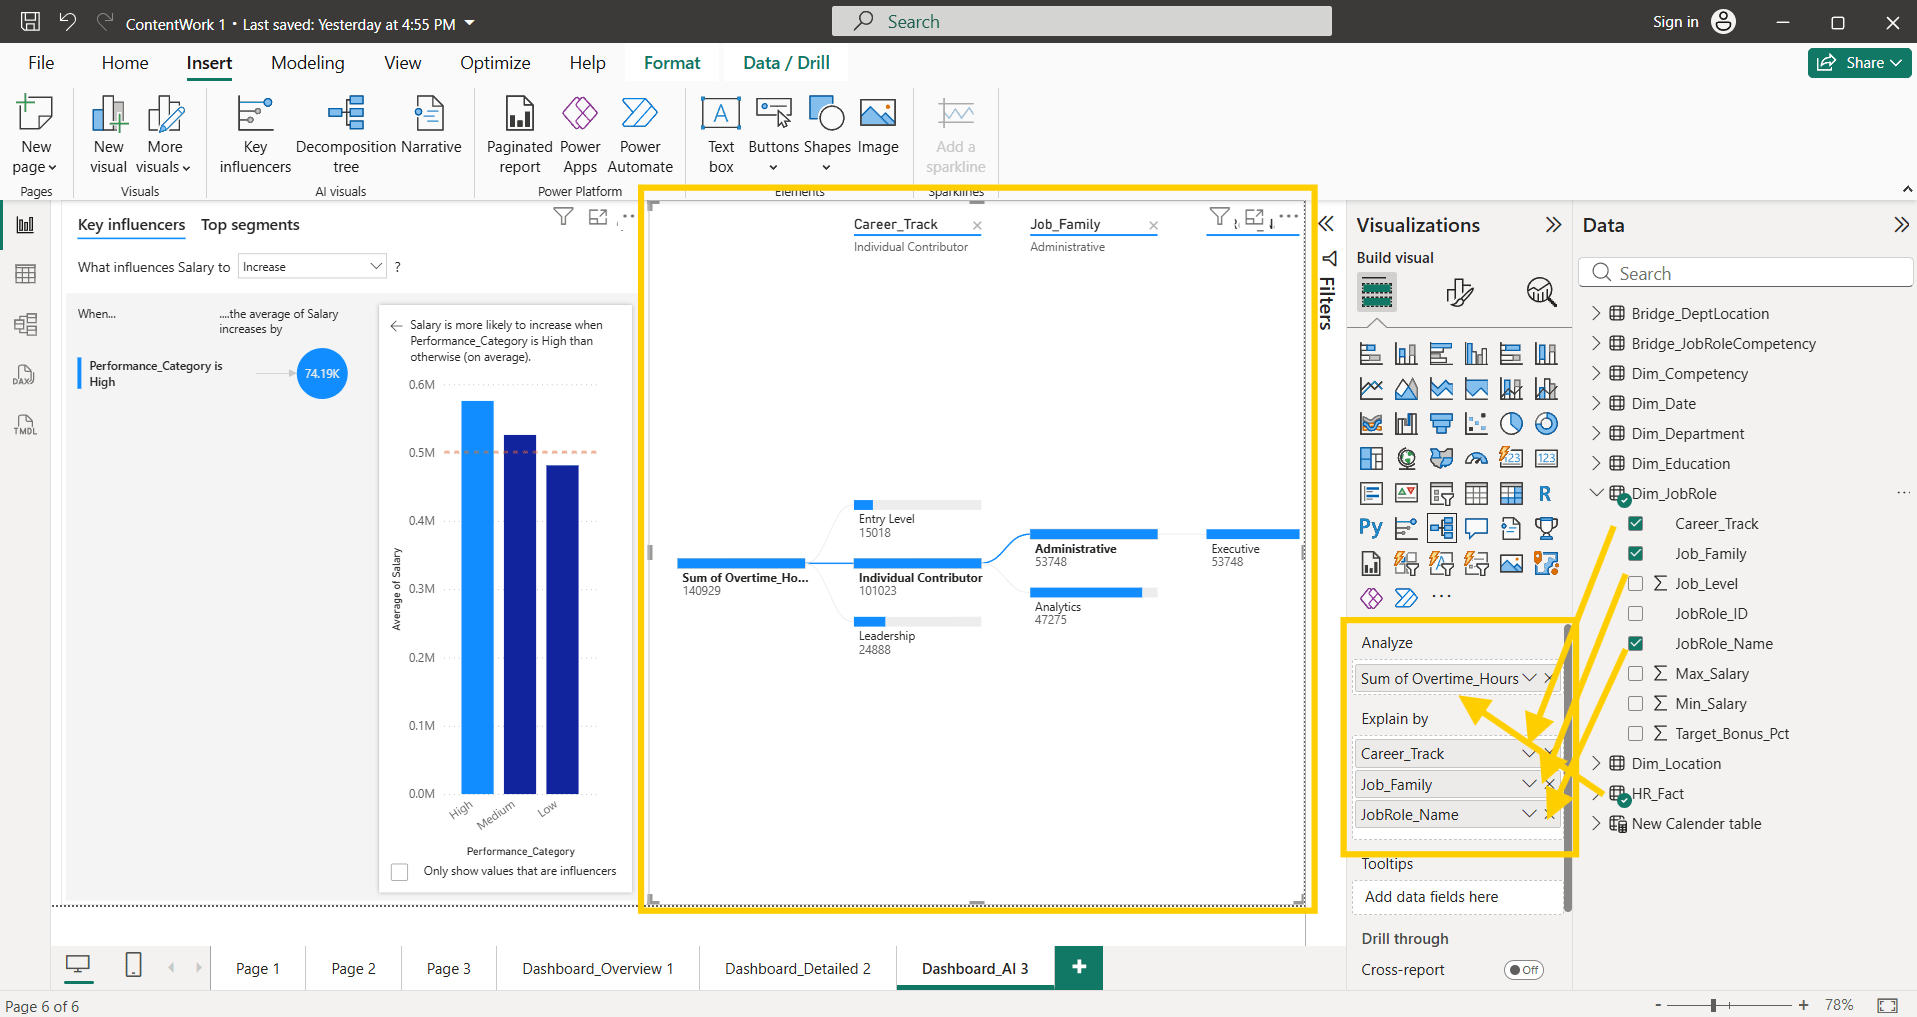
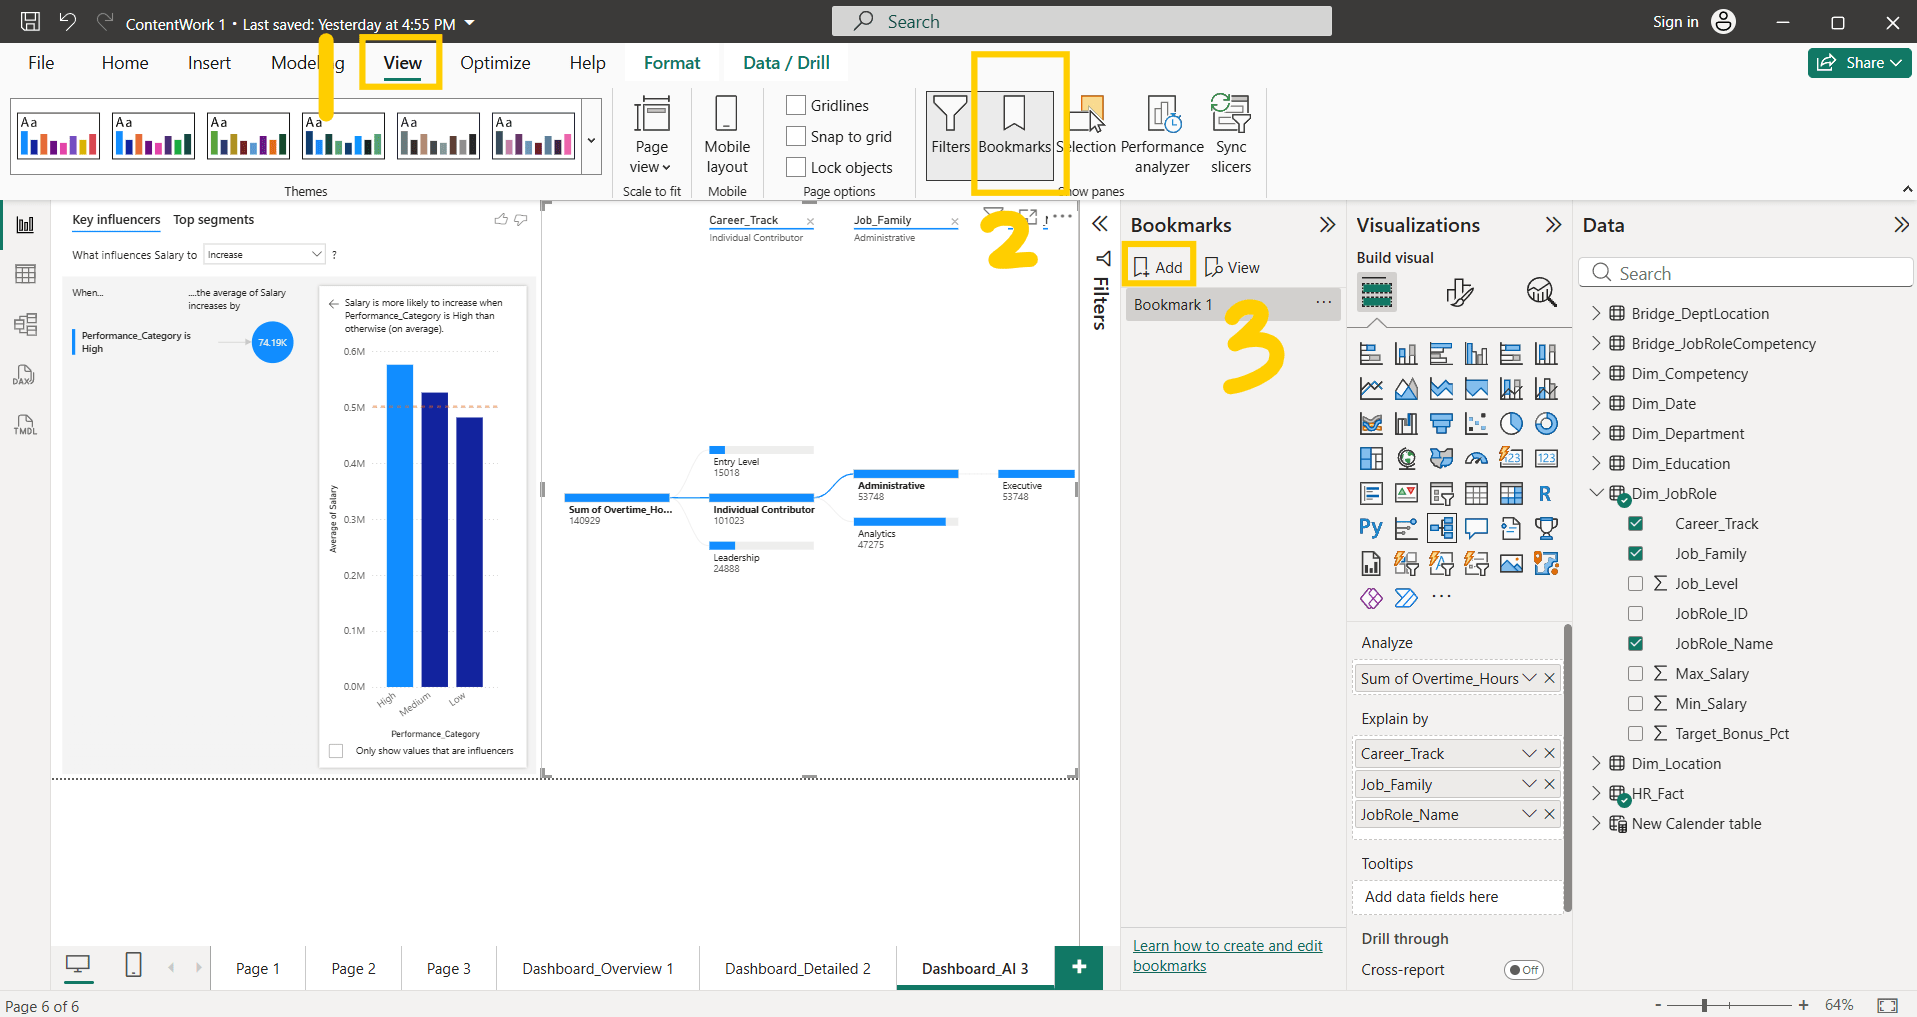
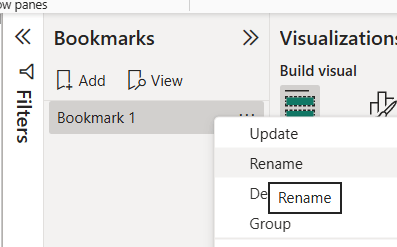
3
Add bookmark for this page and rename this bookmark 1 by right click on it
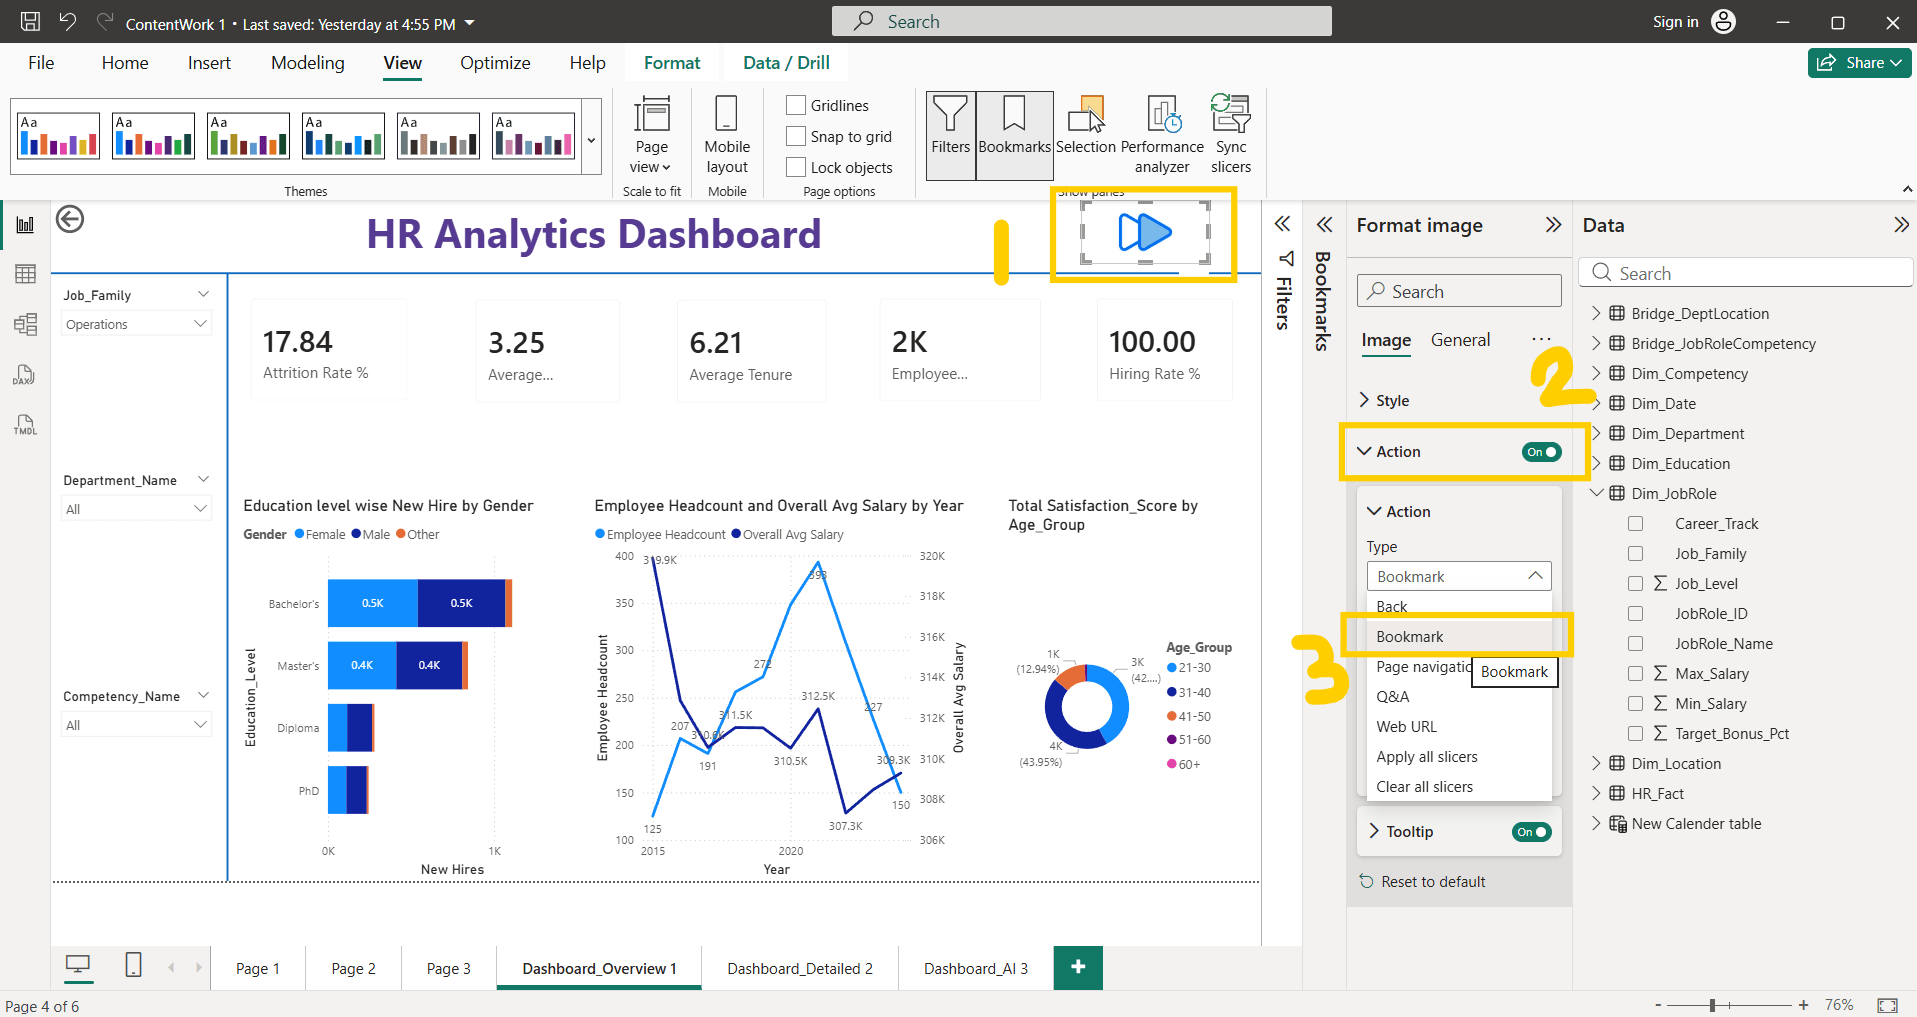
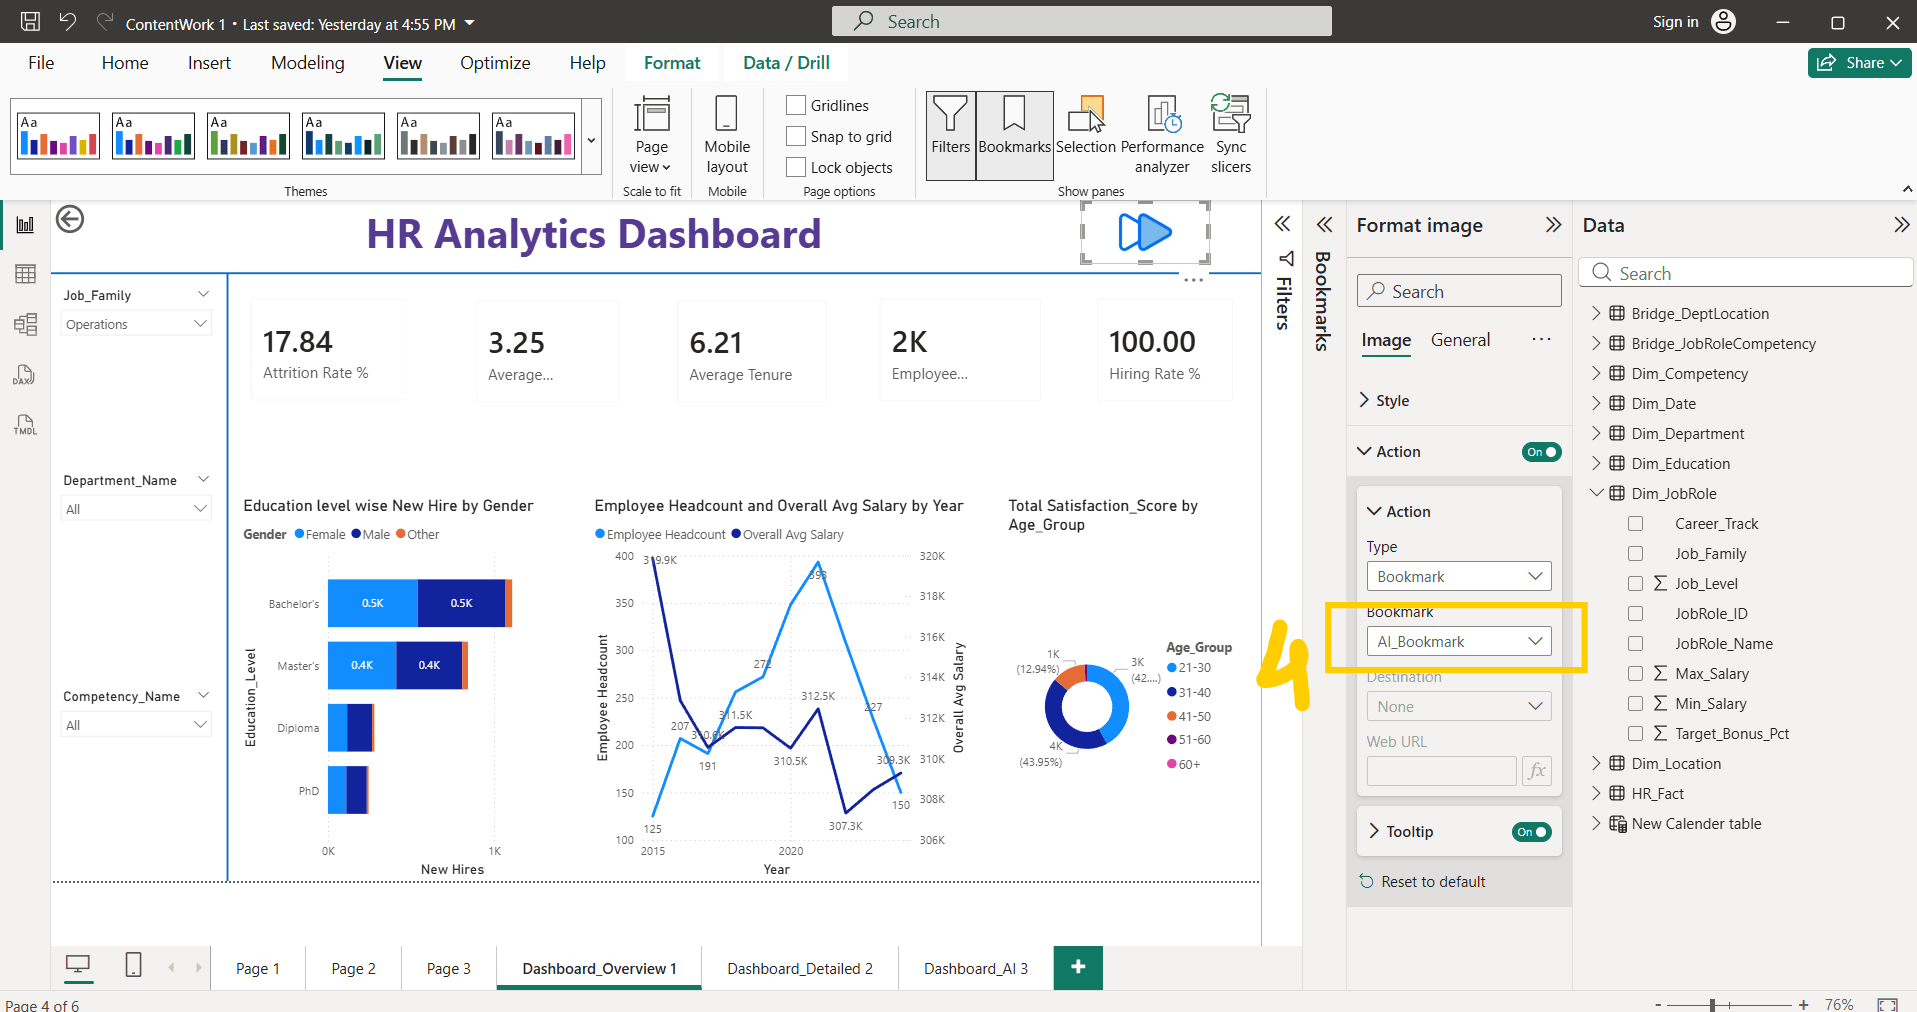
4
Download and Add Image to Main dashboard, Format image —> Action ON—> Action Type —> Bookmark, Select Bookmark page
Ctrl + click on button or image it navigates to bookmark page
Task 4: Add dynamic titles
1
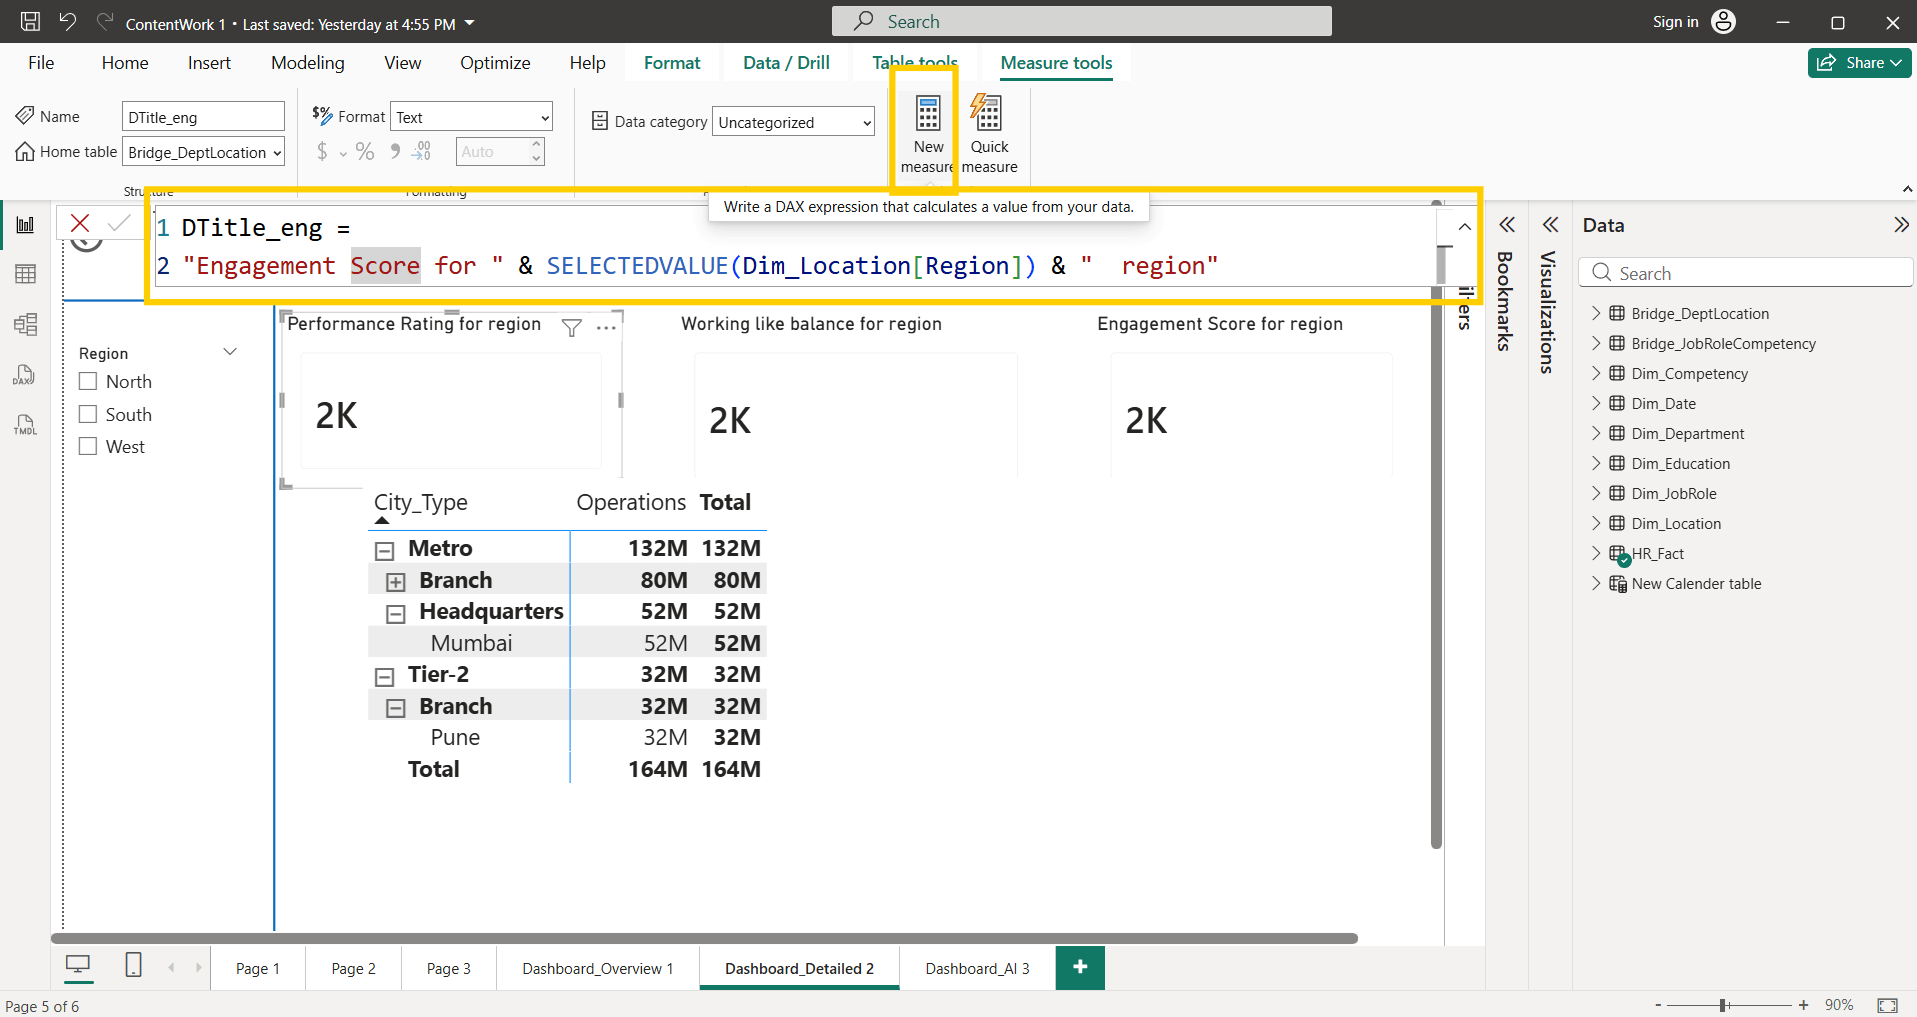
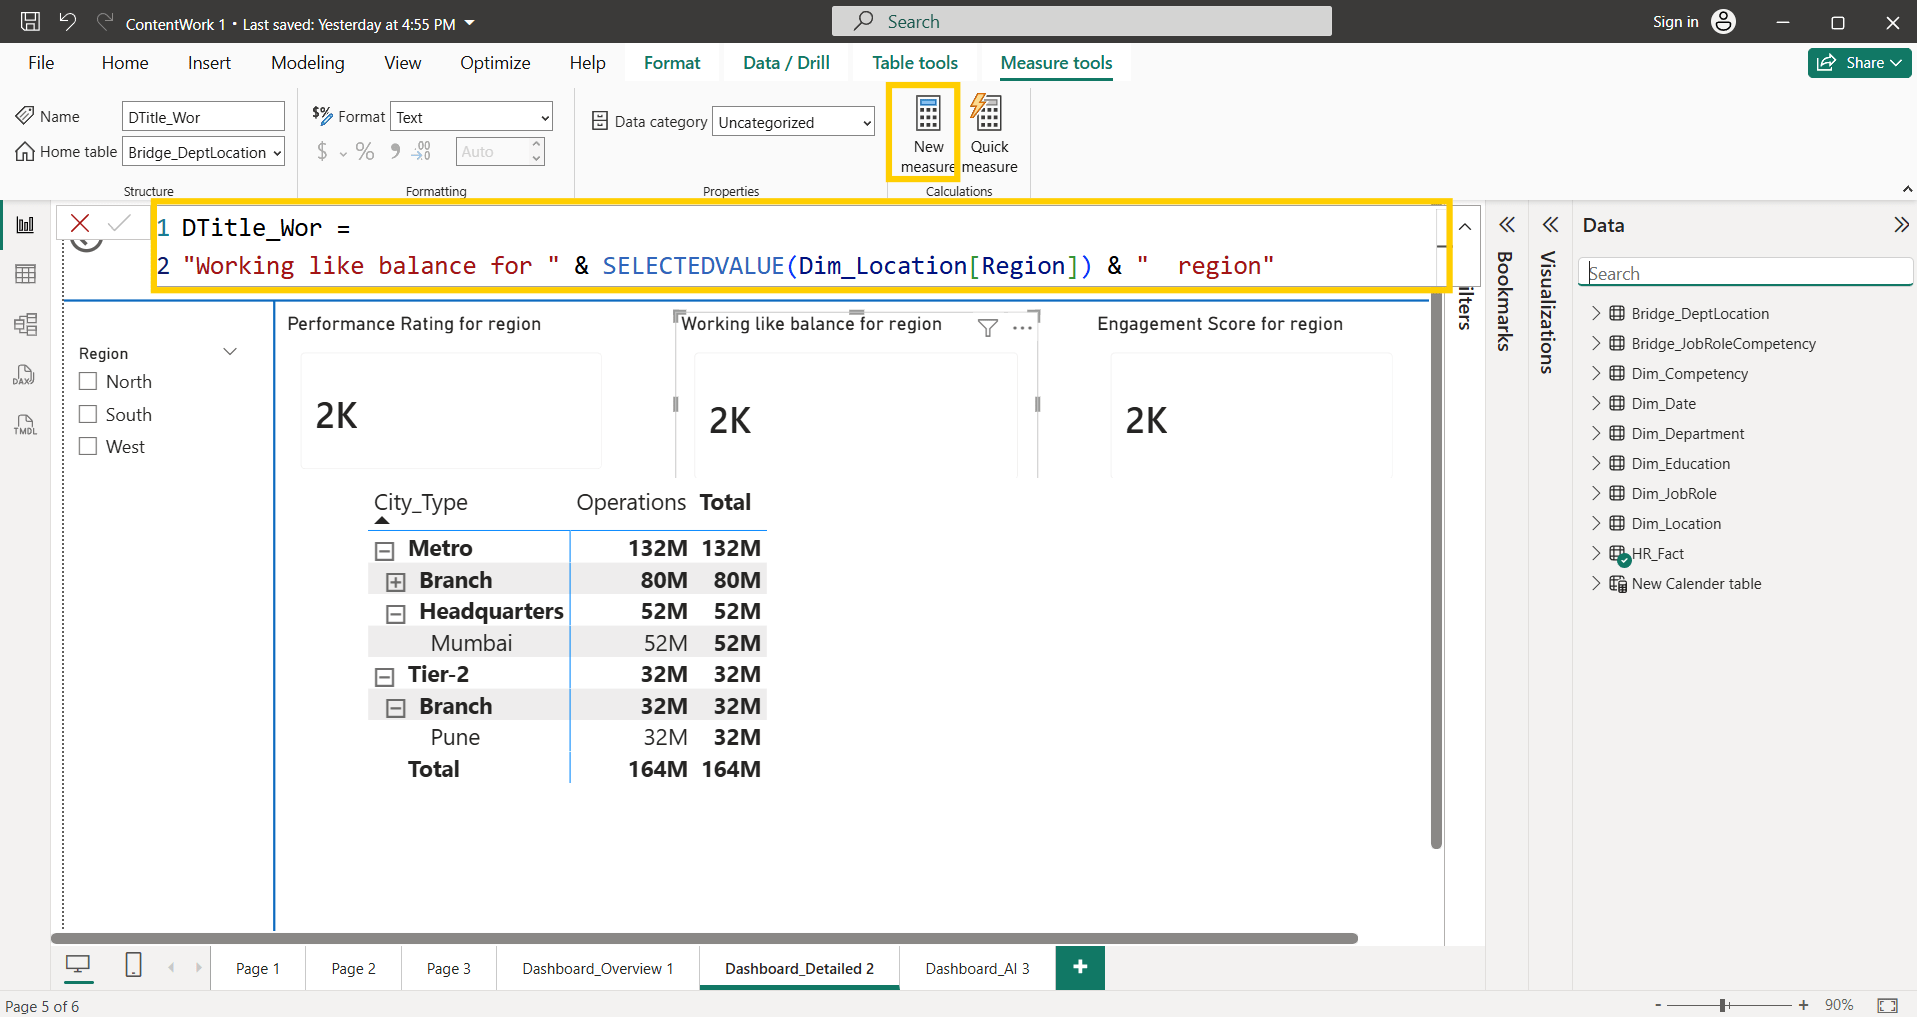
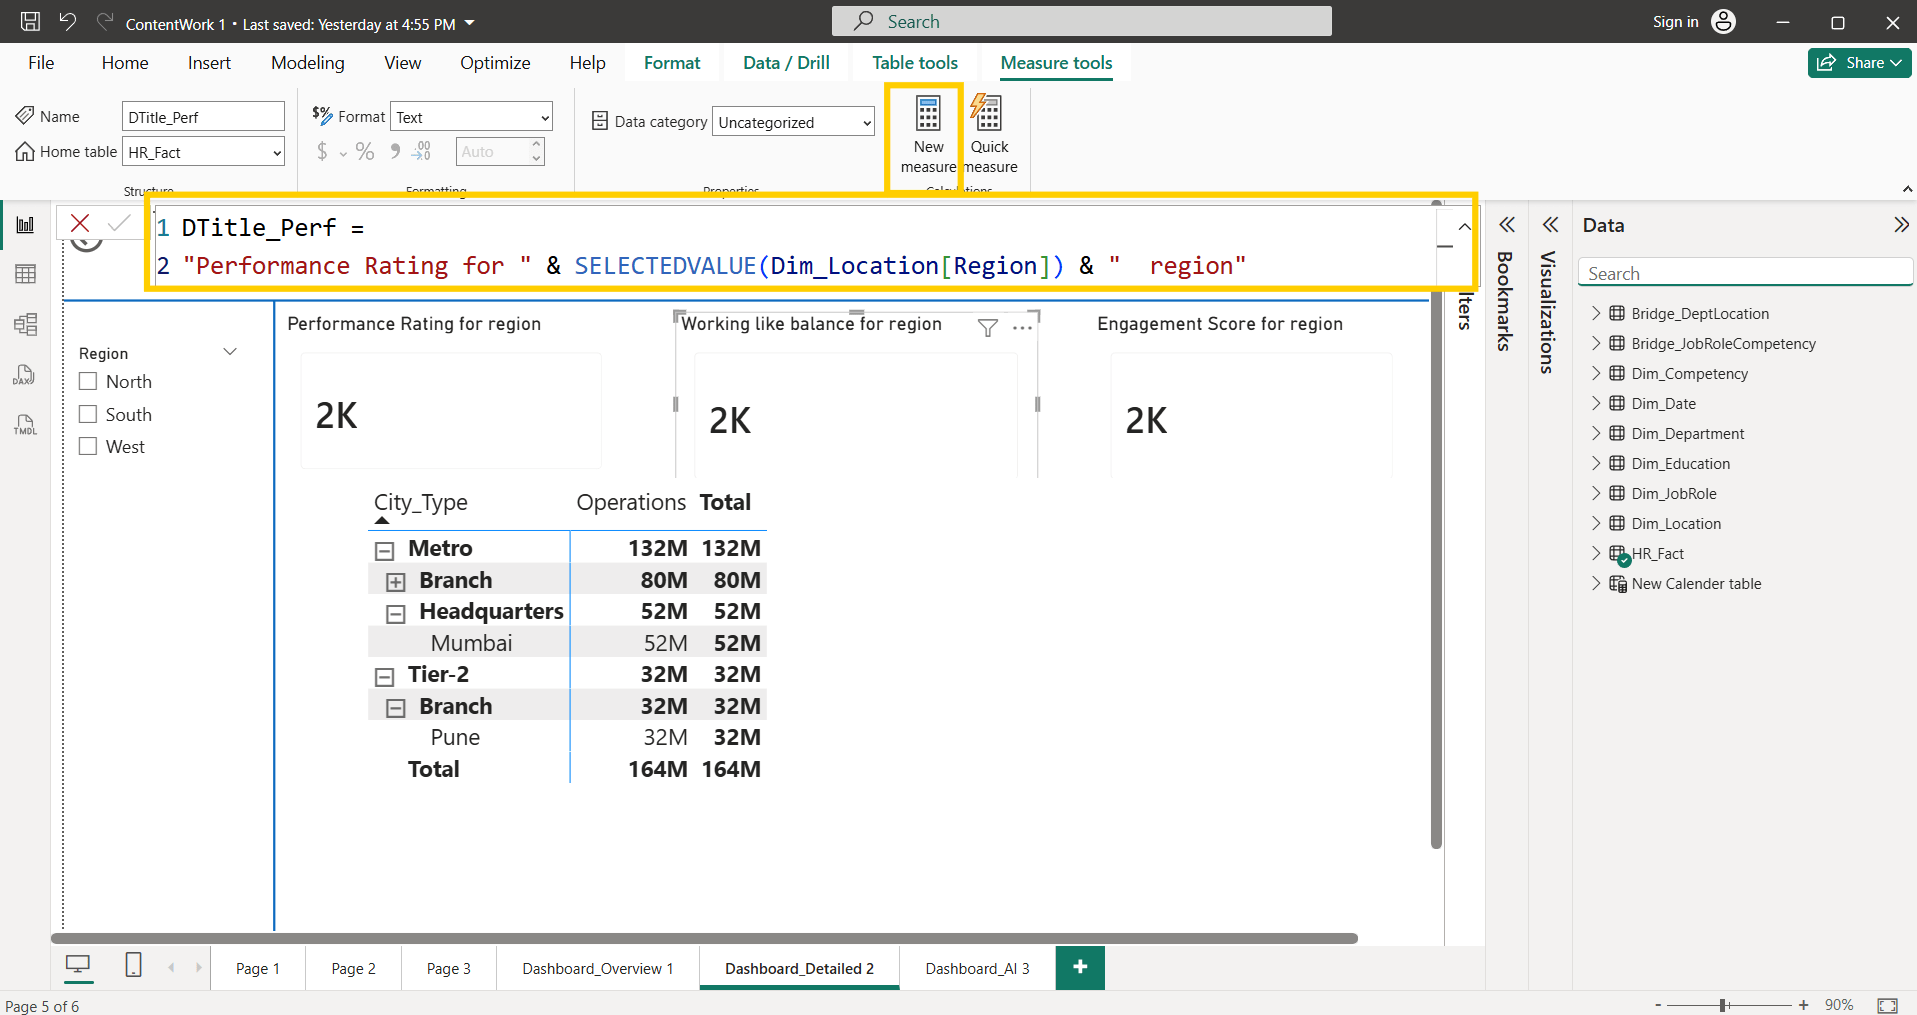
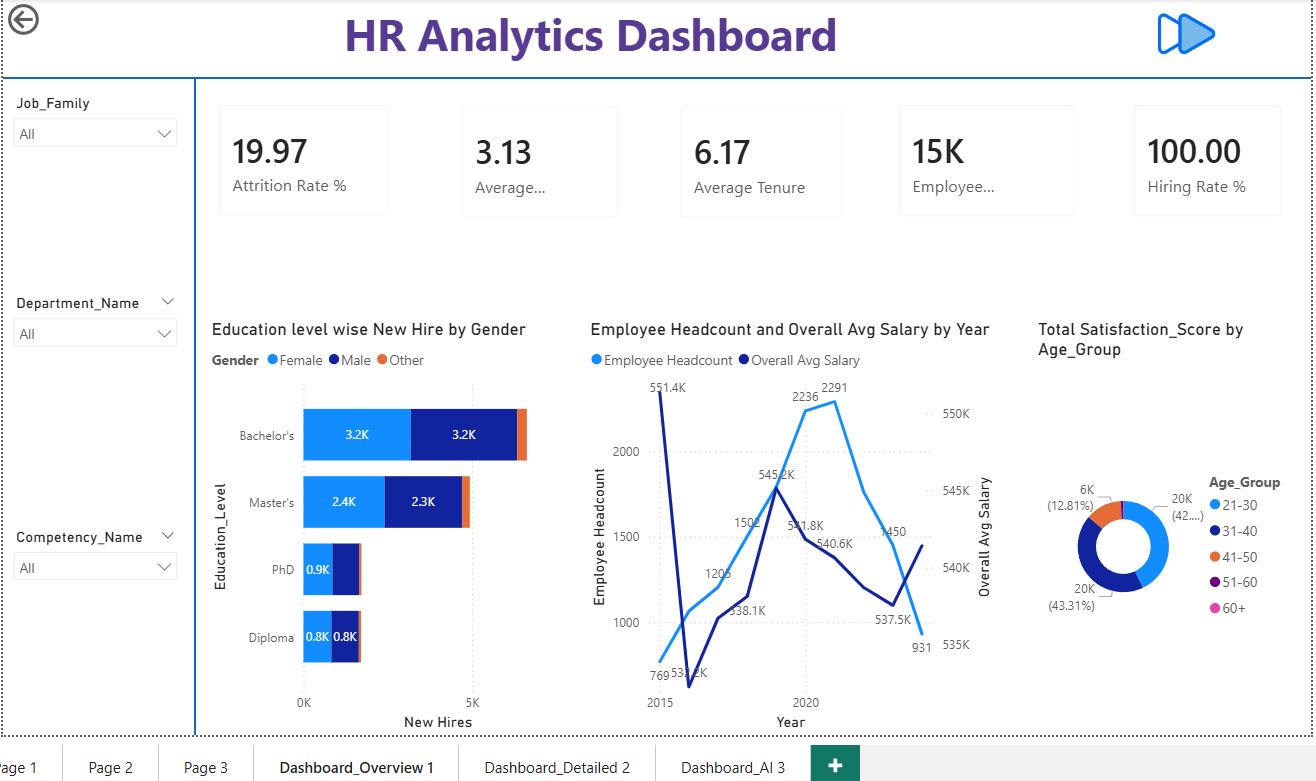
Create 3 measures for 3 KPIs
Add Region Slicer on left layout of the dashboard
2
Add 3 Cards for 3 KPIs respectively, Edit Title of each card using Fx option
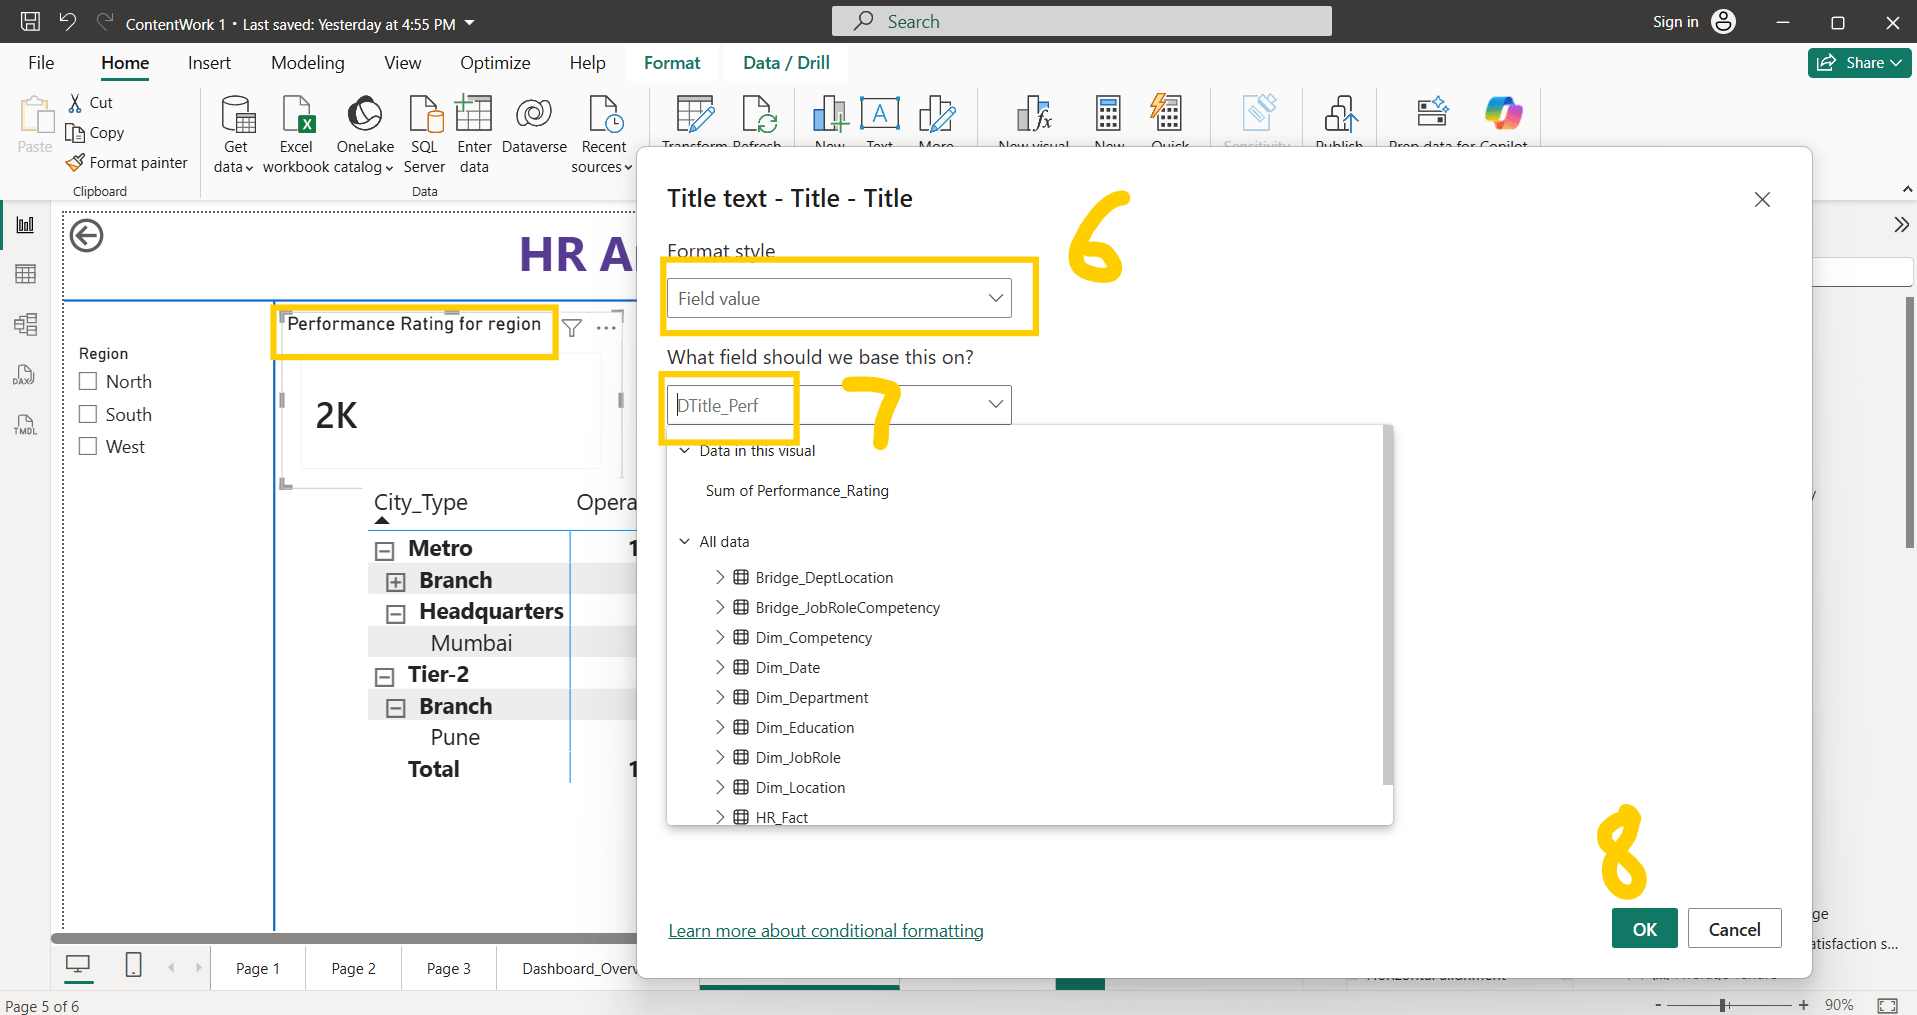
3
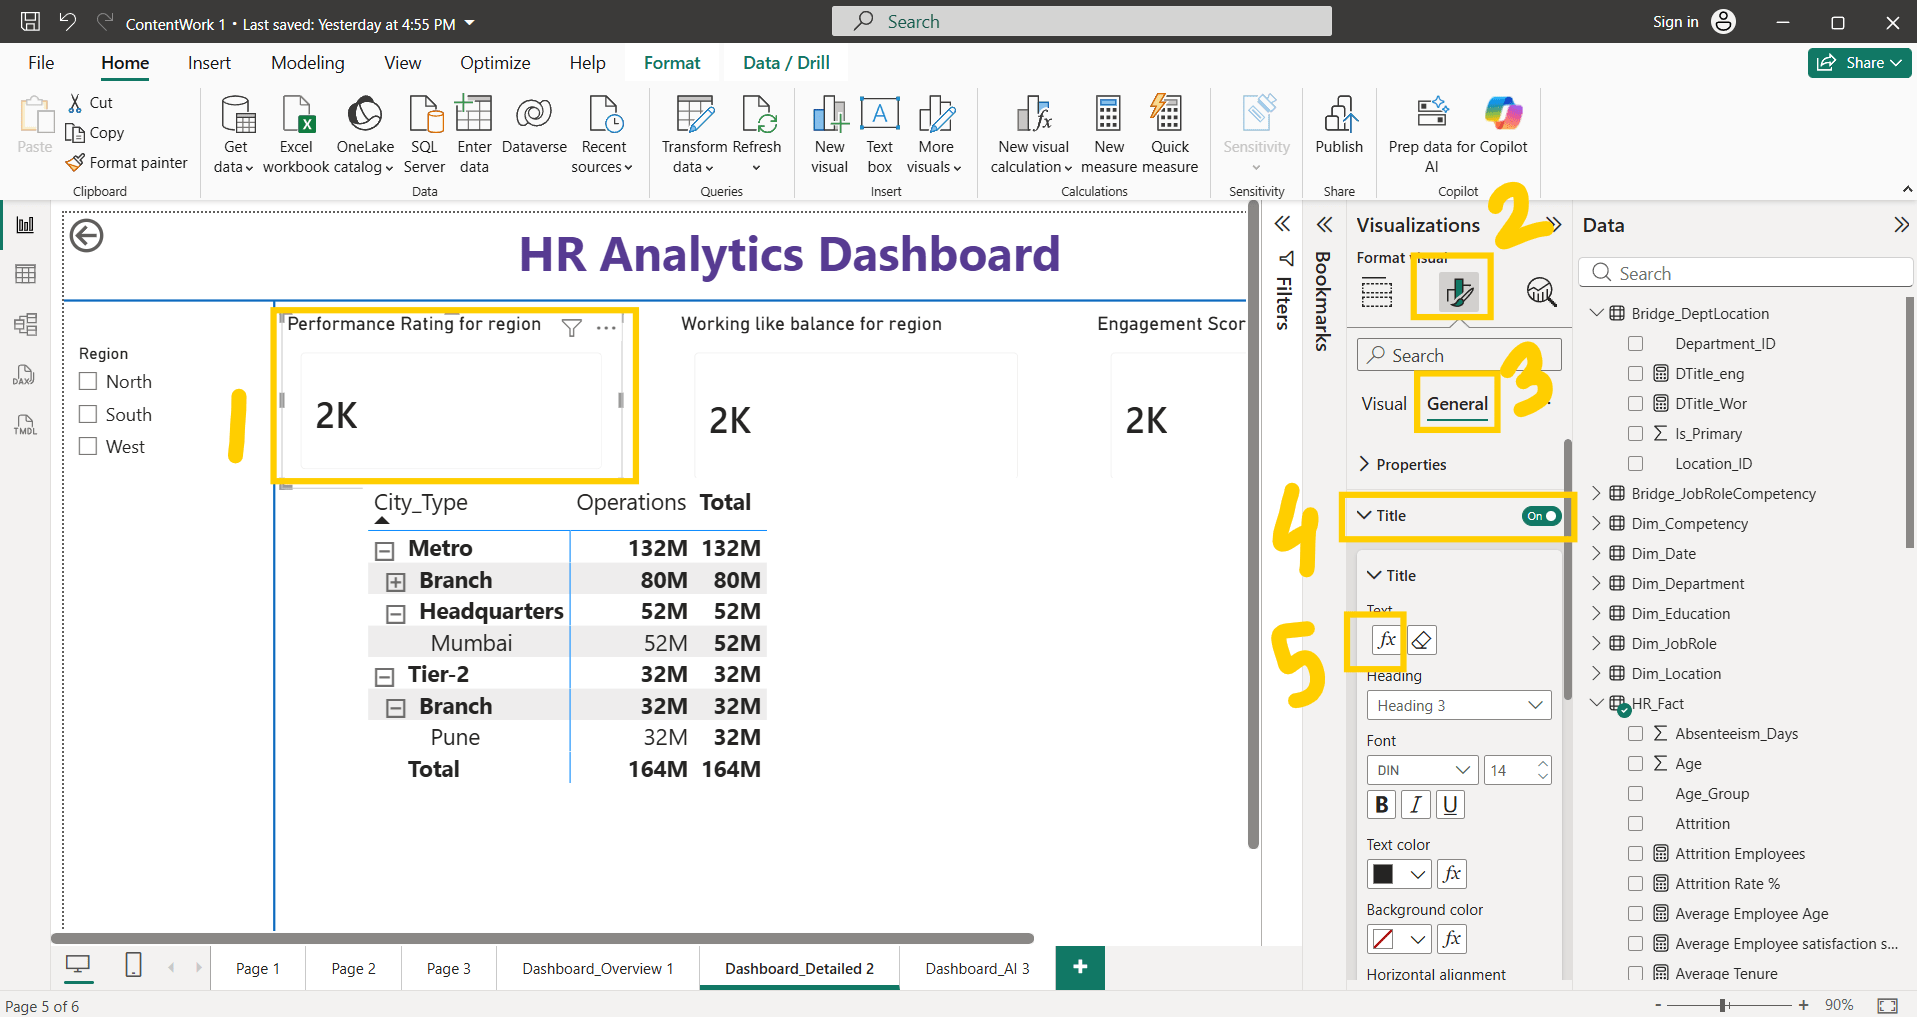
Select field value —> DAX calculation from dropdown —> OK
4
Repeat same steps for all 3 cards, 3 KPIs
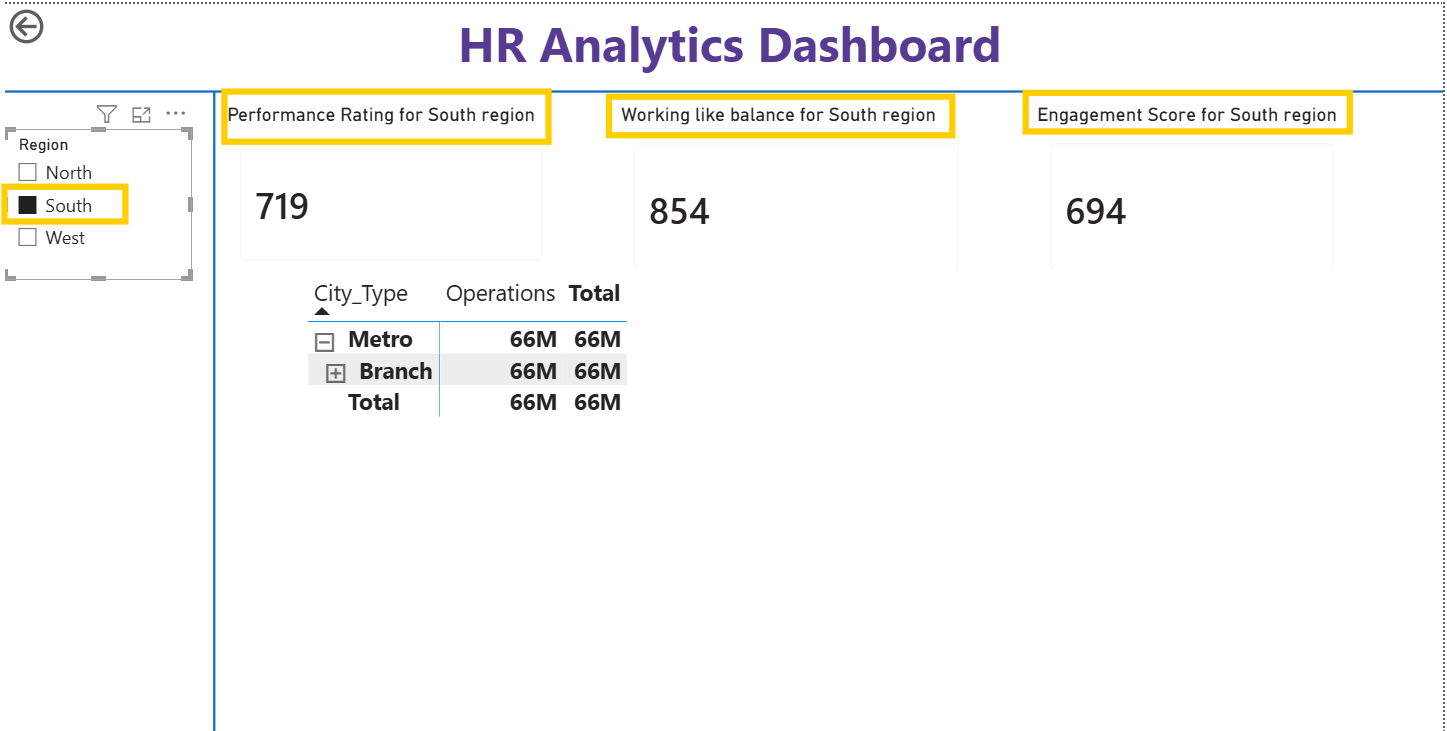
Final Output
5
Task 5: Final Formatting and publishing
Make sure all visuals , slicers, headers, chart titles , buttons text boxes of same font size, font style and same colour theme
Final Output : Dashboard 1(Main dashboard)
Dashboard 2(drill through enabled, dynamic title enabled)
Dashboard 3(AI visualisation, Bookmark enabled)
Great job!
You have successfully completed your Power Bi final dashboard with AI visualization, Drill through, drill down, Bookmark, navigation, Dynamic title
Checkpoint
Git Push
git push origin branchName