Design Data Model with Fact & Dimension Tables

Business Scenario
Welcome!
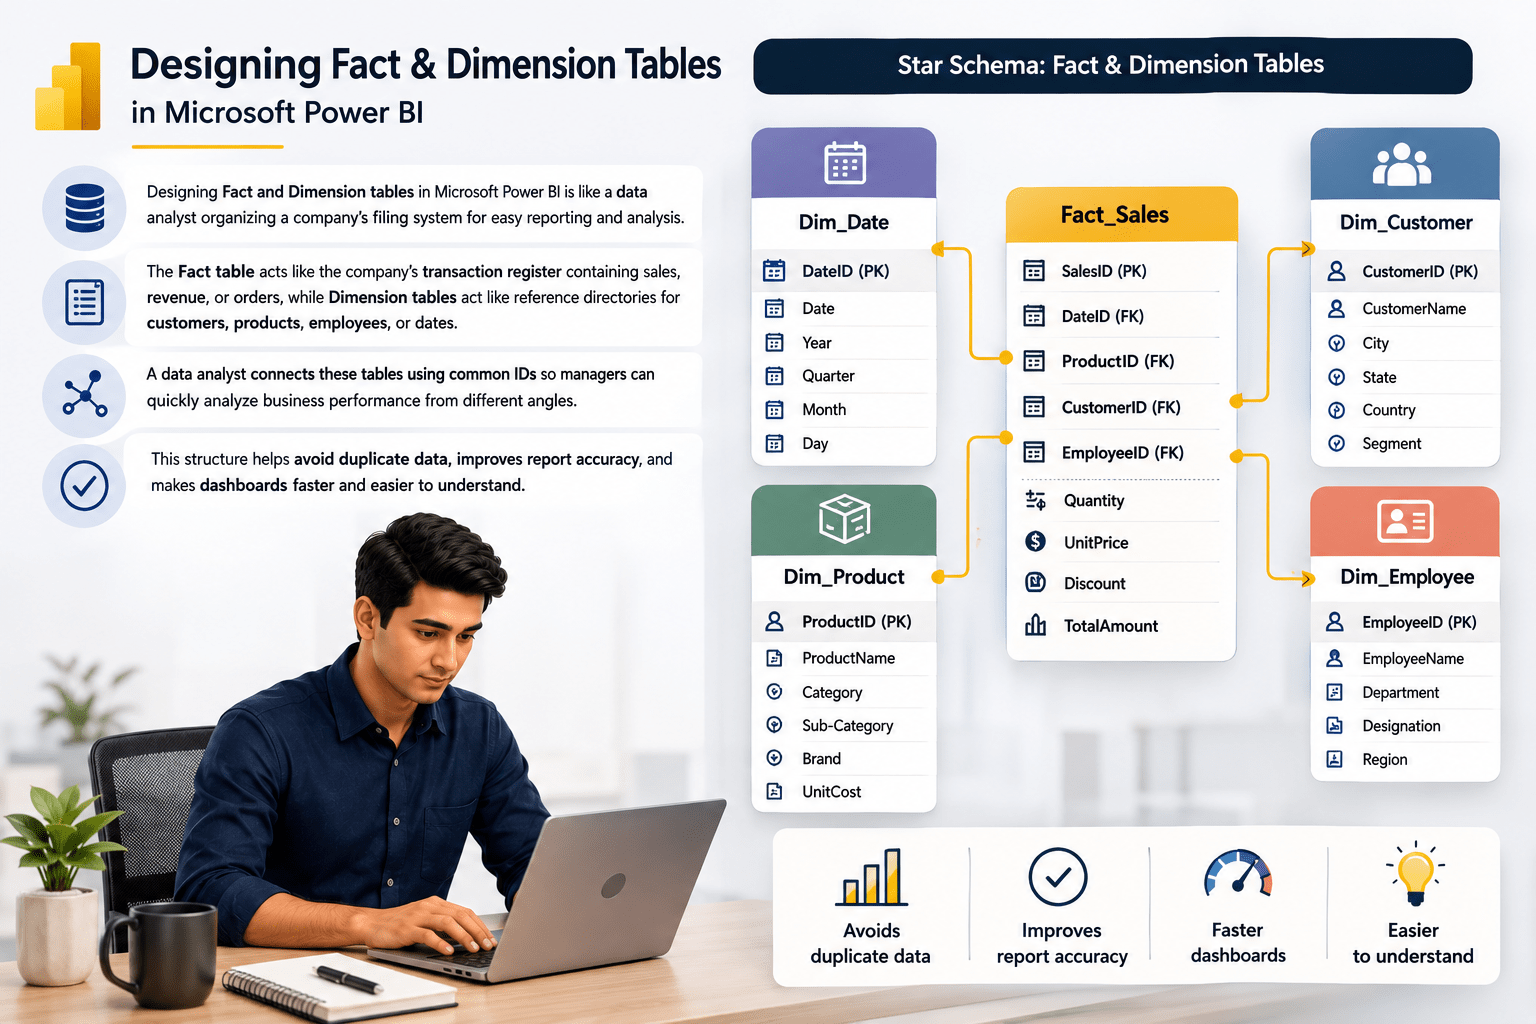
Designing Fact and Dimension tables in Microsoft Power BI is like a data analyst organizing a company’s filing system for easy reporting and analysis.
The Fact table acts like the company’s transaction register containing sales, revenue, or orders, while Dimension tables act like reference directories for customers, products, employees, or dates.

Pre-Lab Preparation
Topic : Modelling Data in Power BI
1) Data Modelling
2) Different types of Schemas (Star and Snowflake)
3) Manage Data Relationships
Task 1: Identify fact and dimension tables
1
Download the below dataset and import into Power BI desktop
Home Tab—> Get Data→Text/CSV option
git pull origin branchName
Git Pull
A data analyst connects these tables using common IDs so managers can quickly analyze business performance from different angles. This structure helps avoid duplicate data, improves report accuracy, and makes dashboards faster and easier to understand.
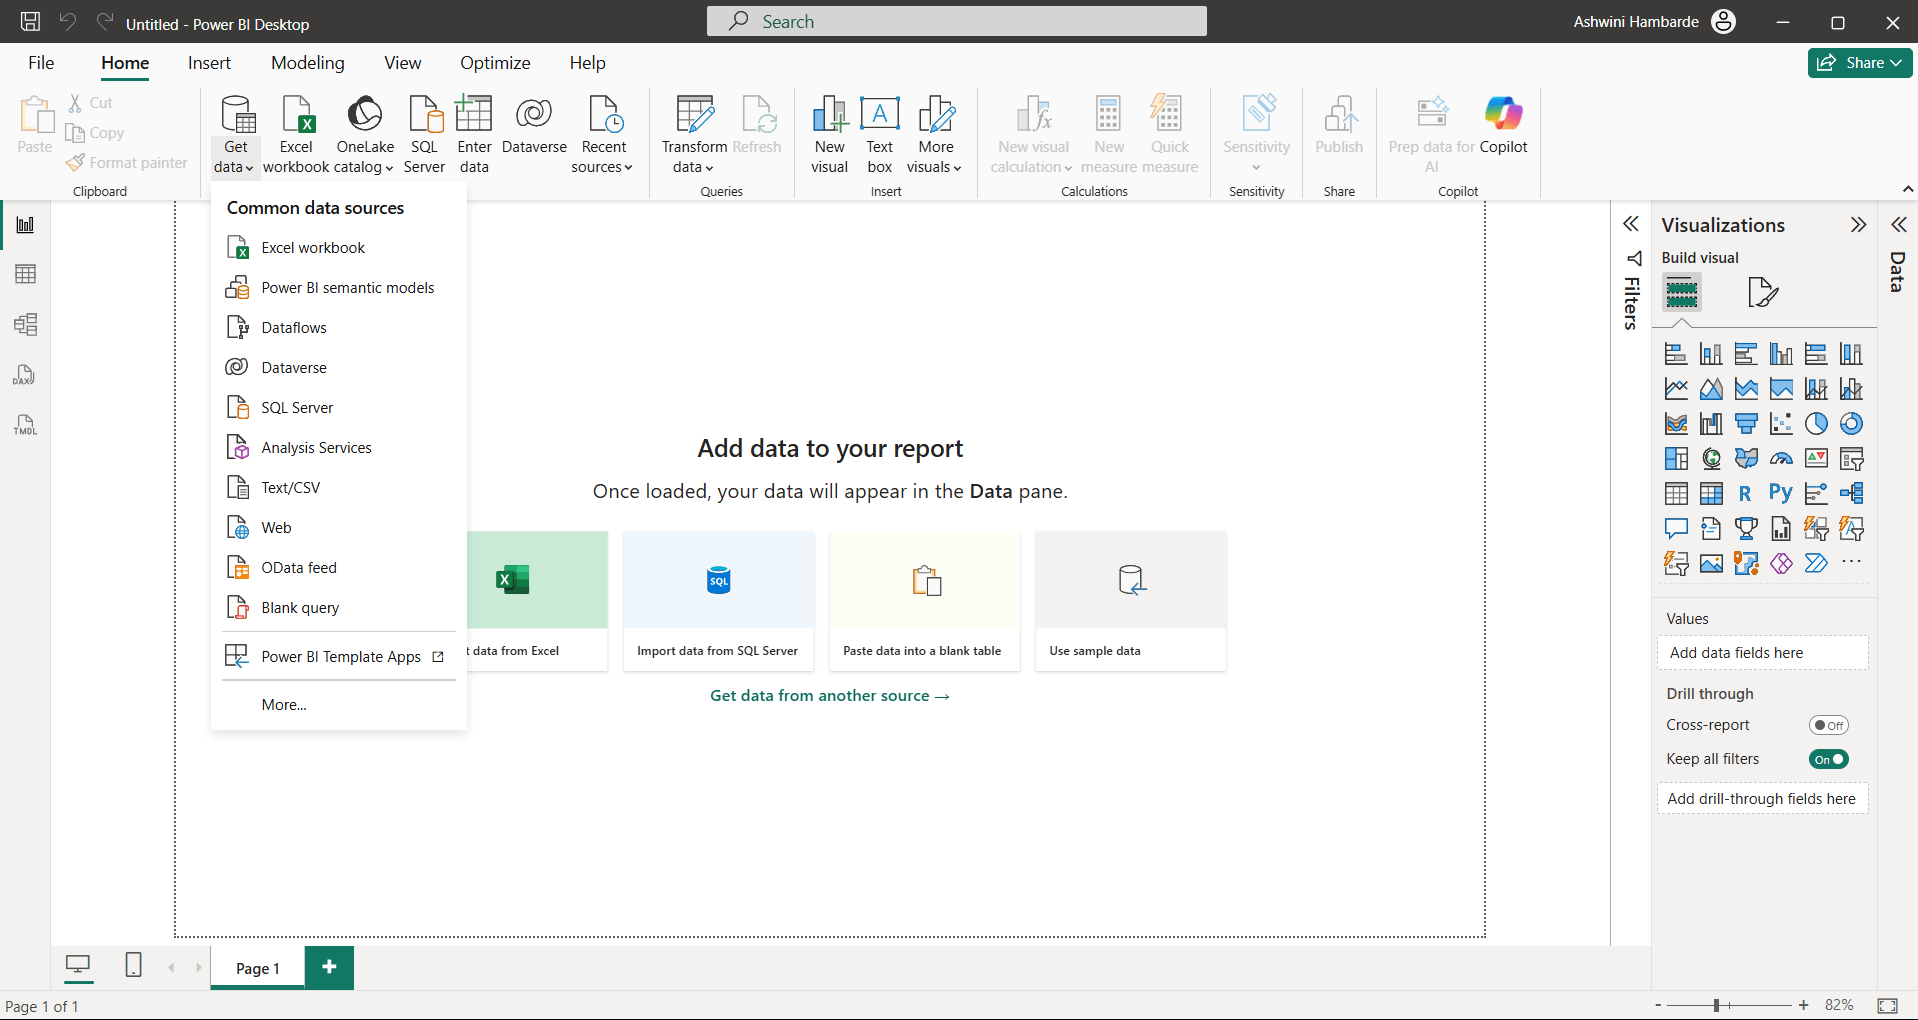
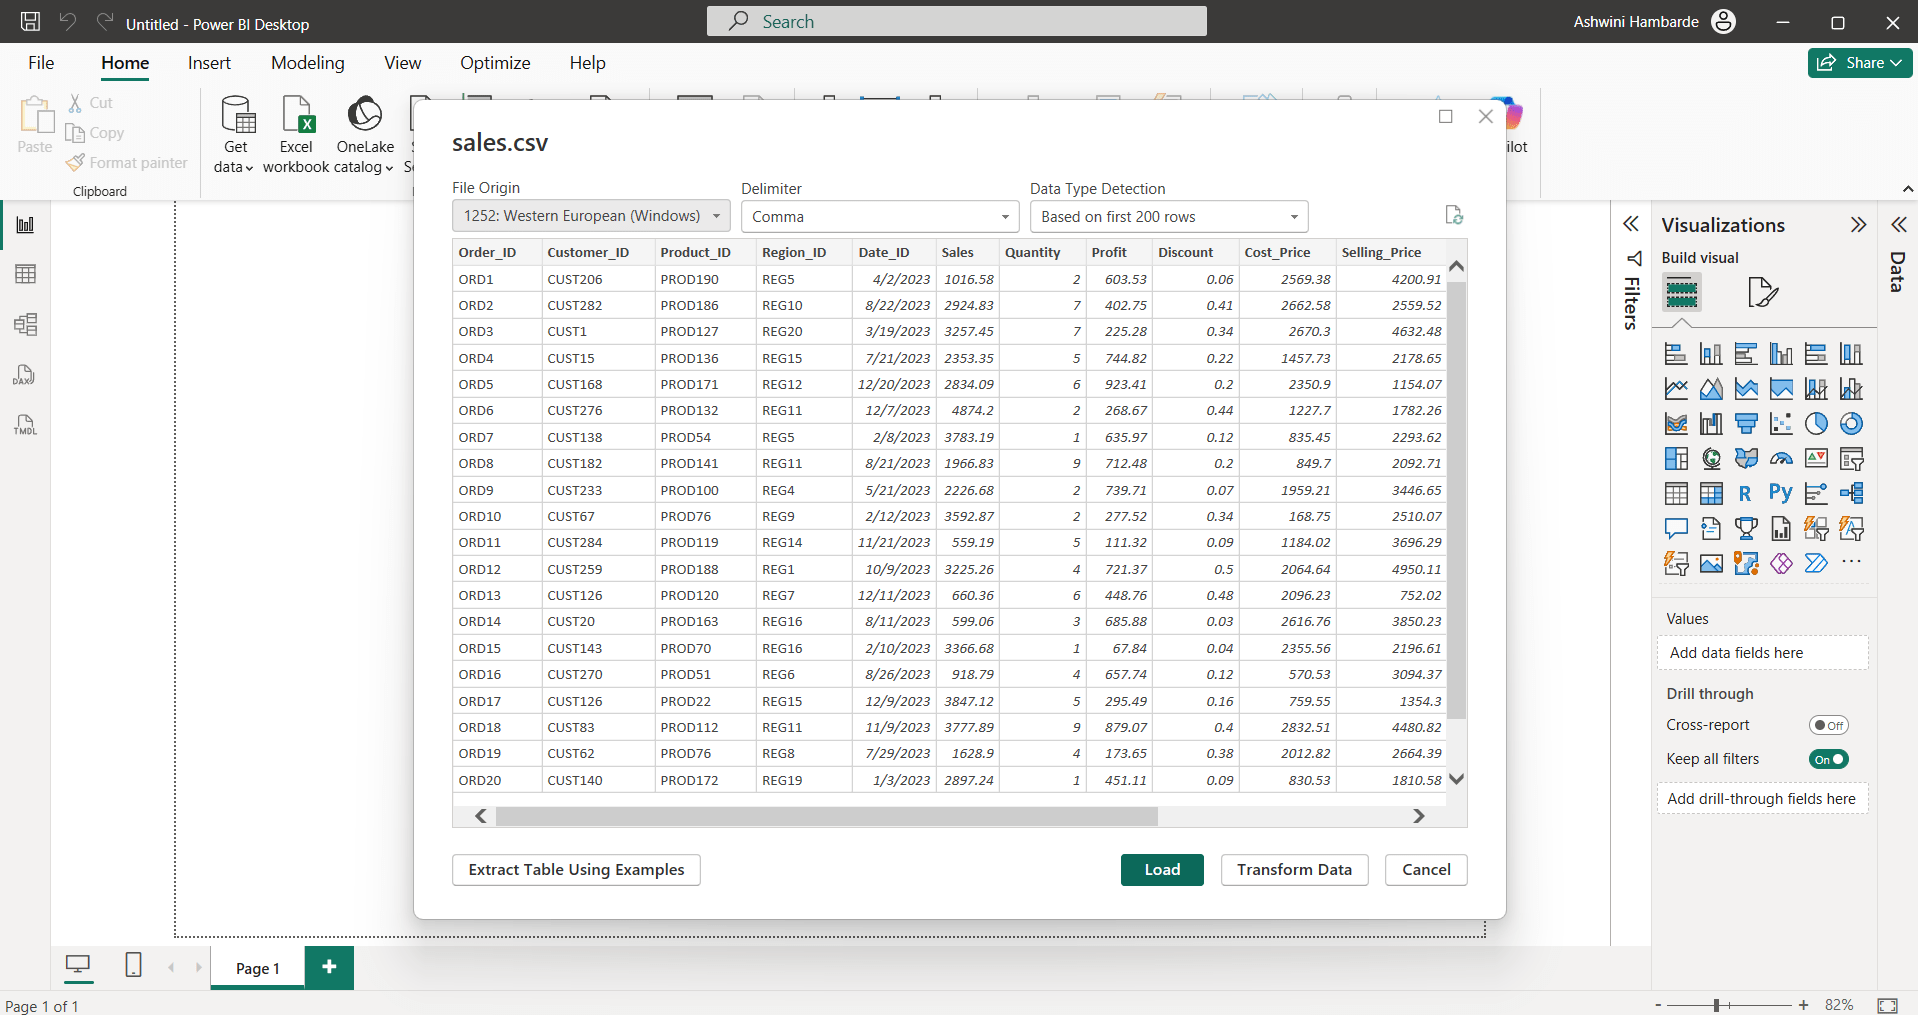
Click on the Load button. Using same way we can connect all above mentioned datasets
2
Check table view and identify columns and its type
Table Customer contains:
Customer_ID →Primary Key
Customer Name —>Qualitative data
Segment → Qualitative data
Customer Age group—> Qualitative data
Gender —> Qualitative data
Loyalty Status→ Qualitative data
Join Date → Qualitative data
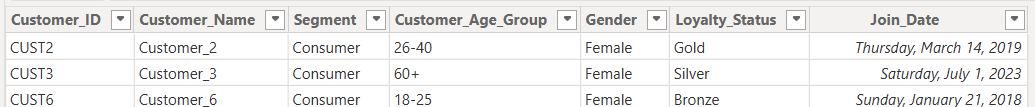
Table Date contains:
Date_ID →Primary Key
Year —>Qualitative data
Month → Qualitative data
Quarter—> Qualitative data
Day_name —> Qualitative data
Week_number→ Qualitative data
is_weekend → Qualitative data
Financial_year—>Qualitative data
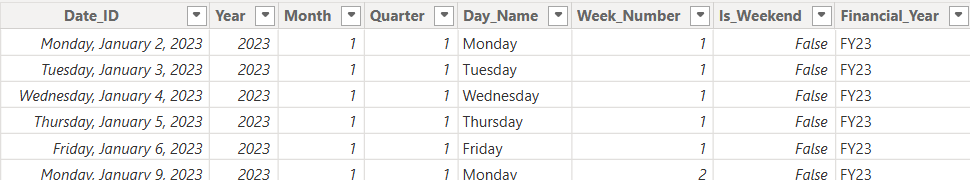
Table Product contains:
Product_ID →Primary Key
Category —>Qualitative data
Sub-Category → Qualitative data
Brand—> Qualitative data
Day_name —> Qualitative data
Product_Name→ Qualitative data
Unit_Price → Qualitative data
Launch_year—>Qualitative data
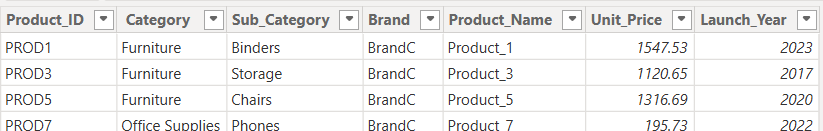
Table Region contains:
Region_ID →Primary Key
Region —>Qualitative data
City → Qualitative data
State—> Qualitative data
Country —> Qualitative data
Zone→ Qualitative data
Pin_Code → Qualitative data
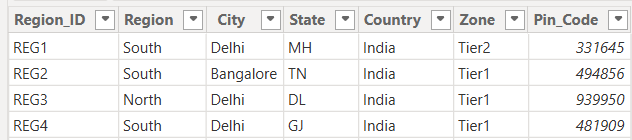
Table Sales contains:
Order_ID →Primary Key
Customer_ID—->Foreign key
Product_ID—>Foreign key
Region_ID—> Foreign key
Date_ID —> Foreign key
Sales→Quantitative data
Quantity →Quantitative data
Profit—> Quantitative data
Discount—> Quantitative data
Cost_price—>Quantitative data
Selling_price—>Quantitative data
Shipping_cost–>Quantitative data
Order_priority —> Qualitative data
Delivery_Days—> Quantitative data

Depending on type and key the table is holding, we can identify
- Sales is only a Fact table
- Where as Region, Product, Date, Customers are Dimension tables
Task 2: Understand Star schema and Snowflake schema
1
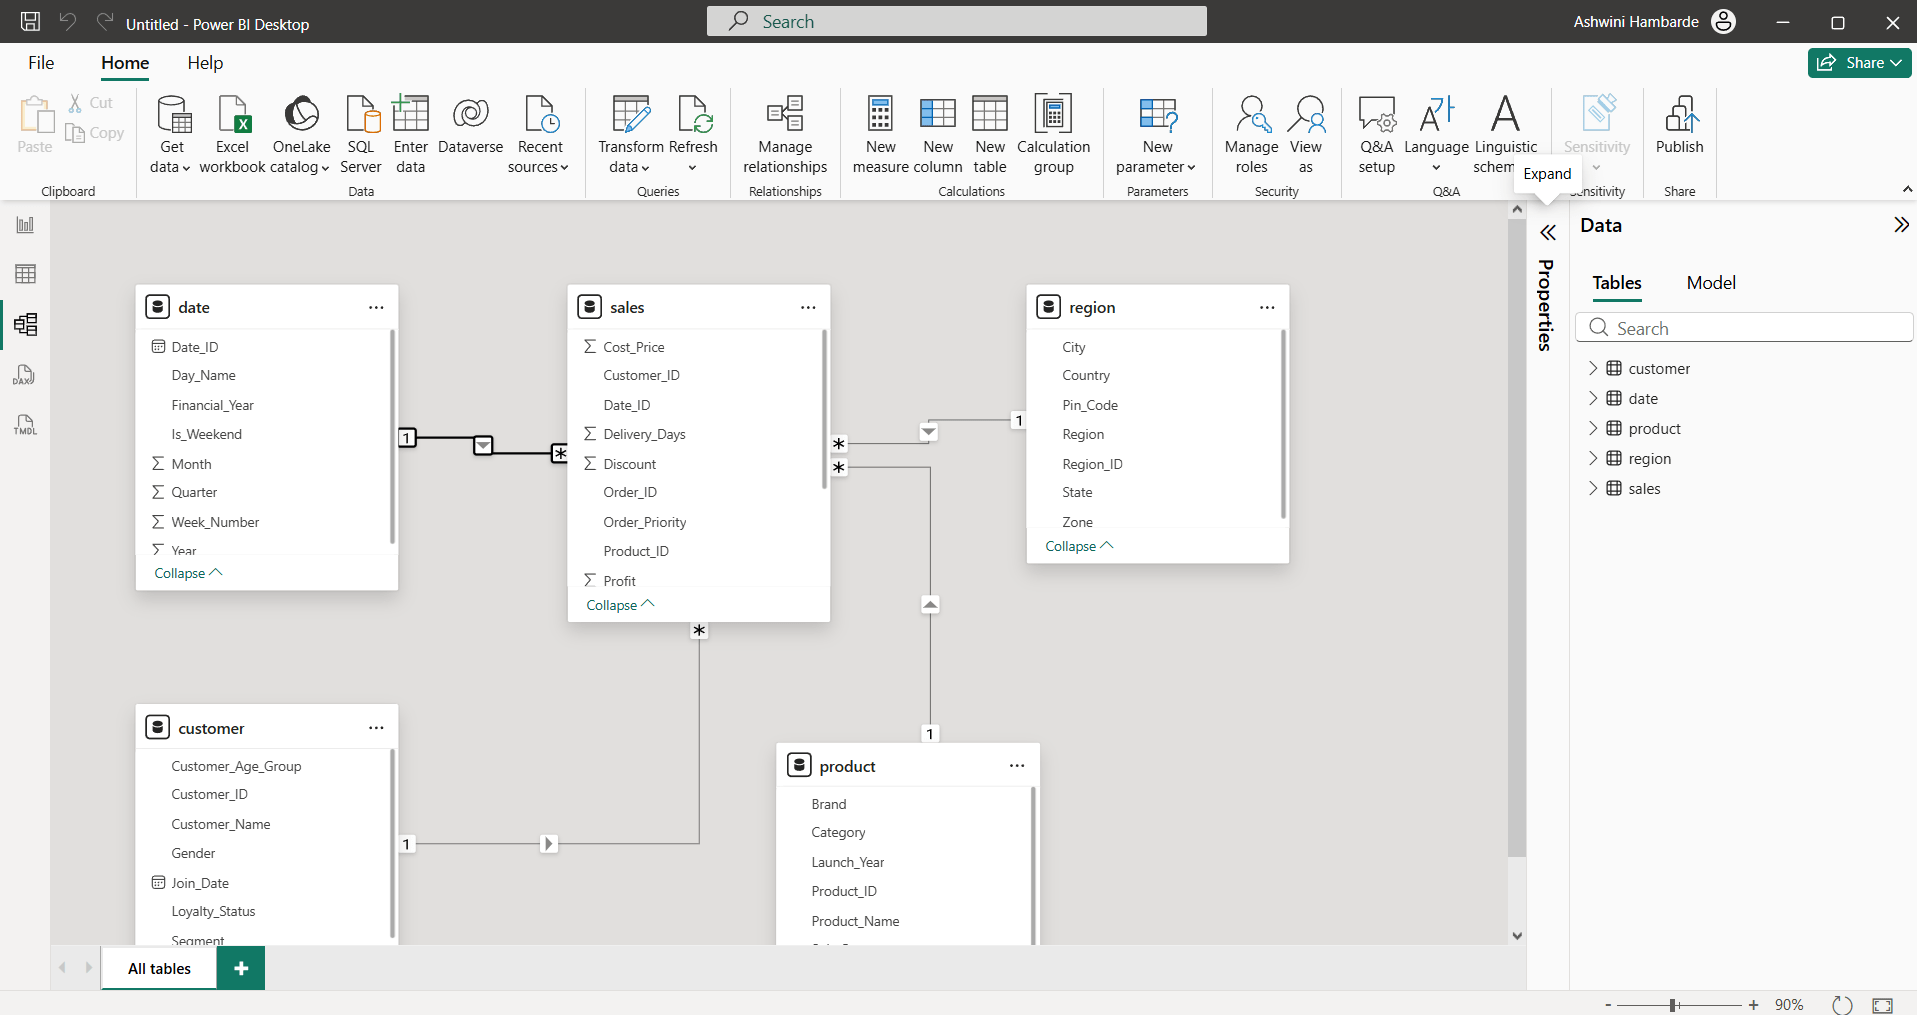
Go to Model view
2
Identifying Fact and Dimension Tables
- Check which table is Fact table having all many relationship i.e. Sales table
- Check other tables connected with one relationship which are surrounded by sales table are Dimension tables ie. Customer, Region, Date, Product tables
- If Dimension tables are further split or connected to other dimension tables then it is snowflake schema or normalized tables
- If Fact table connected to dimension table who are not further split to other dimension table then it is Star schema
3
Identifying Star and Snowflake Schemas
So, As per above methodology, our structure is STAR schema
Great job!
You have successfully completed the Data modeling lab
Checkpoint
Next-Lab Preparation
Git Push
git push origin branchNameTopic : Build Relationships for Analytical Modelling
1) Create relationships between tables
2) Define cardinality
3) Configure cross-filter direction
4) Manage relationships in model view