Time Series Analysis
Quest for Stationarity: Analyzing Stationarity in Time Series

Learning Outcome
5
Apply techniques to convert non-stationary data → stationary
4
Use statistical tests (ADF & KPSS)
3
Understand types of stationarity
2
Identify visual signals of non-stationary data
1
Understand what stationarity means in time series.
Recall
Before this topic we learned:
- Time Series data
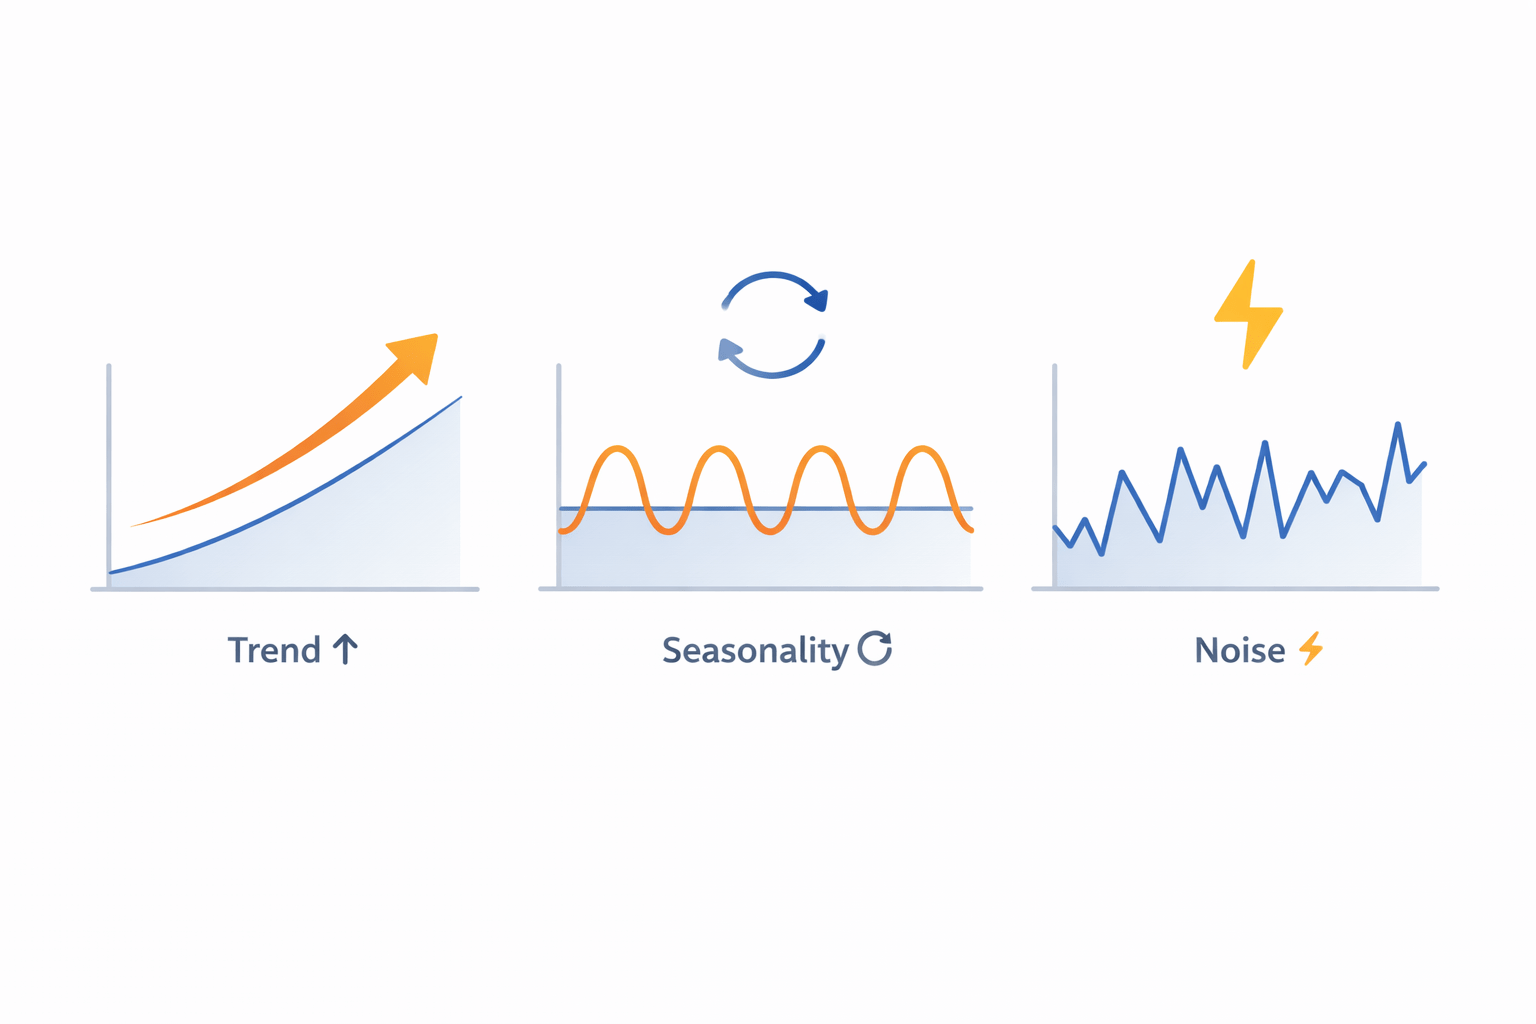
- Trend
- Seasonality
- Forecasting models
- ARIMA basics
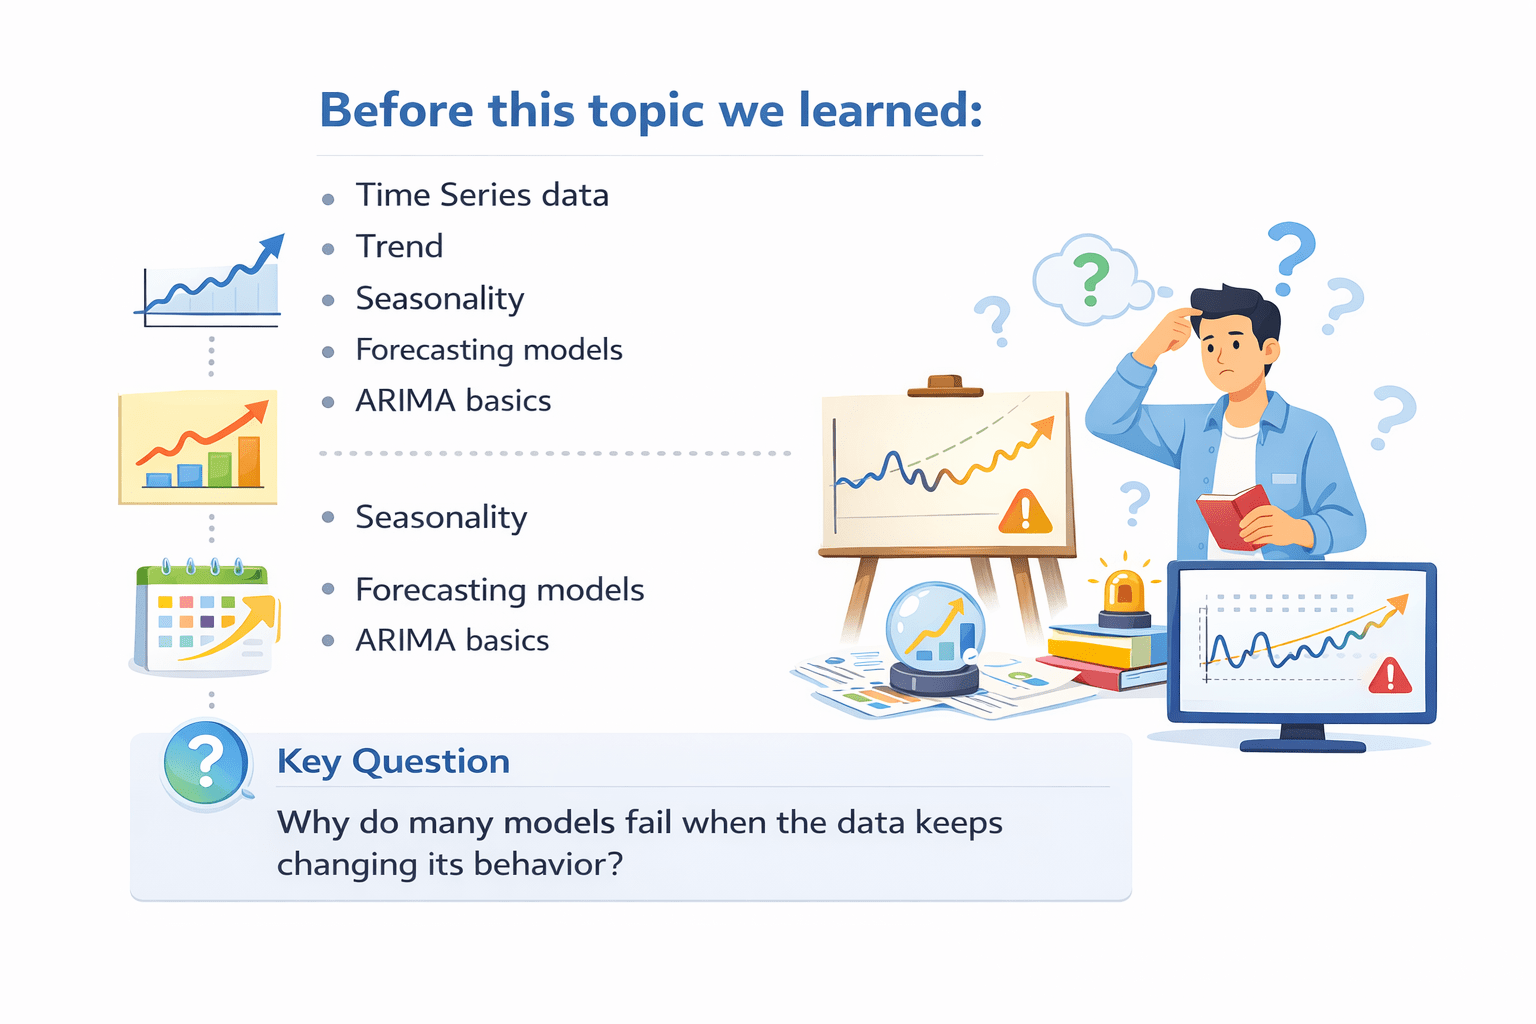
Why do many models fail when the data keeps changing its behavior?

Hook Story
The Stock Market Problem
- Yesterday average price = ₹100

- Next year average price = ₹300

This is the core problem of non-stationary data.
The data behavior keeps changing.


Transition to Concept

Why Models Need Stable Data
Machine learning models assume: Future behaves similar to past
But if:
- Mean changes
- Variance changes
- Patterns change
→ Model fails

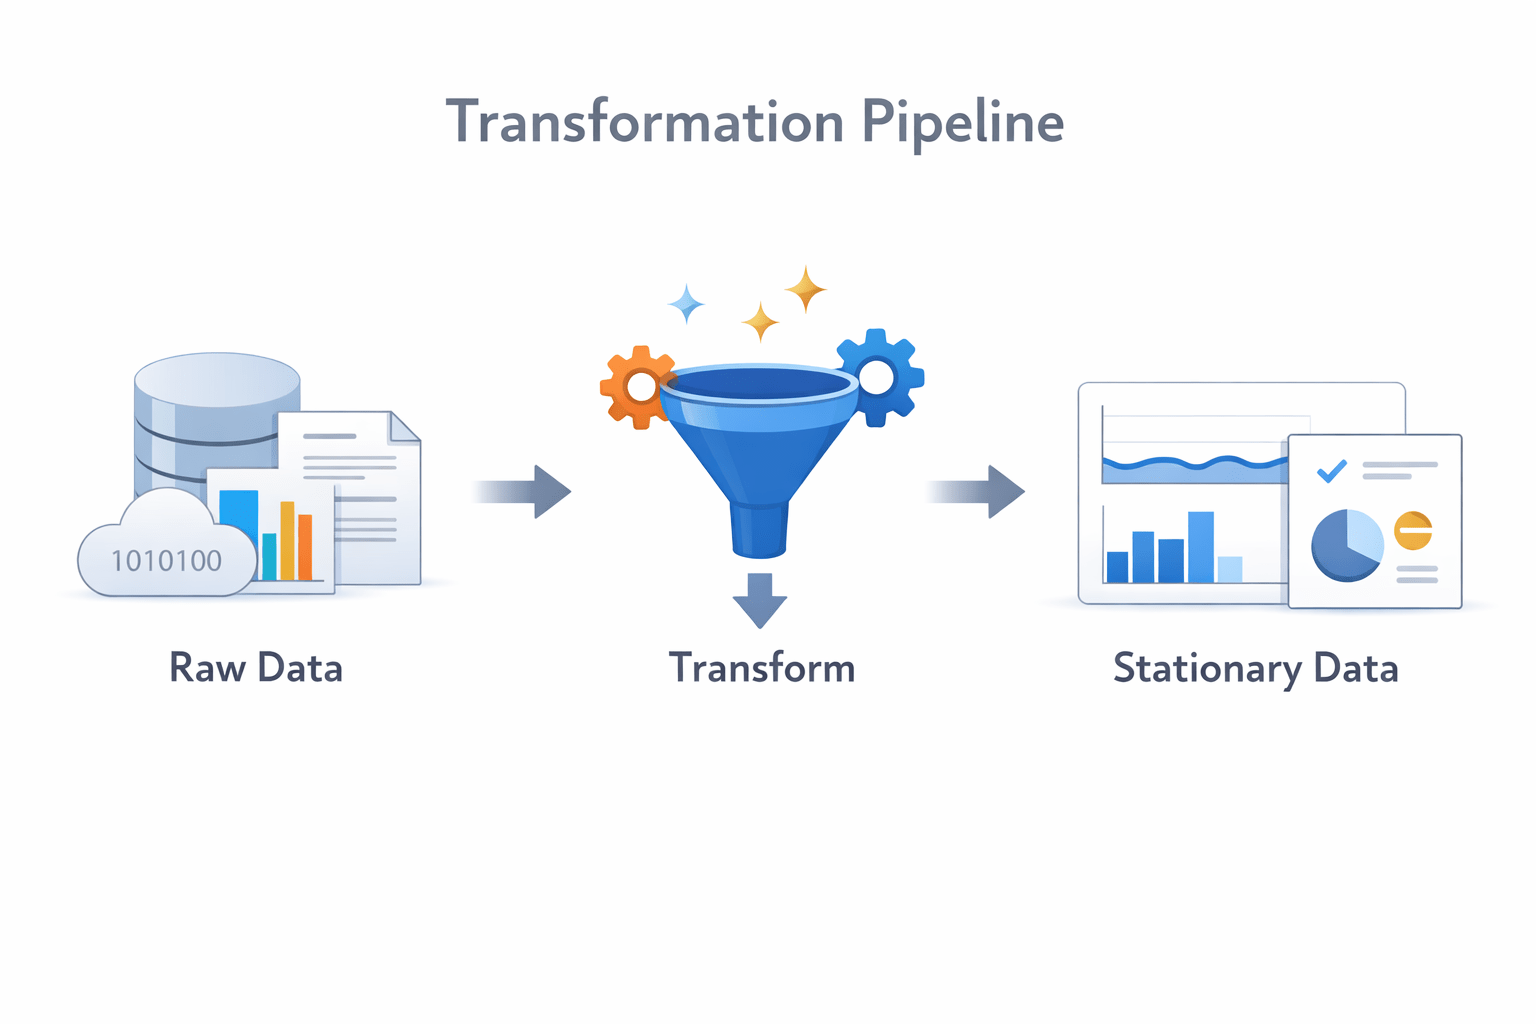
Solution: Make the data stationary

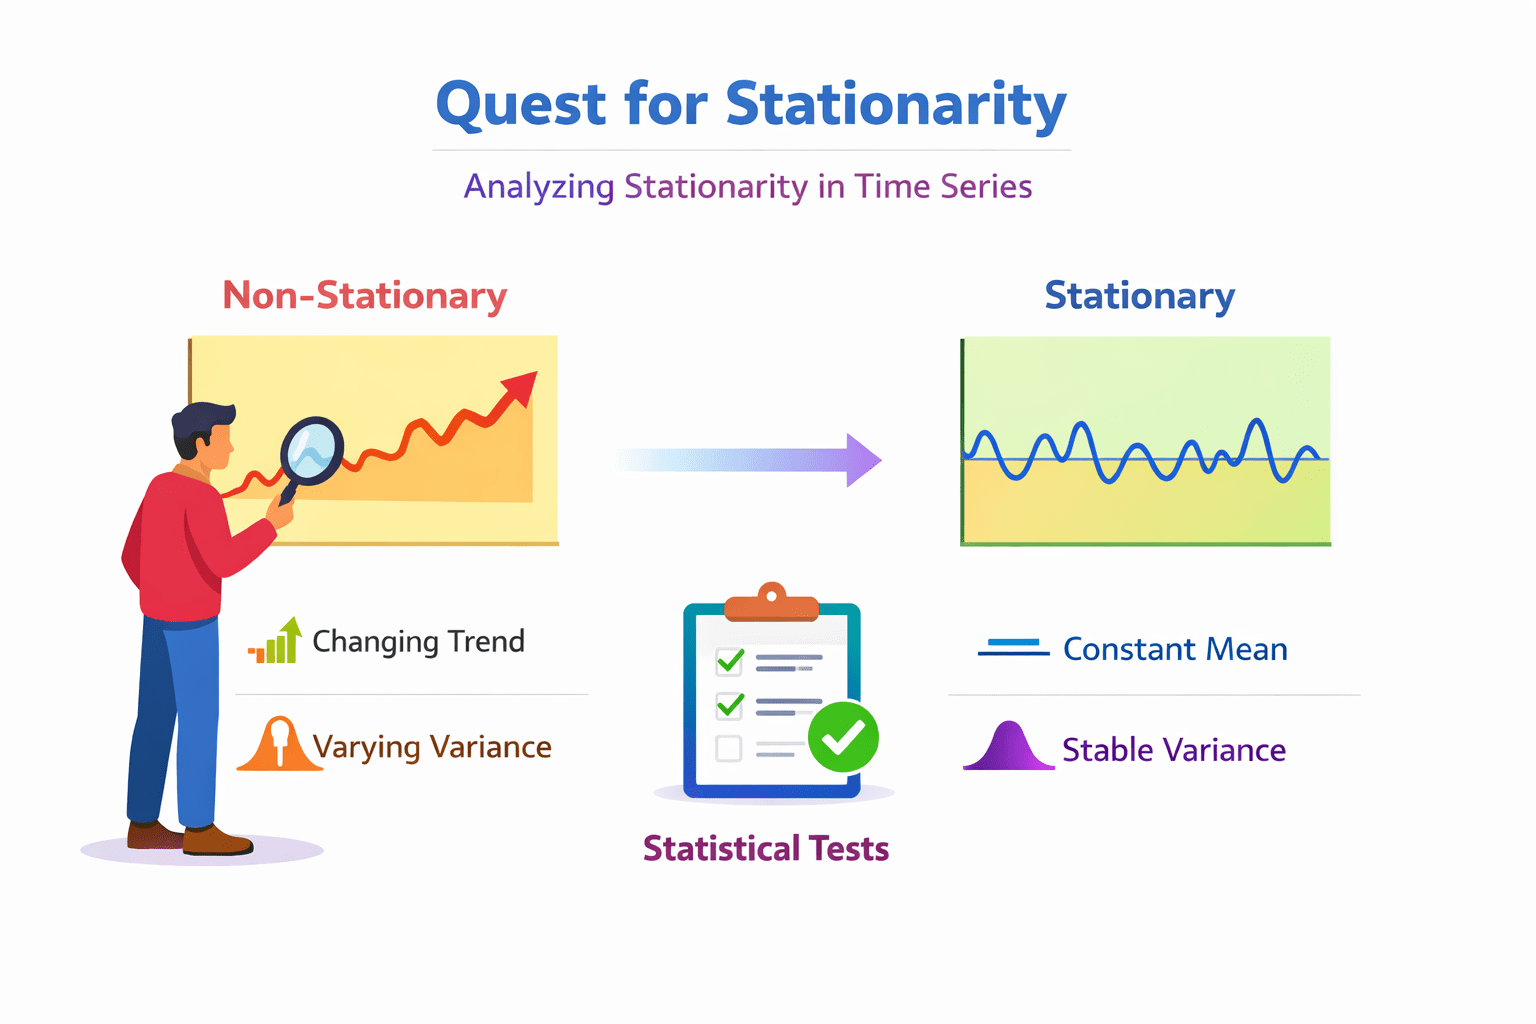
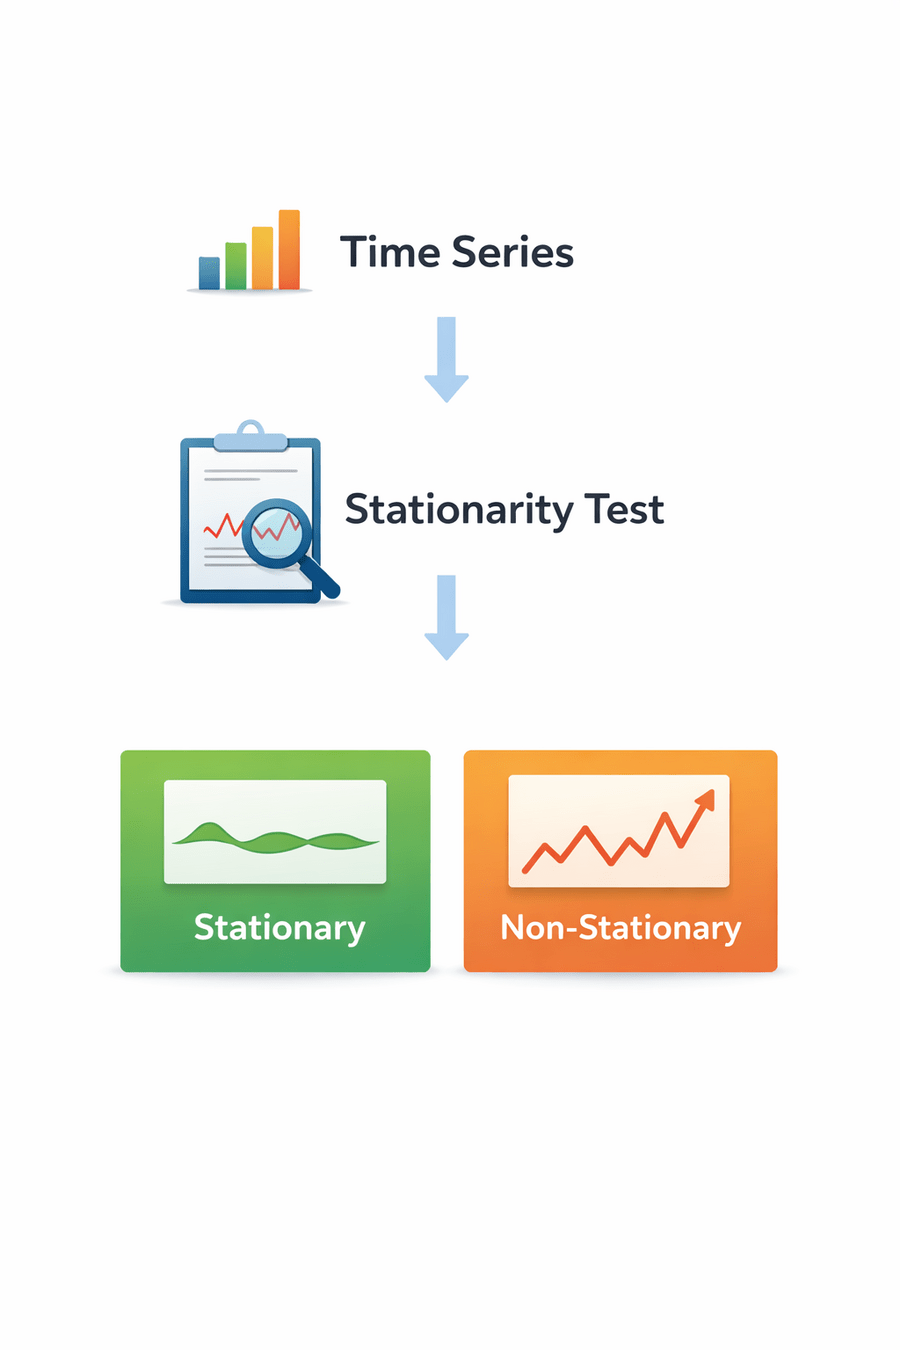
What is Stationarity?
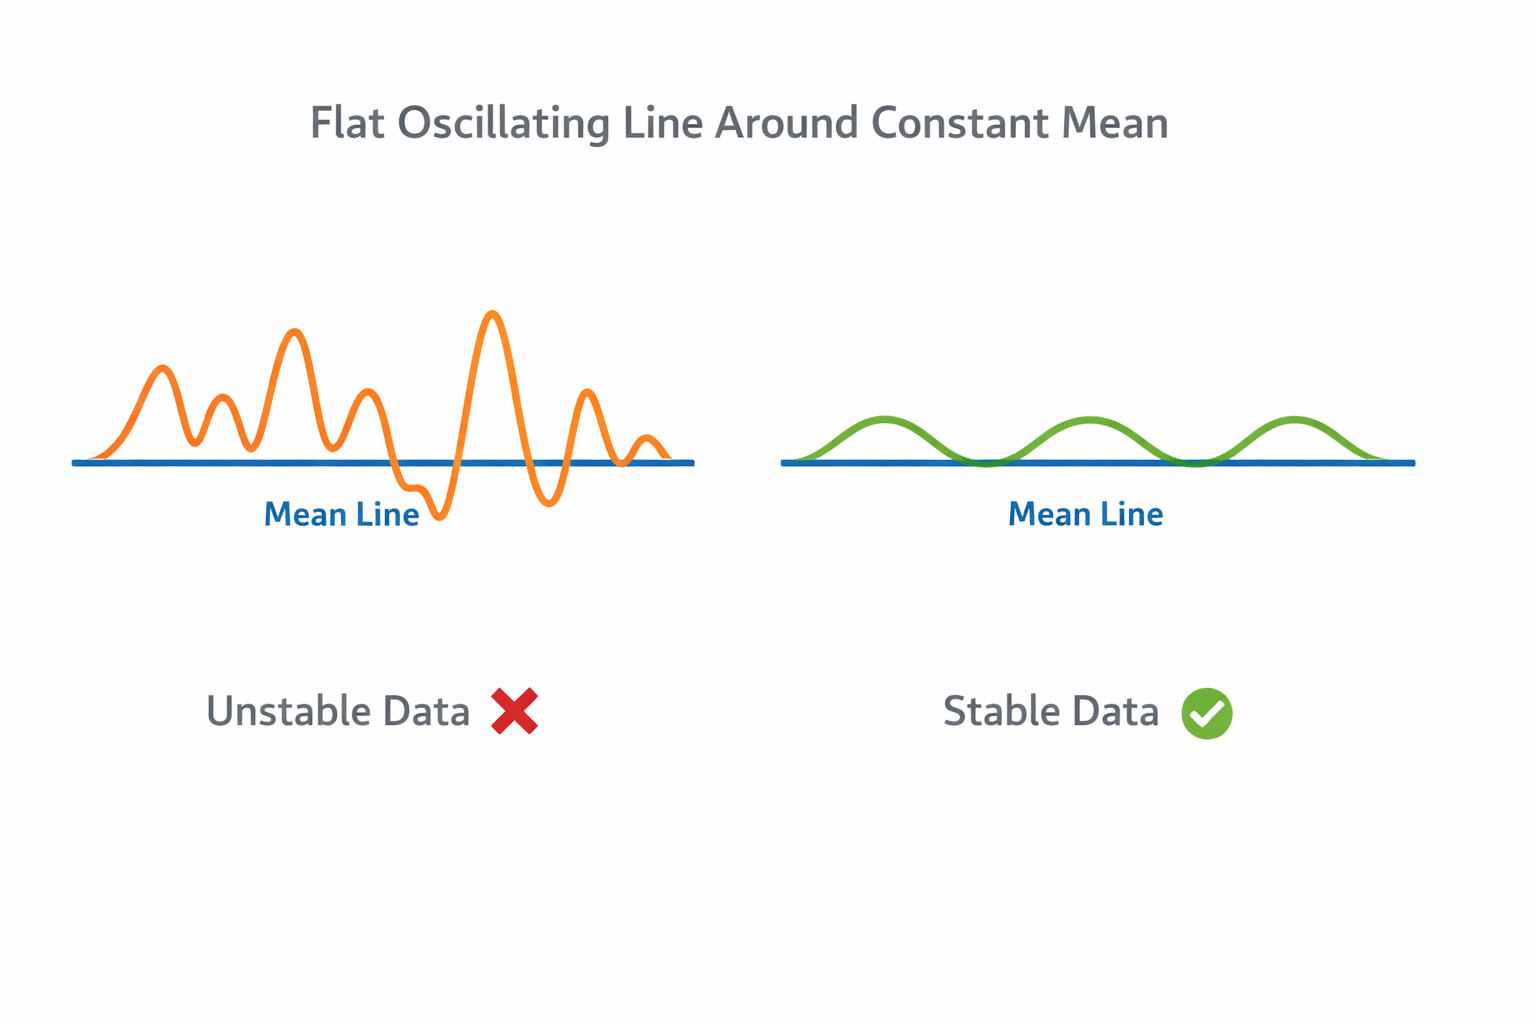
A time series is stationary when its statistical properties do not change over time.
Mean
Mean
📊
Variance
Variance
📉
Autocorrelation
Autocorrelation
🔁
Models like ARIMA require stationarity
Stable properties include:
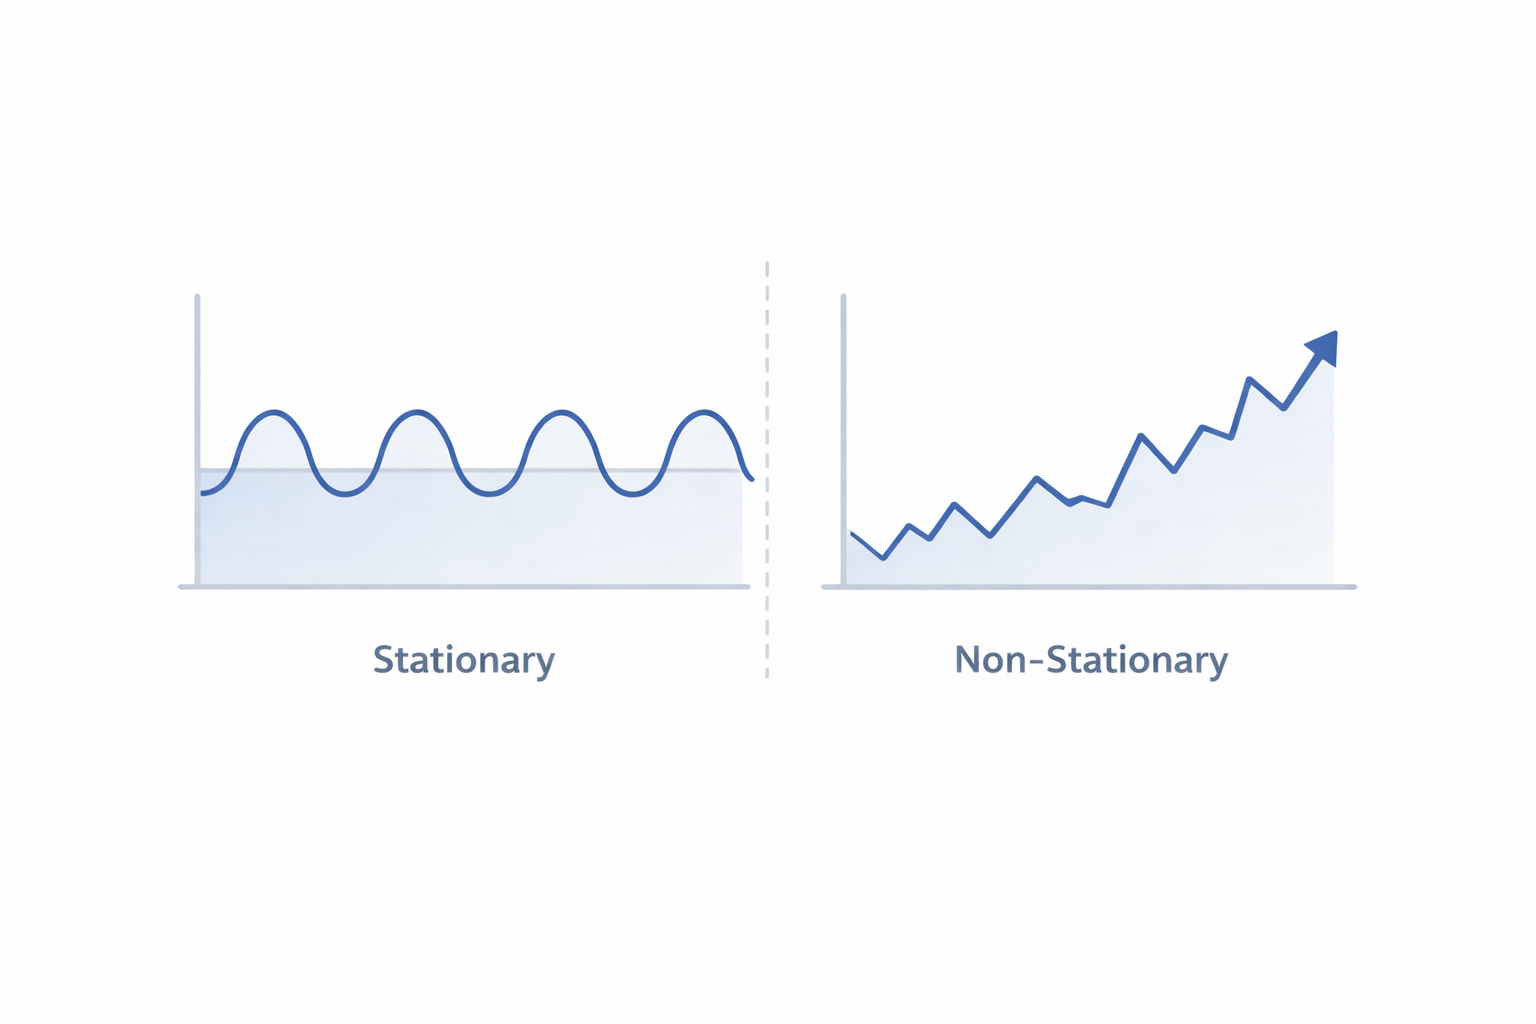
Stationary vs Non-Stationary
Key Difference:
Stationary Data
- Constant mean
- Constant variance
- No trend
Non-Stationary Data
- Changing mean
- Trend or seasonality
- Changing variance
Types of Stationarity
Two Types of Stationarity
Strict Stationarity:
- Entire distribution constant
Weak (Covariance) Stationarity:
- Mean constant
- Variance constant
- Covariance constant
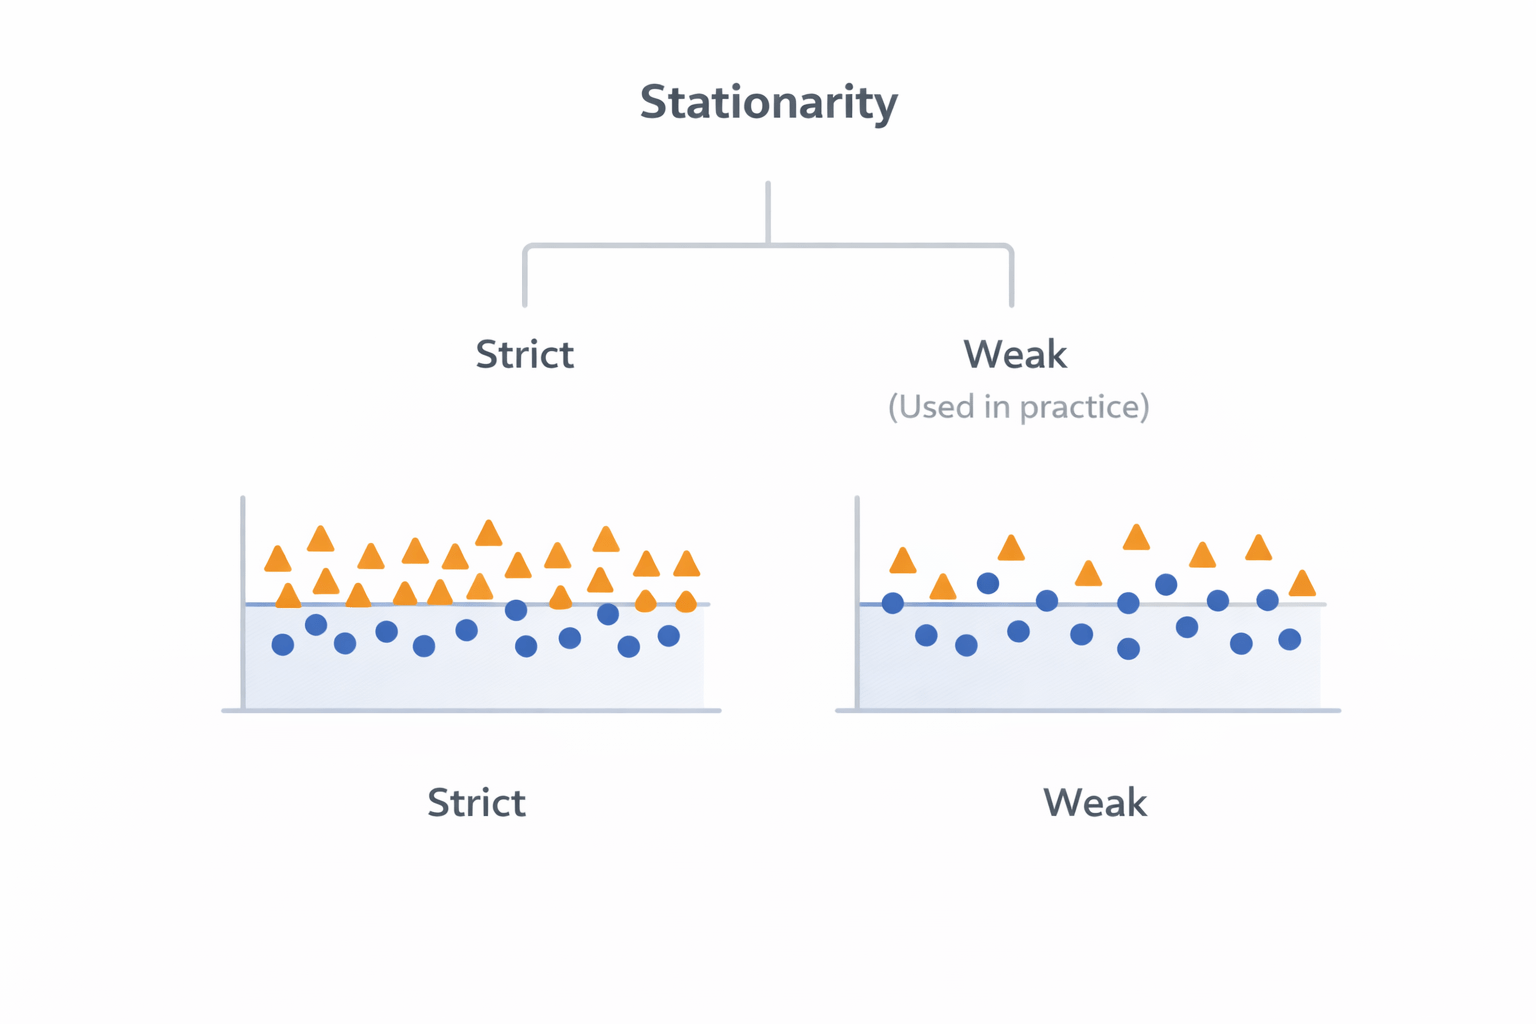
Most models assume weak stationarity in time series data.
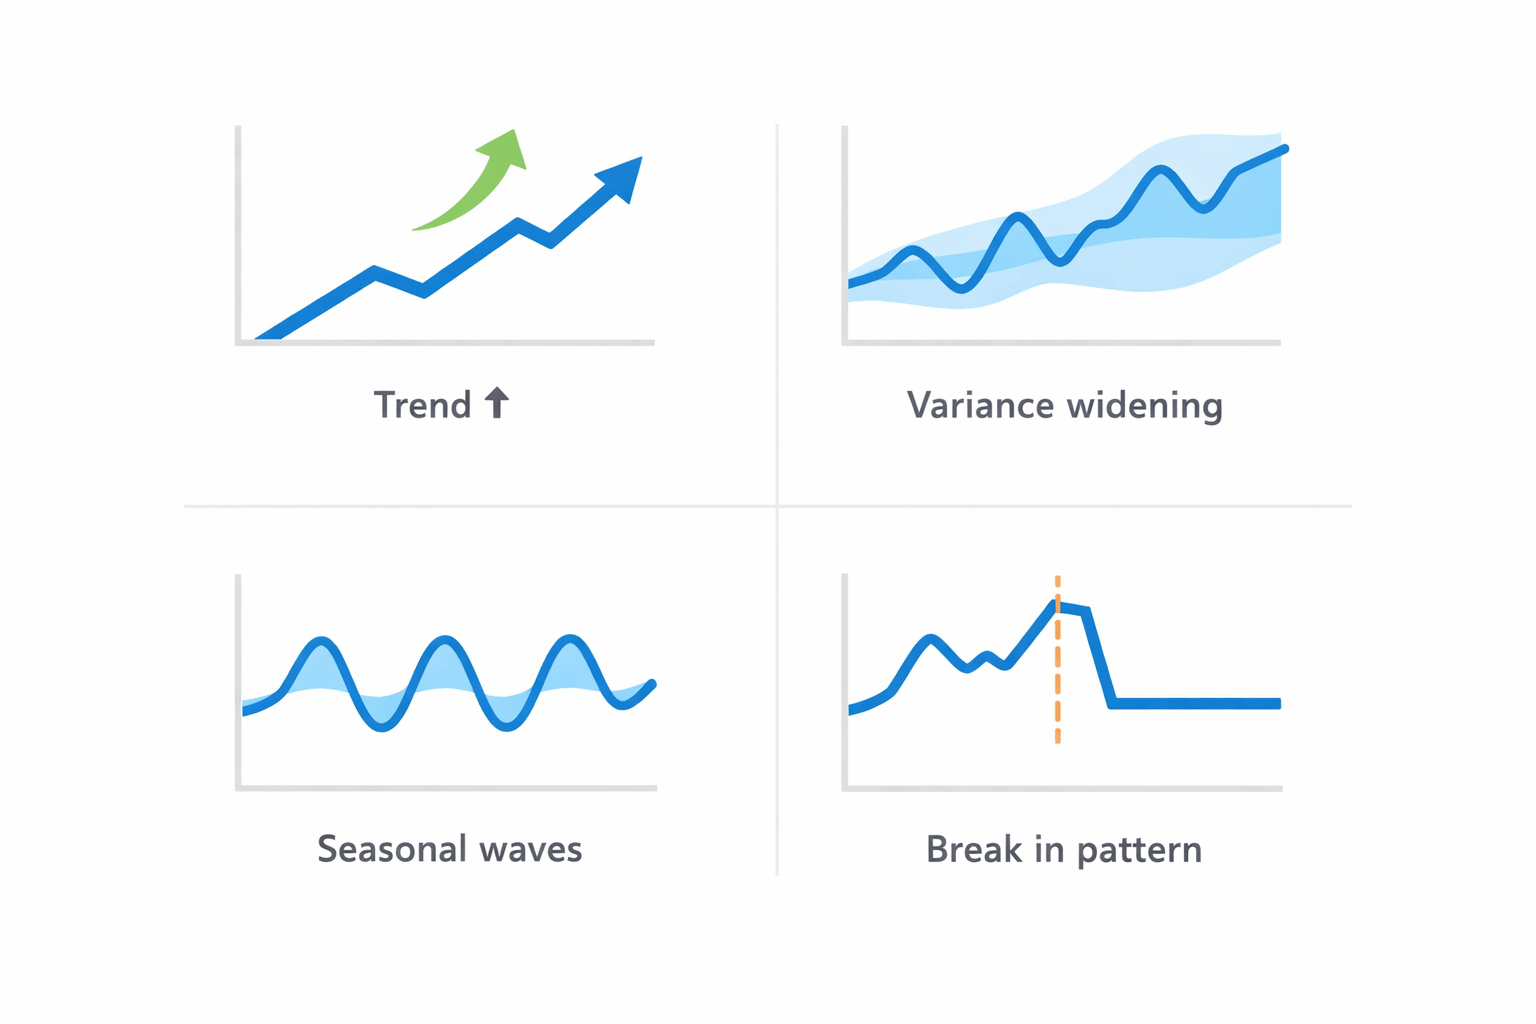
Visual Indicators
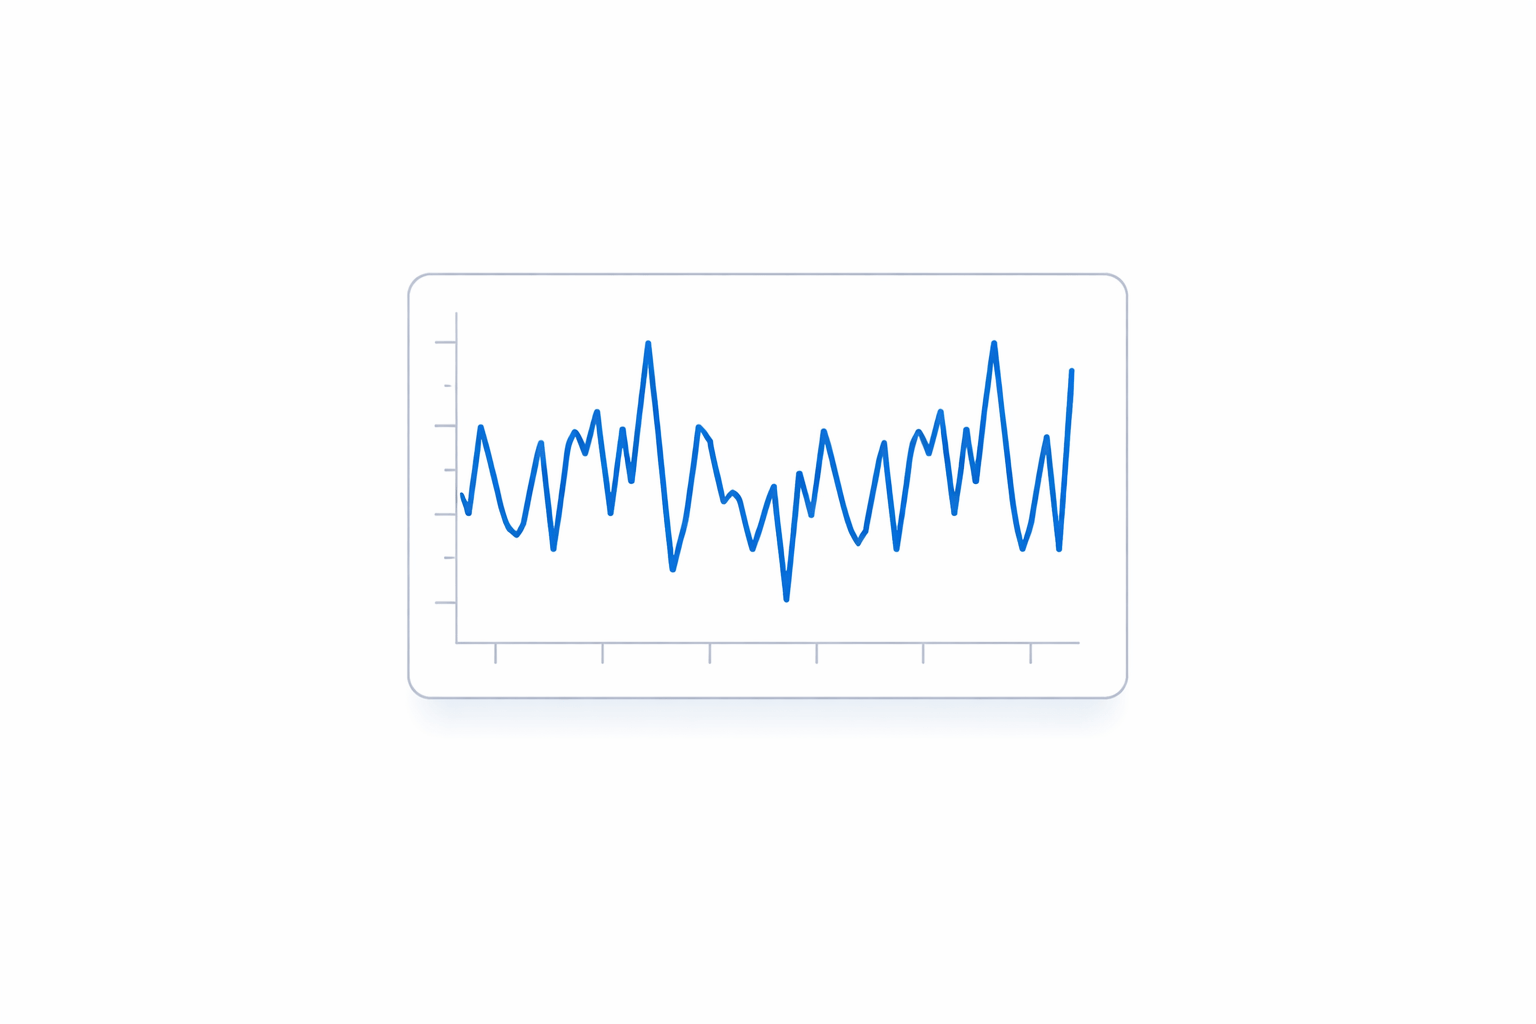
How to Visually Detect Non-Stationarity ?
Look for:
- Trend
- Changing spread
- Seasonal patterns
- Structural breaks
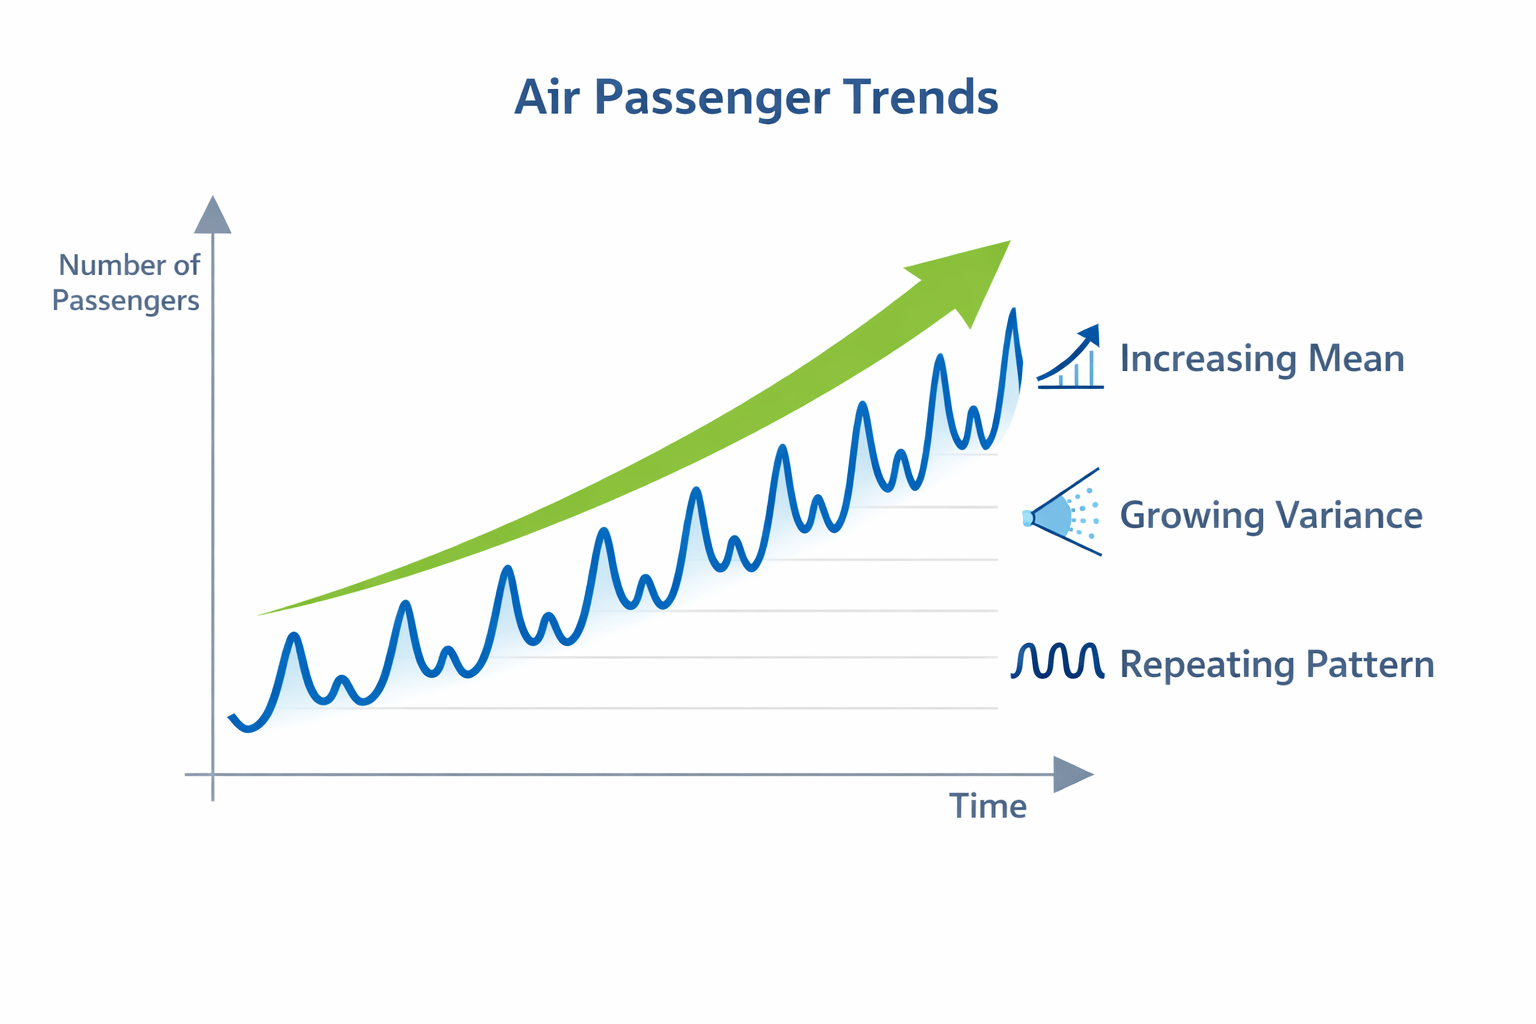
Example Plot:
Original Time Series Plot
Formal Tests for Stationarity:
Two popular tests:
- ADF Test
- KPSS Test
These tests check whether data is stationary using hypothesis testing.

Augmented Dickey Fuller Test
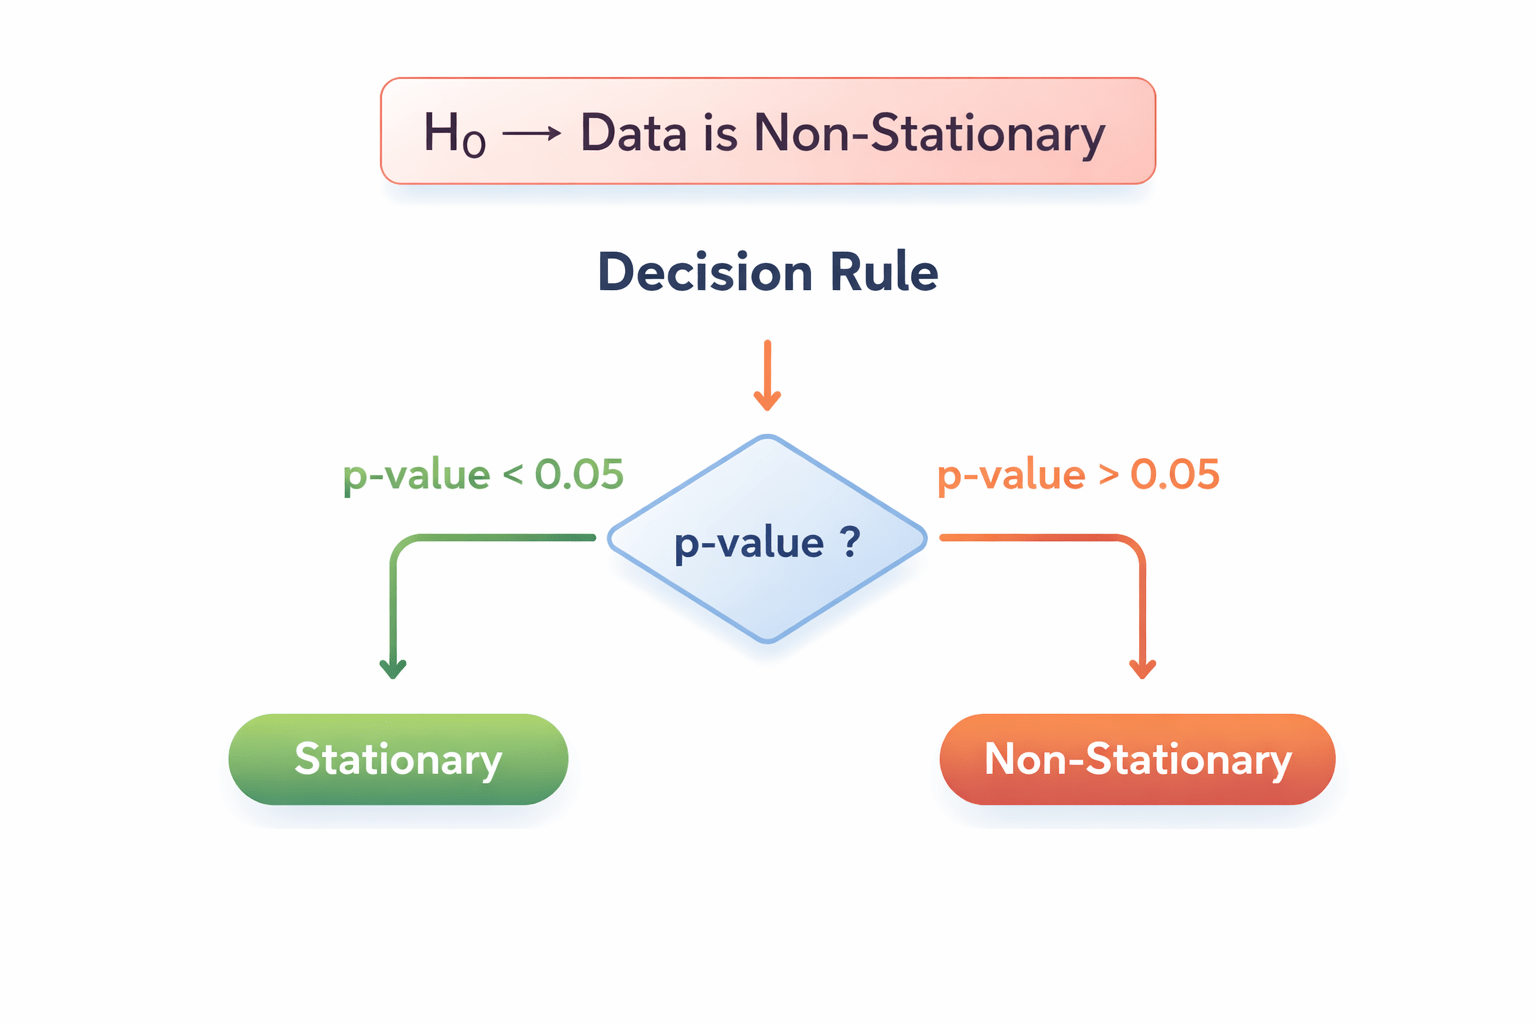
ADF Test
H₀ → Data is Non-Stationary
Decision Rule:
p-value < 0.05 → Stationary
p-value > 0.05 → Non-Stationary
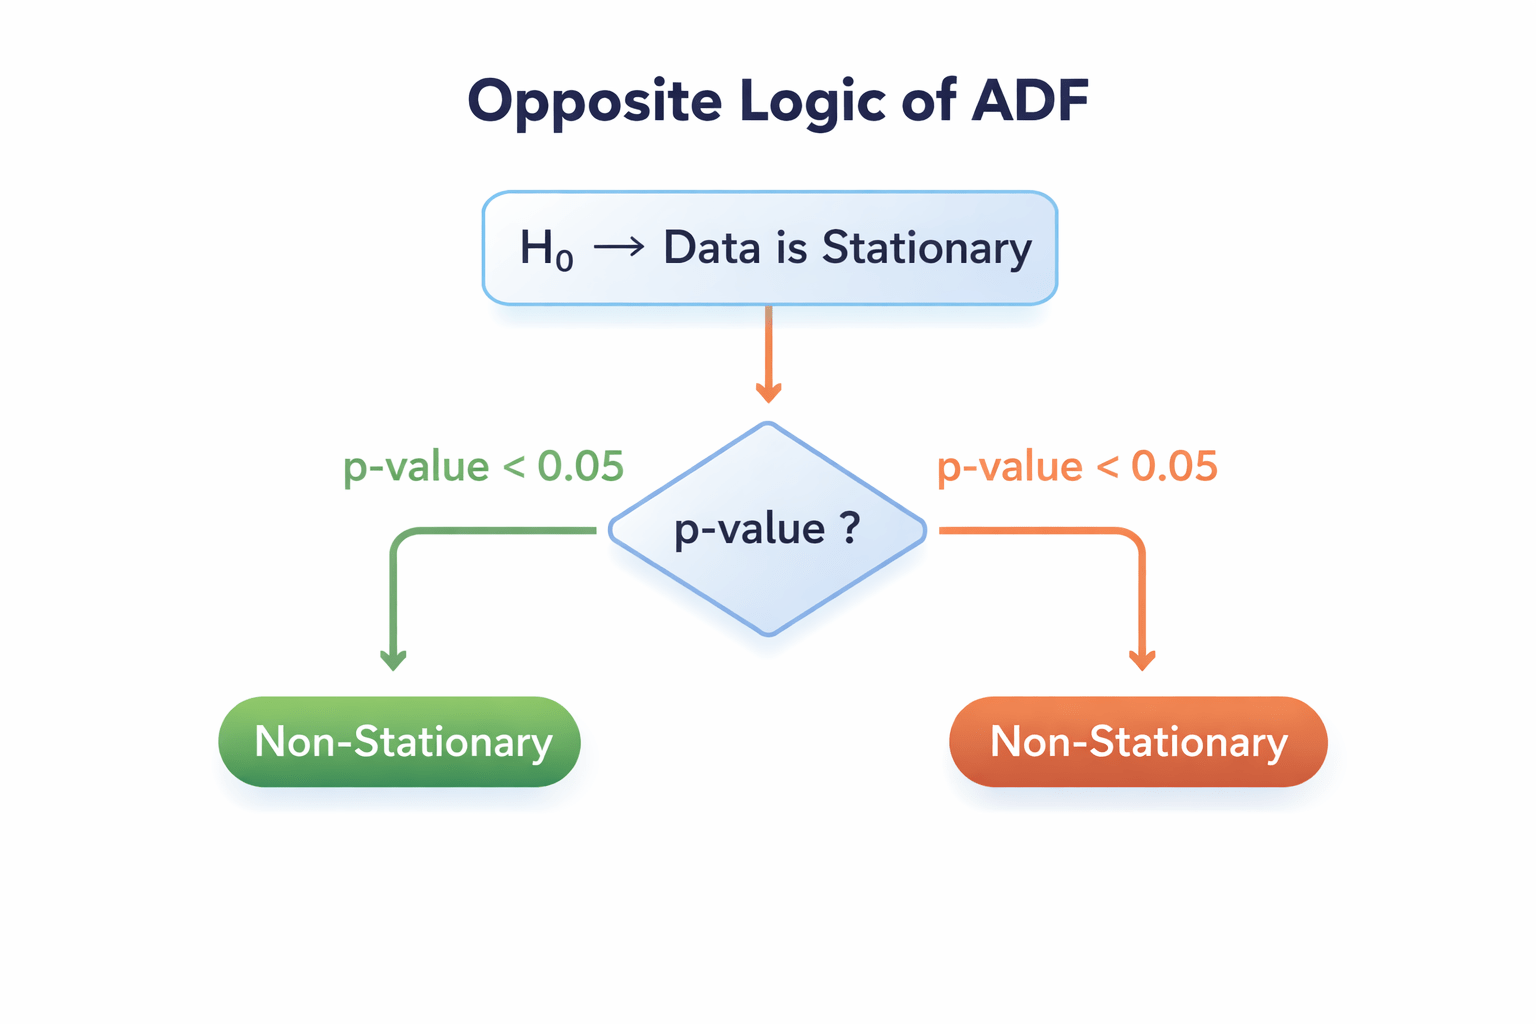
KPSS Test (Opposite logic of ADF)
H₀ → Data is stationary
Decision Rule:
p-value < 0.05 → Non-Stationary
p-value > 0.05 → Stationary
KPSS Test
Python Example
ADF Test in Python
from statsmodels.tsa.stattools import adfuller

result = adfuller(series)

print(result[1])   # p-value
p-value < 0.05 → Stationary
Techniques to Achieve Stationarity
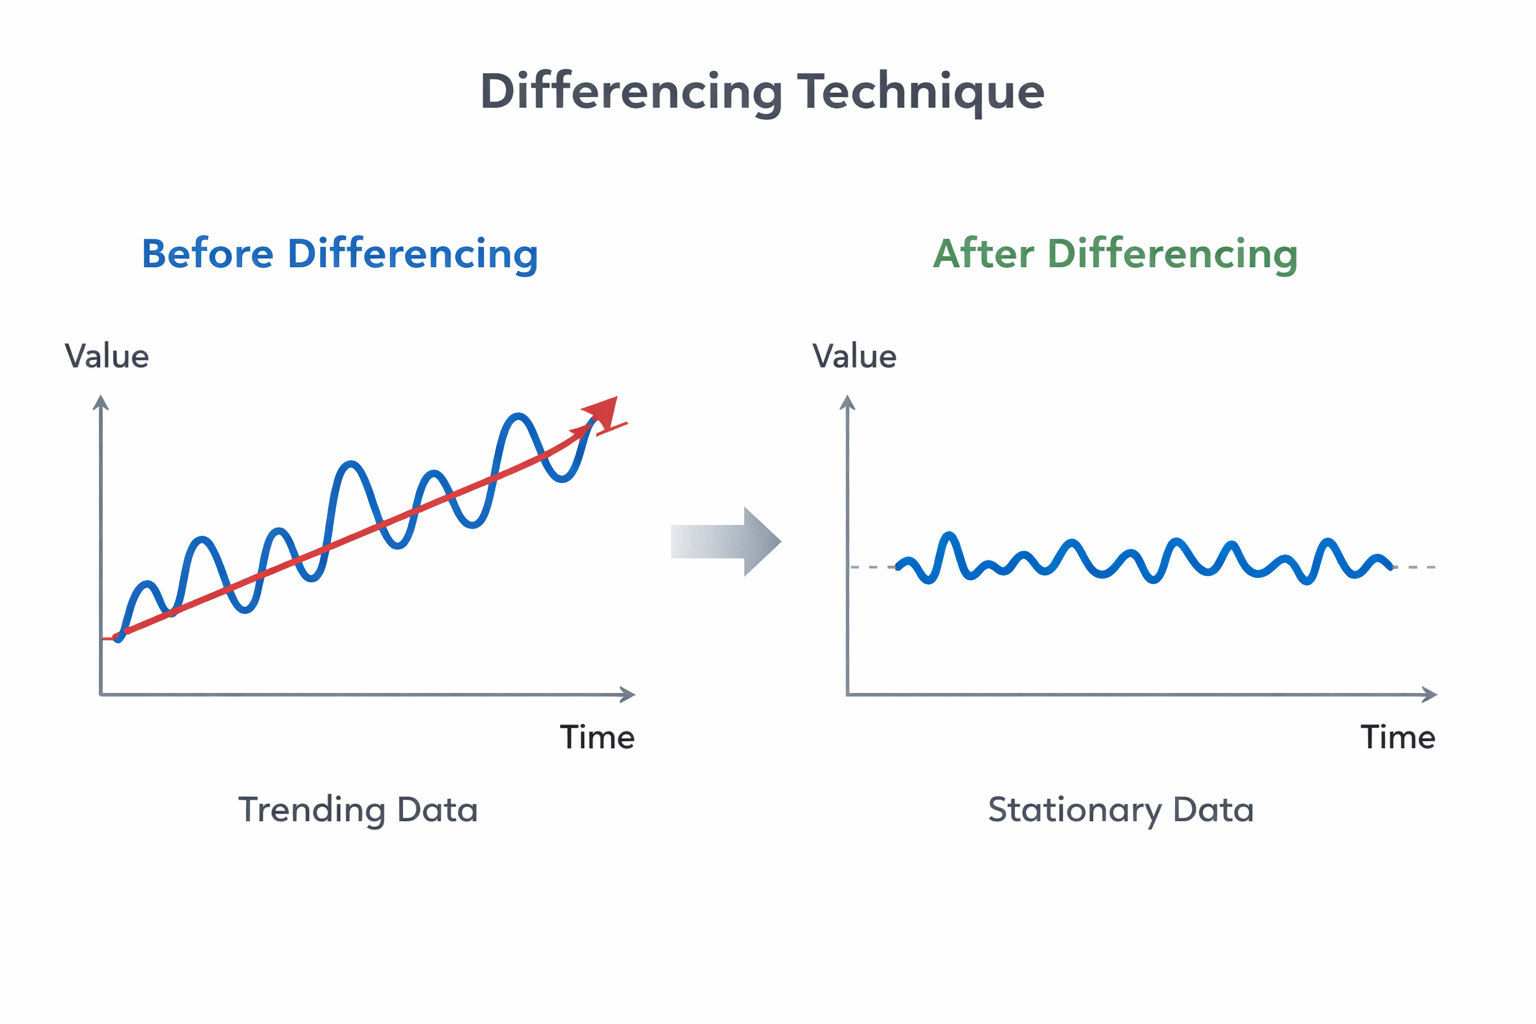
- Differencing
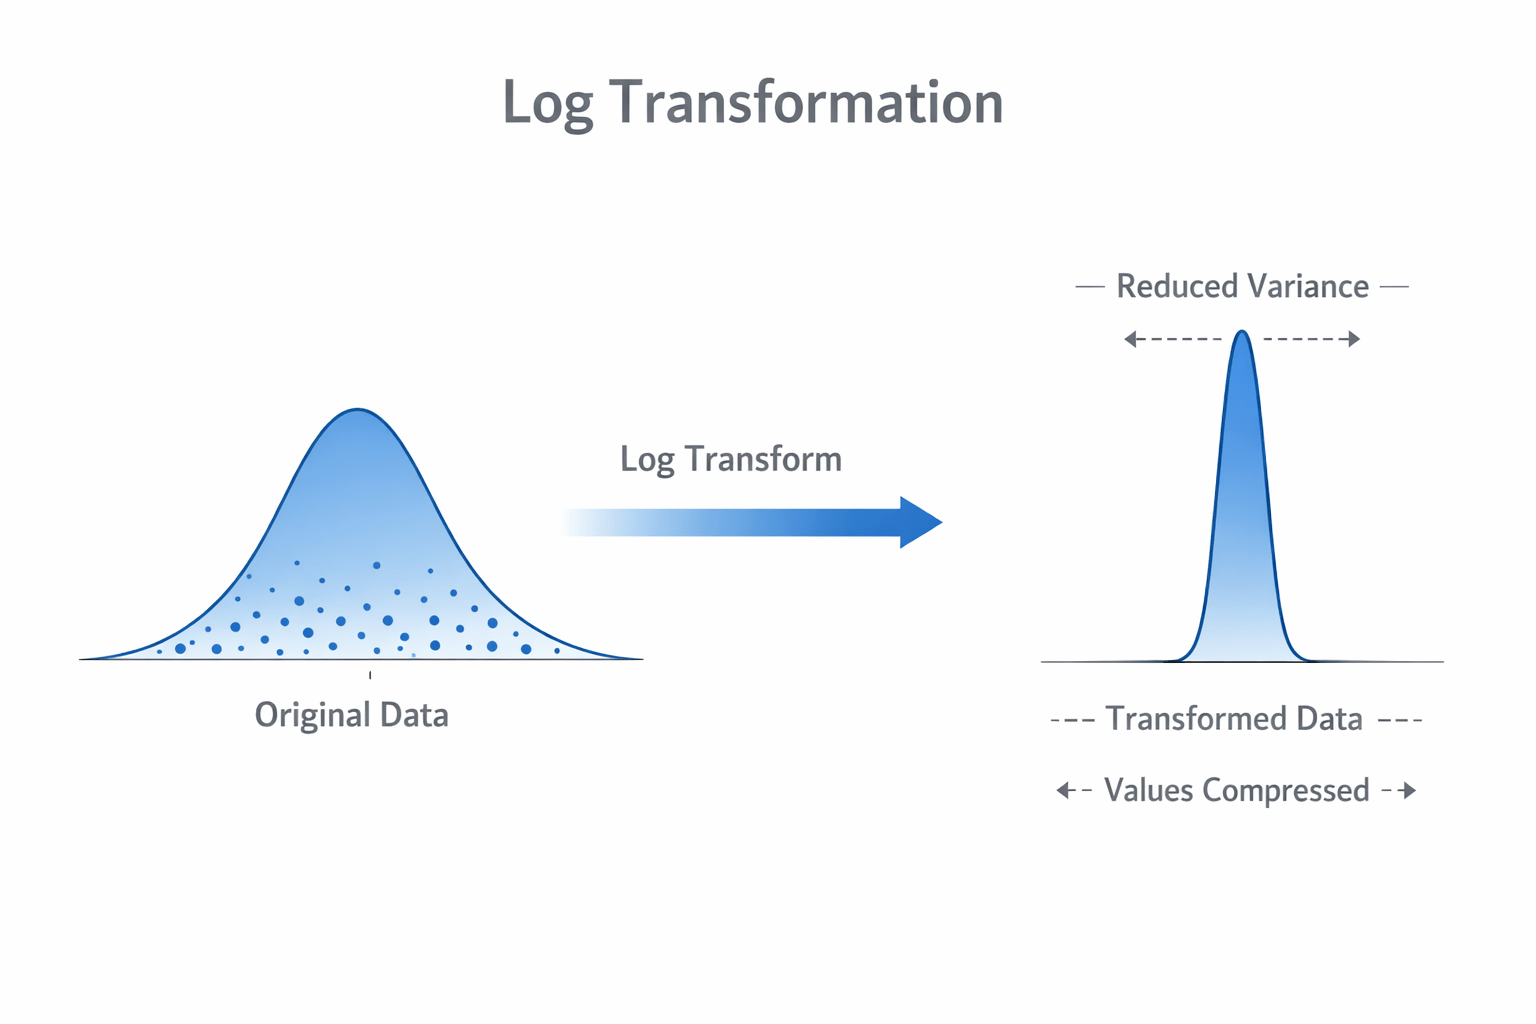
- Log Transformation
Differencing Technique:
Formula: Yt − Y(t−1)
Purpose:
- Removes trend
- Stabilizes mean
Log Transformation:
Formula: log(Y)
Used when:
- Variance increases over time.
Effect:
- Stabilizes variance
Complete Workflow
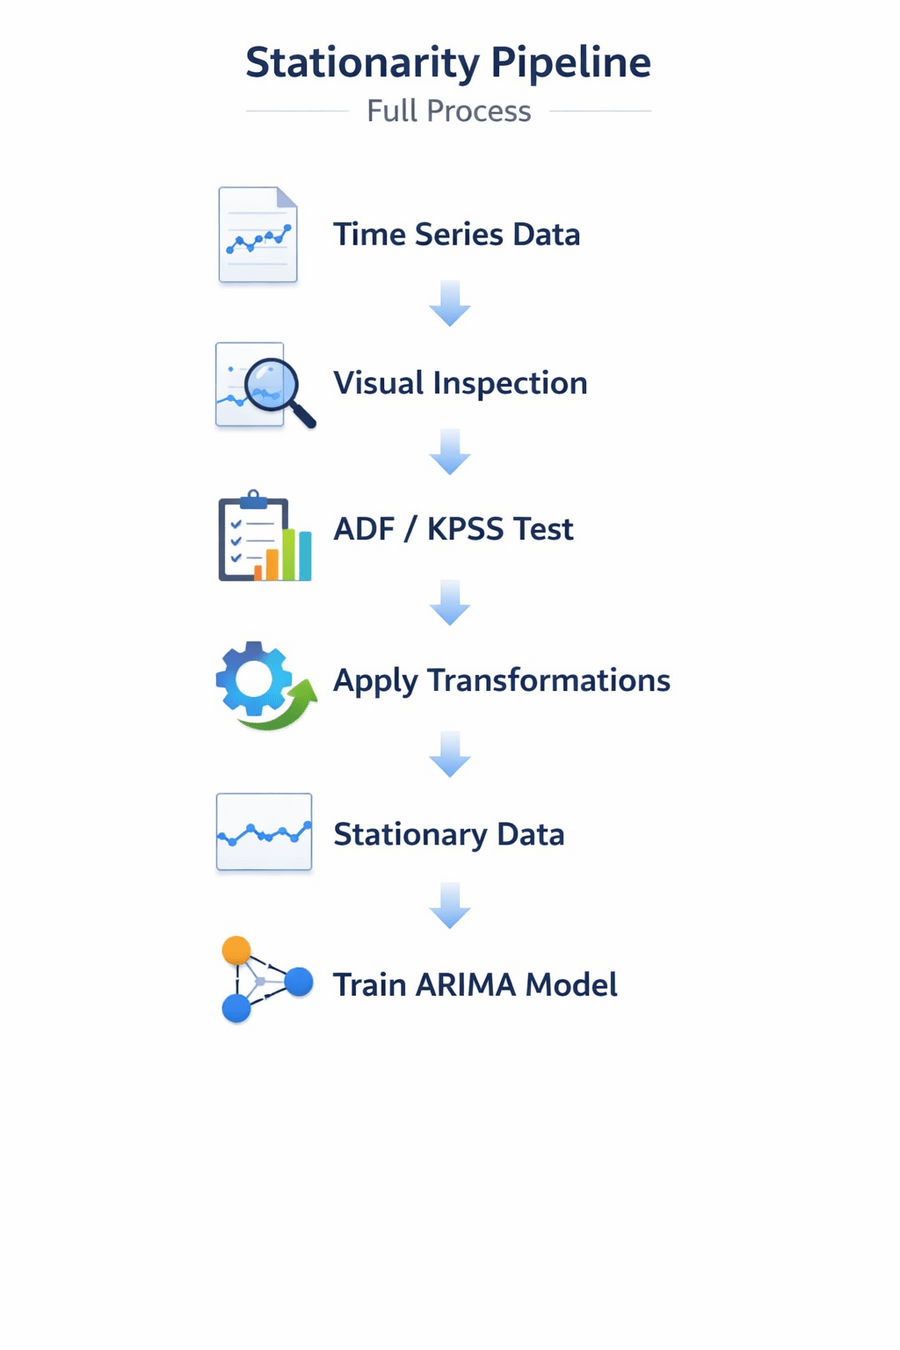
Time series → check stationarity → transform if needed → train ARIMA for forecasting.
Summary
5
Techniques like differencing and log transformation convert data to stationary
4
ADF and KPSS tests help statistically detect stationarity
3
Non-stationarity appears as trend, changing variance, or seasonality
2
Many forecasting models like ARIMA require stationary data
1
Stationarity means statistical properties remain constant over time
Quiz
Which statement about the ADF test is correct?
A. Null hypothesis: Data is stationary
B. Null hypothesis: Data is non-stationary
C. Used only for classification
D. Used to detect seasonality

Quiz
Which statement about the ADF test is correct?
A. Null hypothesis: Data is stationary
B. Null hypothesis: Data is non-stationary
C. Used only for classification
D. Used to detect seasonality
