Kubernetes Autoscaling for OpsMate Platform

Pre-Lab Preparation
-
Amazon EKS Cluster is running
-
kubectl is configured
-
Metrics Server can be installed
-
OpsMate image exists in Amazon ECR
-
Worker nodes are in Ready state

Understanding Kubernetes Autoscaling
What is Horizontal Pod Autoscaler (HPA)?
HPA automatically changes the number of Pods based on resource usage.
Example:
Low Traffic
2 Pods Running
High Traffic
8 Pods Running
Traffic Reduced
2 Pods Running Again
Task 1: Verify Cluster Connectivity
Verify cluster
kubectl cluster-info

Verify nodes
kubectl get nodes
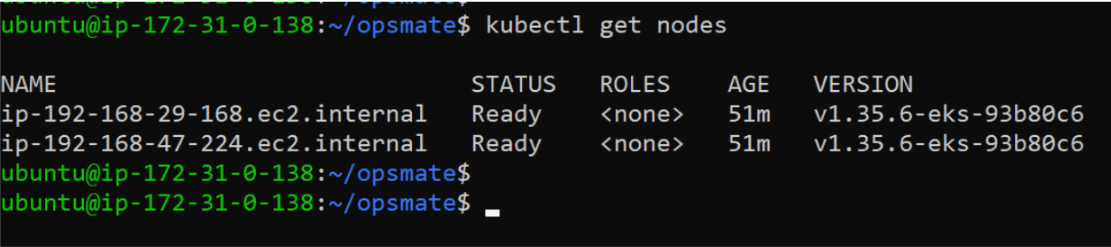
Check namespaces
kubectl get ns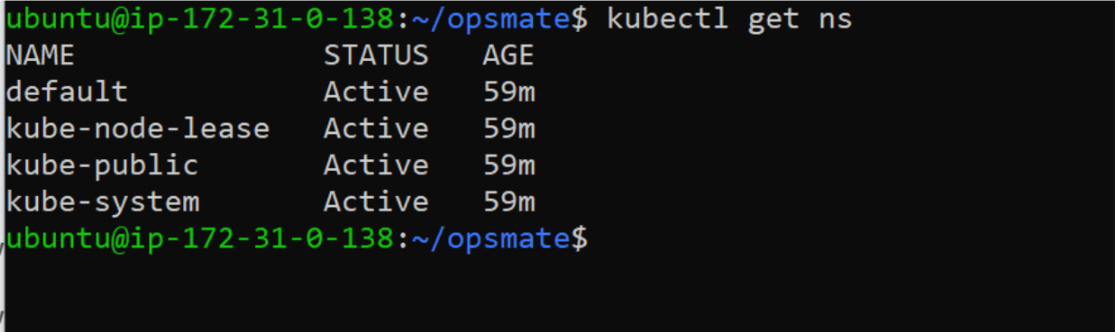
Task 2: Create OpsMate Namespace
Create OpsMate Namespace
kubectl create namespace opsmate

Set default namespace
kubectl config set-context --current --namespace=opsmate

Verify
kubectl config view --minify | grep namespace
Task 3 : Install Metrics Server
Why Metrics Server?
Kubernetes Autoscaler requires CPU and memory metrics.
Metrics Server collects:
-
CPU usage
-
Memory usage
-
Pod resource metrics
Without Metrics Server, HPA will not work.
Install Metrics Server
kubectl apply -f https://github.com
/kubernetes-sigs/metrics-server/releases
/latest/download/components.yaml
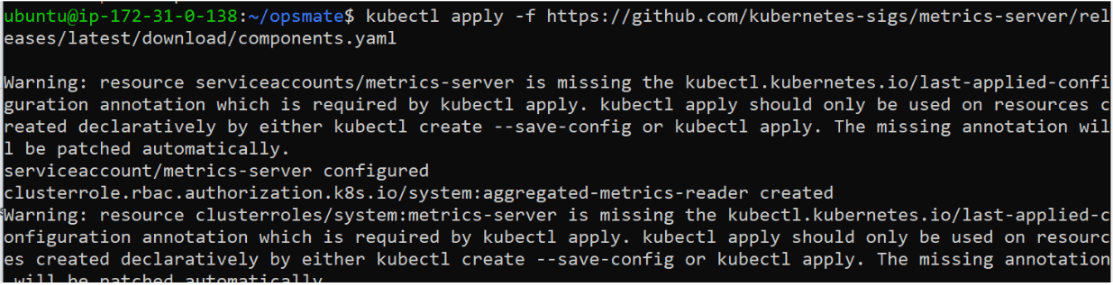
Verify deployment
kubectl get deployment metrics-server -n kube-system

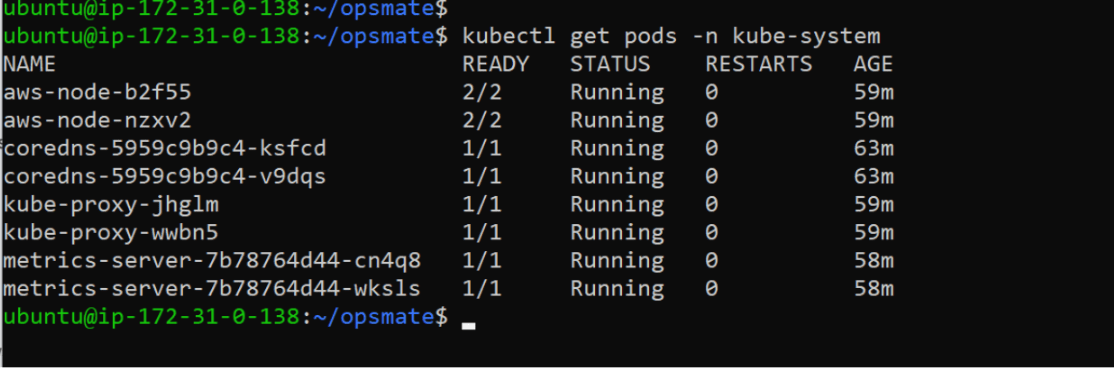
Verify Pods:
kubectl get pods -n kube-system
Task 4: Create OpsMate Deployment
Create deployment file:
nano deployment.yaml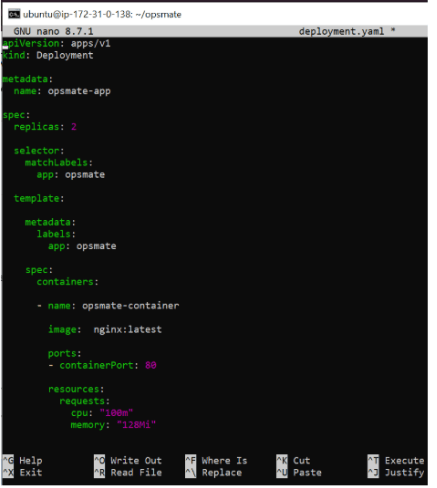
Apply deployment
kubectl apply -f deployment.yaml

Verify
kubectl get deployments
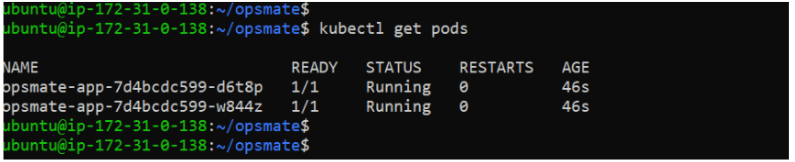
Verify Pods
kubectl get pods
Task 5: Expose Application
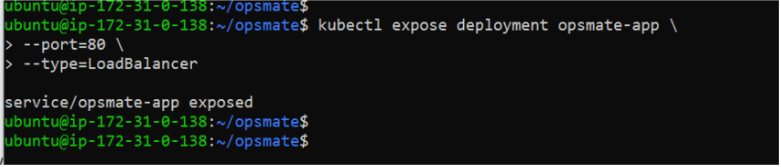
Expose deployment
kubectl expose deployment opsmate-app \
--port=80 \
--type=LoadBalancer
Verify Service
kubectl get svc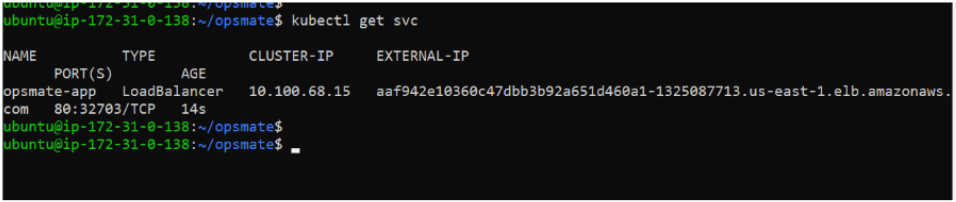
Verify HPA
kubectl get hpa
Describe Autoscaler
kubectl describe hpa opsmate-app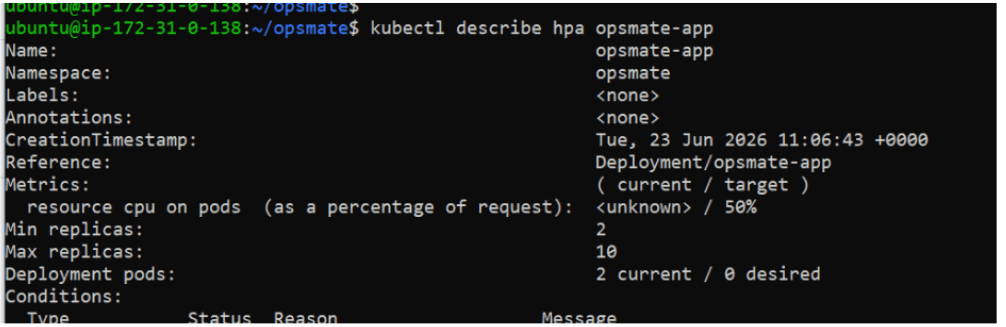
Task 6: Generate Load for Autoscaling
Now we will simulate high traffic.
Create load generator Pod:
kubectl run load-generator \
--image=busybox \
-it --rm \
-- /bin/sh
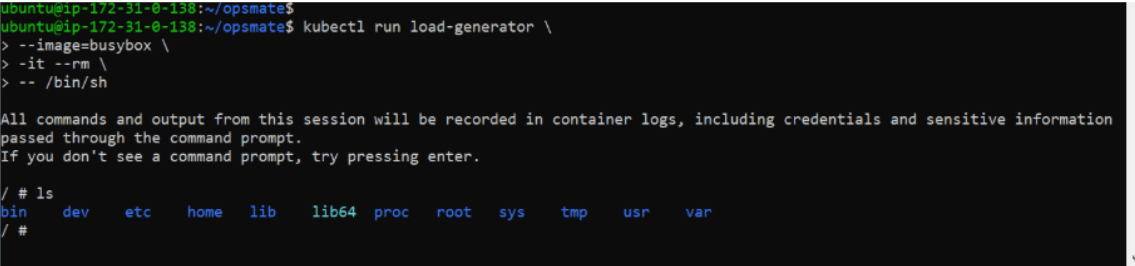
Inside the container run:
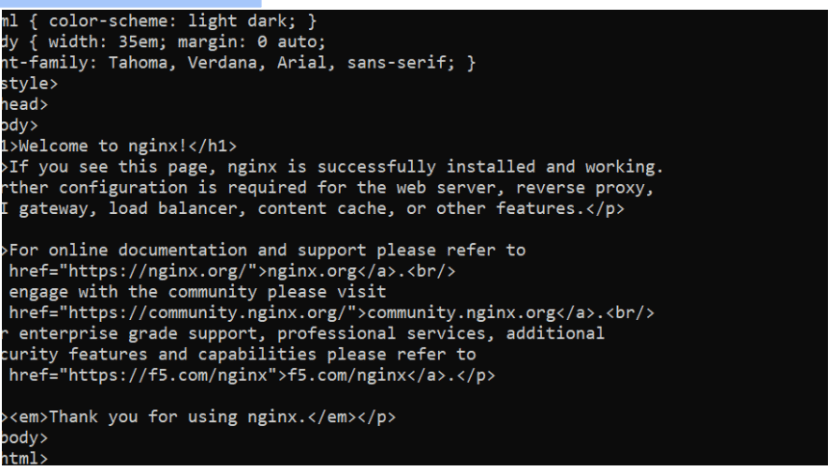
while true; do wget -q -O- http://opsmate-app; done
This continuously sends requests to the application.
Keep this running for several minutes.
Open another terminal
Task 7: Monitor Autoscaling Behavior
Watch HPA activity
kubectl get hpa -w
You will notice:
TARGETS
70%
80%
95%
Task 8: Analyze Resource Optimization
Observe:
|
Situation |
Pods |
|
Normal Traffic |
2 |
|
Heavy Traffic |
Multiple |
|
Low Traffic Again |
Reduced |
This demonstrates:
-
Efficient resource management
-
Better application availability
-
Reduced infrastructure cost
Great job!
-
Installed Metrics Server
-
Deployed OpsMate application
-
Configured Kubernetes resource requests and limits
-
Enabled Horizontal Pod Autoscaler
-
Generated application load
-
Monitored scaling behavior
-
Observed automatic scale-up and scale-down
-
Optimized Kubernetes resource utilization
Checkpoint