Dr Dénes Csala
Lecturer in Energy Systems, Lancaster University
Visiting Lecturer in Data Science, University of Bristol
Visiting Assistant Professor in Data Visualisation, Babes-Bolyai University
Data Visualisation Lead, Economics Observatory, University of Bristol
The language of data is visualisation


7th April 2022


-
Levelling up: What it means
for Scotland? - article on the Economics Observatory -
Create an accompanying charts
Task
TIDY data
-
Data Guidelines
-
Visualisation Guidelines
-
Write an article about the Winter Olympic Games for the Economics Observatory
-
Create an accompanying charts
Task
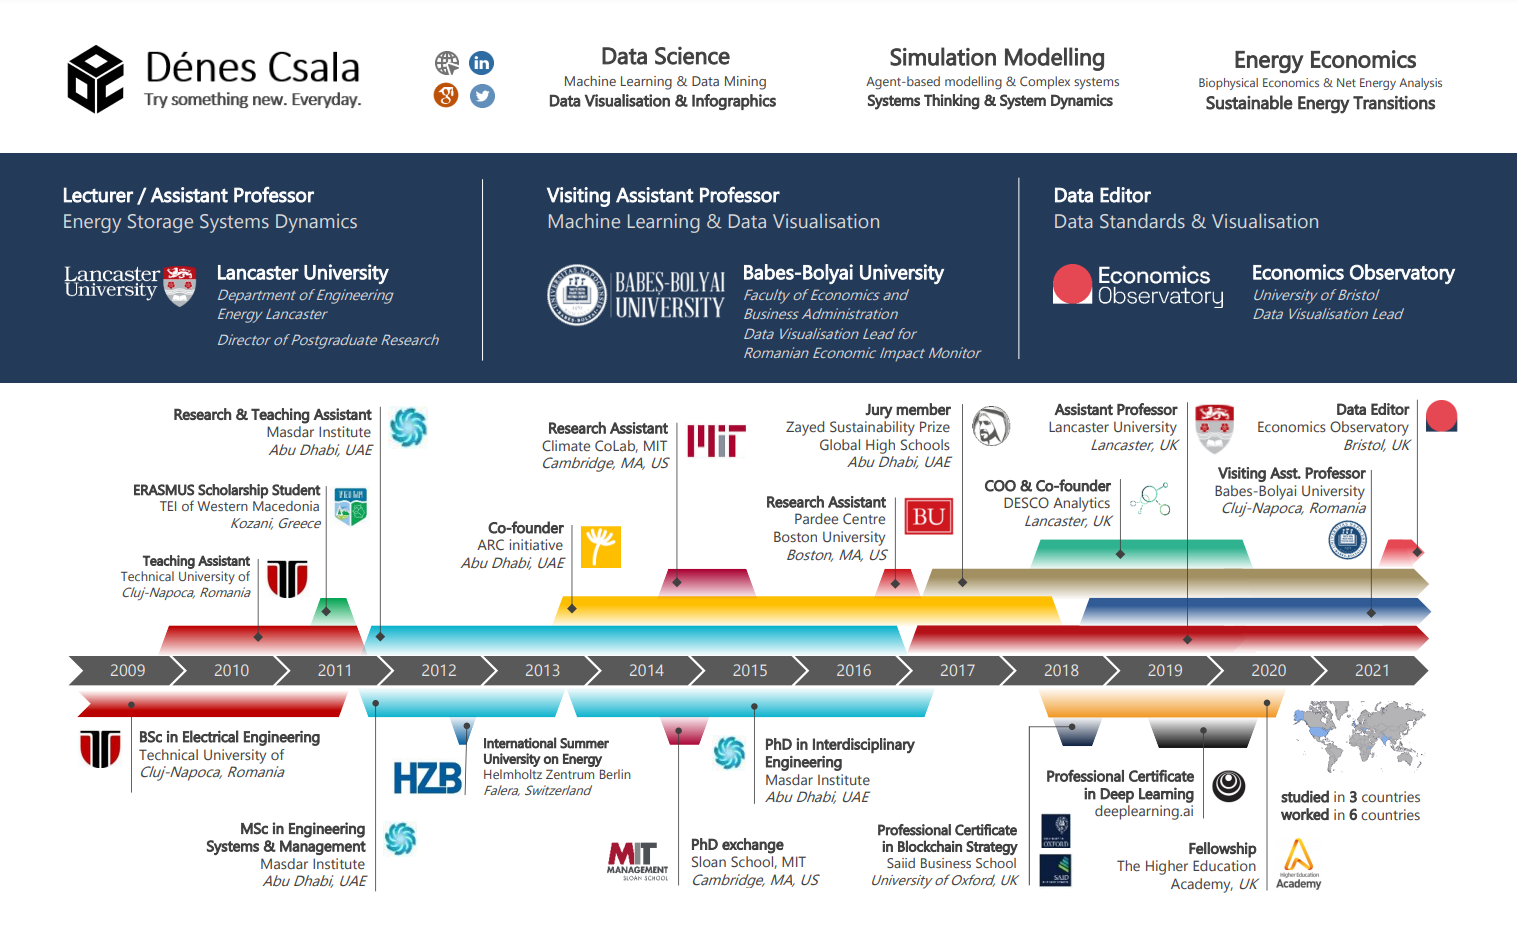
Career path
Lancaster University, Department of Engineering
-
Power Systems / Introduction to Engineering Physics
Autumn 2018/19 (19 responses / 129 students, 4.37 / 5.00)
Autumn 2019/20 (20 responses / 143 students, 4.15 / 5.00)
Autumn 2020/21 (32 responses / 126 students, 4.34 / 5.00)
University of Bristol, Department of Economics
-
Introduction to Data Science / Data Visualisation
Autumn 2021/22 (22 responses / 74 students, 4.80 / 5.00)
Babes-Bolyai University, Department of Economics
-
Introduction to Data Visualisation / Business Intelligence
Autumn 2018/19 (10 responses / 43 students, 4.30 / 5.00)
Autumn 2019/20 (11 responses / 68 students, 5.00 / 5.00)
Autumn 2020/21 (14 responses / 42 students, 4.93 / 5.00)
-
Live visualisations with streaming data
Spring 2019/20 (26 responses / 51 students, 4.75 / 5.00)
Spring 2020/21 (7 responses / 35 students, 4.85 / 5.00)
Data
Information
Knowledge

Arecibo Interstellar Message - wikimedia.com
attention poverty
"What information consumes is rather obvious: it consumes the attention of its recipients. Hence, a wealth of information creates a poverty of attention, and a need to allocate that attention efficiently among the overabundance of information sources that might consume it."
Herbert Simon
Scientific American, 1995
UW CSE442 course and PARC UIR
Portrait of Herbert Simon - Richard Rappaport CC BY 3.0

visualisation = understanding
"The ability to take data - to be able to understand it, to process it, to extract value from it, to visualize it, to communicate it - that's going to be a hugely important skill in the next decades, ...because now we really do have essentially free and ubiquitous data."
Hal Varian, Chief Economist, Google
The McKinsey Quarterly, 2009
UW CSE442 course
Hal Varian - Joi Ito CC BY 2.0

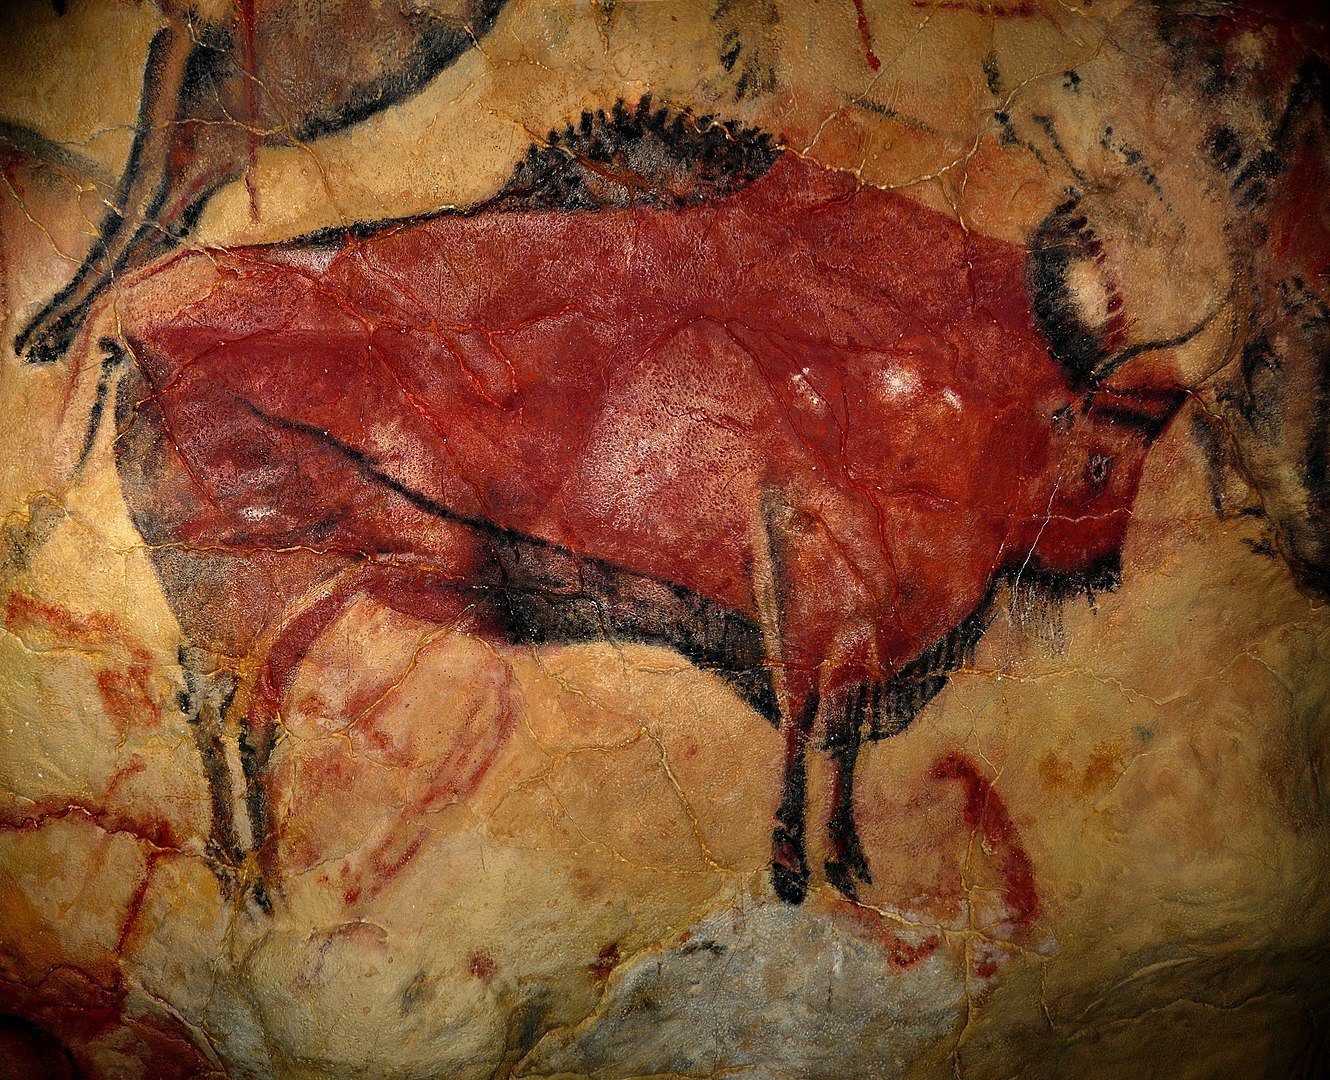

Altamira cave painting, 36 000 BC
Ted Chiang, Eric Heisserer, Martine Bertrand, Stephen & Christopher Wolfram "Louise" on the alien language designed for Arrival, 2016 CC A-NC 4.0
Dr Dénes Csala
Lecturer in Energy Systems, Lancaster University
Visiting Lecturer in Data Science, University of Bristol
Visiting Assistant Professor in Data Visualisation, Babes-Bolyai University
Data Visualisation Lead, Economics Observatory, University of Bristol
7th April 2022
Thank you!
Big Data =
Big Responsibility
Datasaurus, Autodesk, 2017

Wald Ábrahám, 1944