BIOSC 1540: L07A (Quantification)
This is a live streamed presentation. You will automatically follow the presenter and see the slide they're currently on.
This is a live streamed presentation. You will automatically follow the presenter and see the slide they're currently on.
Computational Biology
(BIOSC 1540)
Feb 18, 2025
Lecture 07A
RNA Quantification
Foundations
Assignments
Quizzes
CBytes
CBits
When you are finished, please hold on to your quiz and feel free to doodle, write anything, tell me a joke, etc. on the last page
Suppose we have isolated a normal and cancerous cell
Cancerous
Normal
We want to identify possible drug targets based on overexpressed genes
We have to quantify the amount of transcripts in our cell(s)
Let's consider only three transcripts
They have short, medium, and long lengths
We first have to define what possible transcripts our cells have
Normal
Cancerous
Example distribution of mRNA under different conditions
Transcriptome
Reads/Fragments
Given the sequencing reads that were sampled from these transcripts
How many copies of each transcript were in my original sample?
Unknown quantity
Experimental biases and errors
Transcriptome
Reads/Fragments
We align each read to single transcript using our read mapping algorithms
1
2
4
Number of reads mapped to each transcript
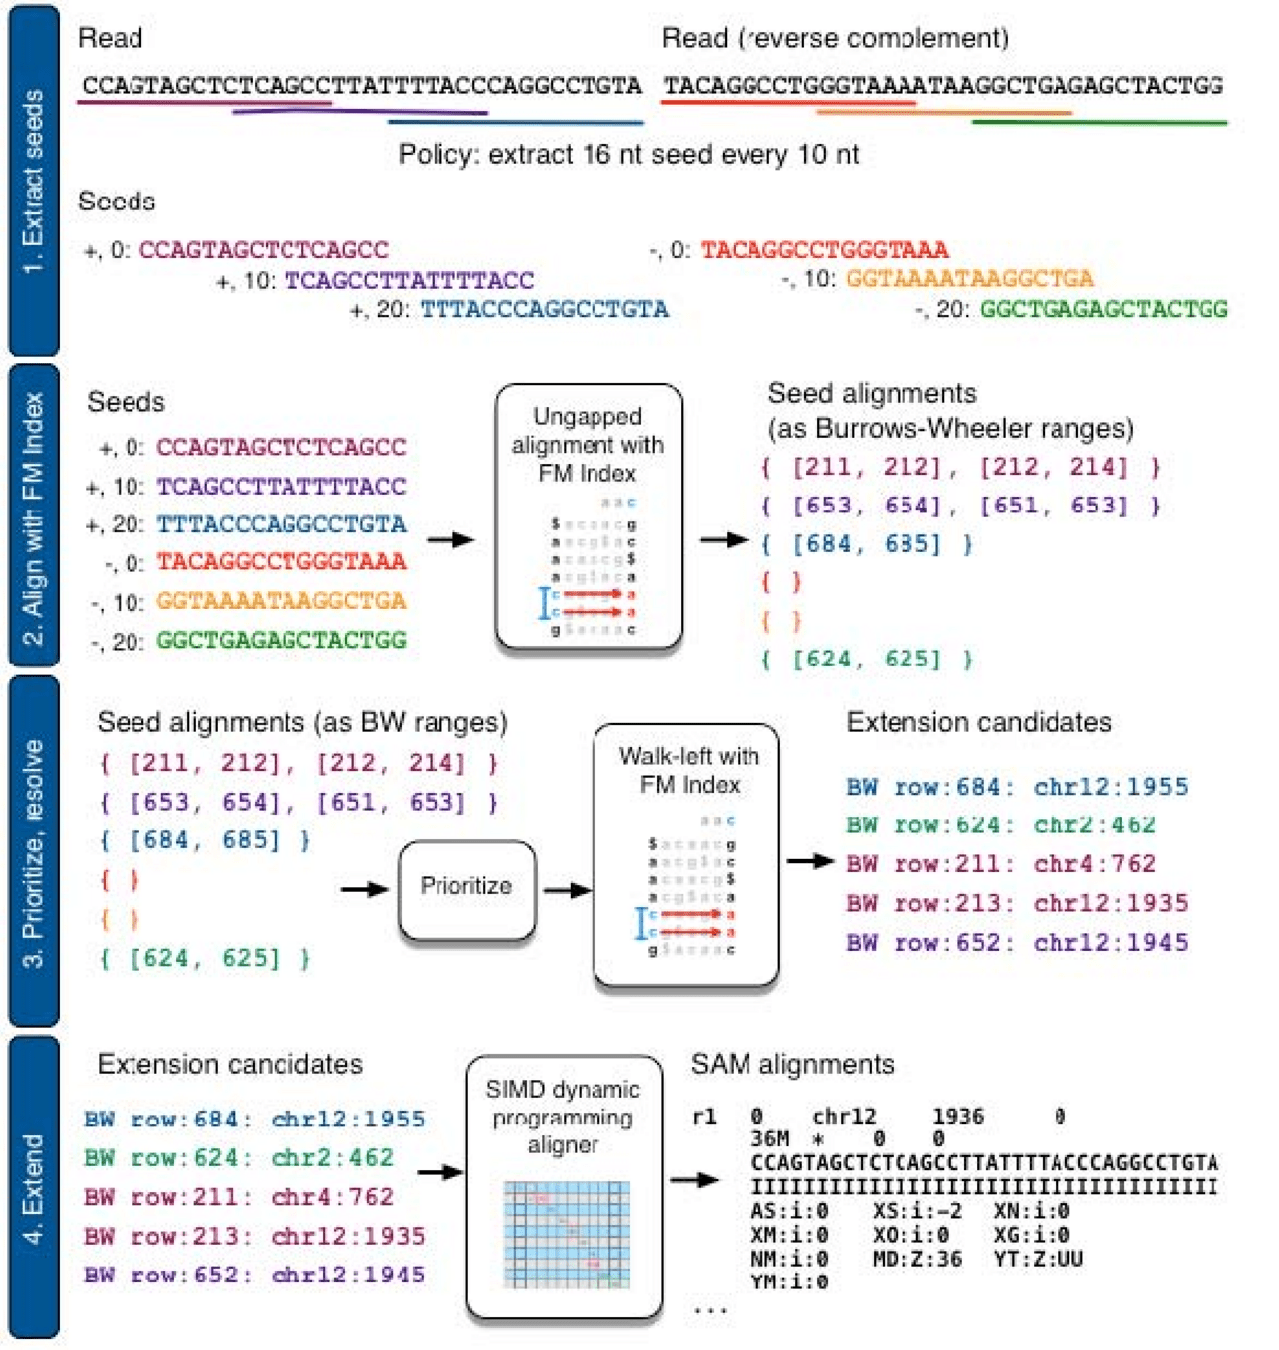
DOI: 10.1038/nmeth.1923
1. Extract k-mer seeds from all reads in our sample
2. Use FM-index of transcriptome to search for k-mer matches
3. Extend alignments starting from k-mer seeds
These approaches are extremely slow (we have 30 to 60 million reads)
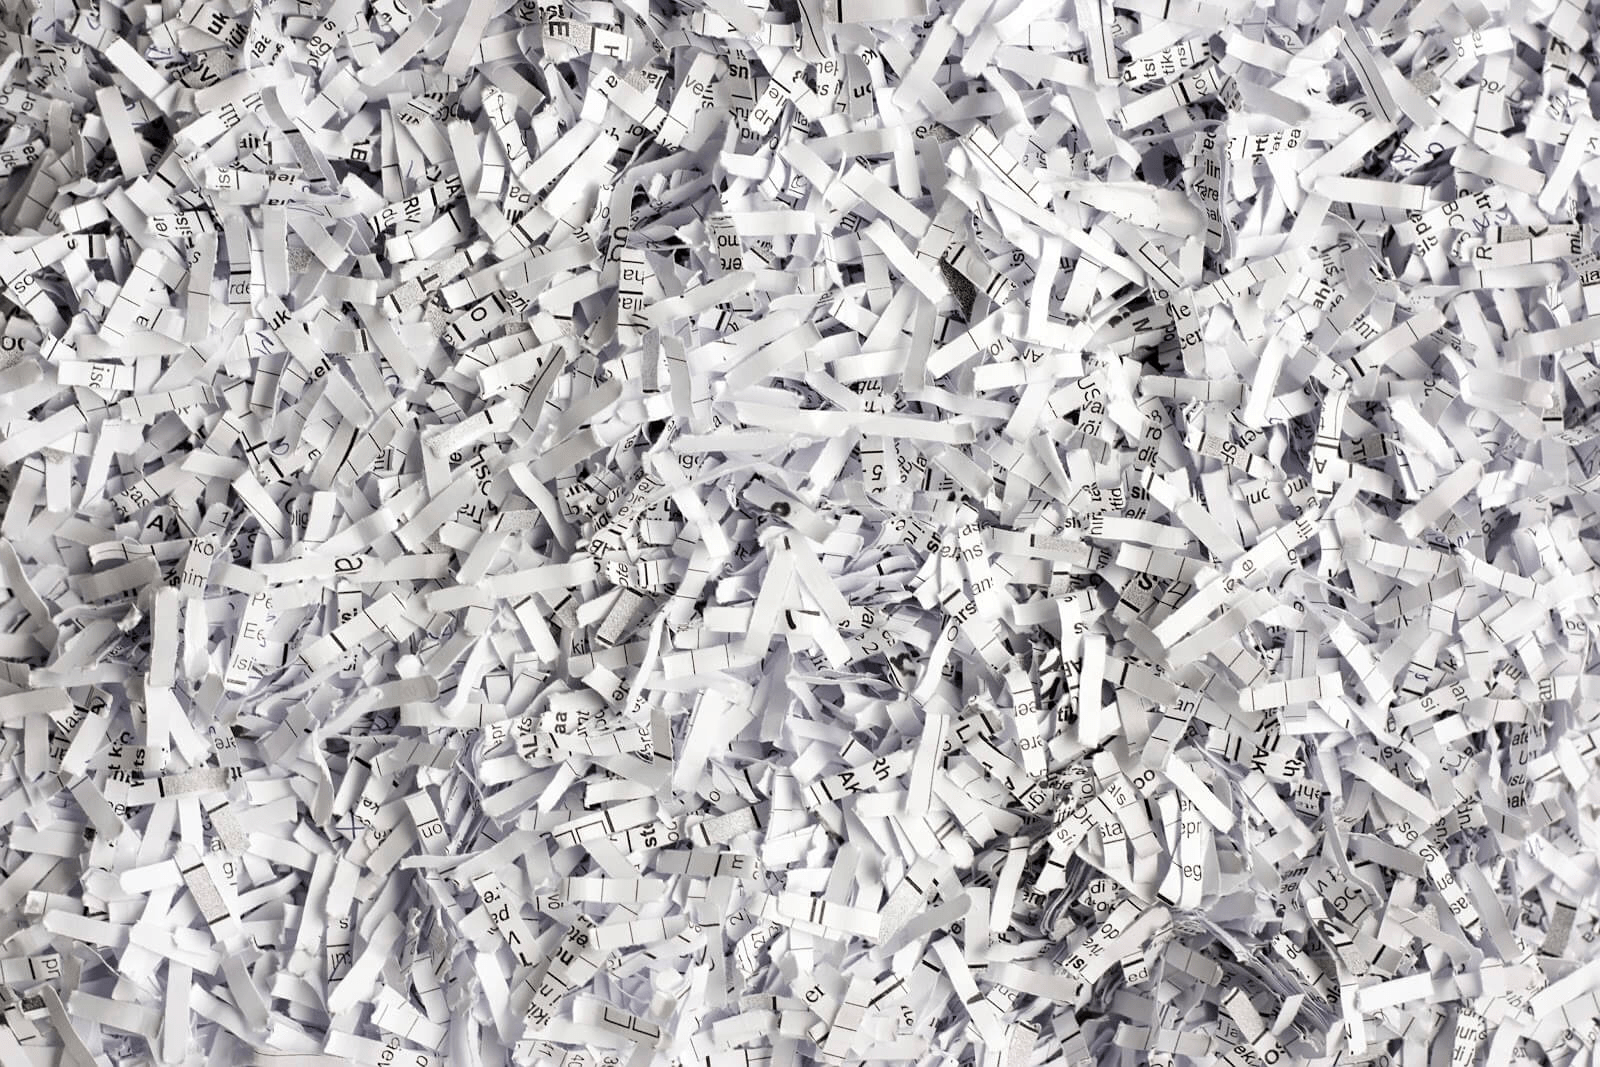
Suppose someone took library books (transcripts) and then shredded them (reads)
We would need to find which book each piece came from, but also which page
This would take a long time
Relating it back: Alignment-based methods need to determine the read's exact position in the transcript
Why?
We want to tape these books back together by using another library's copy as a reference
Strategy: Identify which transcripts are compatible with the read, skipping the precise location (i.e., alignment) step
Instead of having to find the exact page each piece is from, suppose we just need to figure out which book
This is all we need to know for RNA quantification: Where did this read come from?
Alignment
Pseudoalignment
Specifies where exactly in the transcript this read came from
(e.g., at position 478)
Specifies that it came somewhere from this transcript (i.e., compatible)
Reads
Transcripts
Bypassing alignment accelerates quantification, but how can we do this?
Initial sample
We can only use reads to quantity our initial mRNA sample
Has some number of transcripts
Fragments
Reads
After PCR amplification and fragmentation
Sequencing with errors
Generative model: A statistical model that explains how the observed data are generated from the underlying system
Defines a computational framework that produces sequencing reads from a transcriptome
Let's walk through a conceptual example
Suppose we take some number of green, blue, and red marbles (i.e., transcripts)
We put the marbles into a bag and crush them (i.e., PCR amplification and fragmentation)
We then take a handful of marble fragments (i.e., reads)
How would you estimate the distribution of marbles in the bag?
and then determine their color (i.e., map)
Red marbles are twice the size
These differences are called biases
Blue marbles break easily
How would you adjust your approach?
1. Guess some number of marbles
0. Determine/learn bias probabilities of sampling that specify our framework
2. Randomly sample n fragments
3. Compare to our original distribution
If our simulated distribution closely matches our observed distribution, we have a likely estimate of the original (hidden) distribution
Does not match
1. Guess some number of marbles
2. Randomly sample n fragments
We keep trying new marble combinations until our generated fragments look very similar to our observed fragments
This is conceptually similar to how RNA quantification methods work (e.g., Salmon)
Lecture 07B:
Quantification -
Methodology
Lecture 07A:
Quantification -
Foundations
Today
Thursday
Longer transcripts will have more reads
Read per kilobase (RPK) corrects this experimental bias through normalization by gene length
(Length is usually just the exons)
For the first 5,000,000 observations we learn these defined bias parameters
Probability of generating fragment j from transcript i
Probability of drawing a fragment of the inferred length given t
Probability of fragment starting at position p on t
Probability of obtaining a fragment with the given orientation
Probability of alignment of fragment j given these mapping and transcript conditions
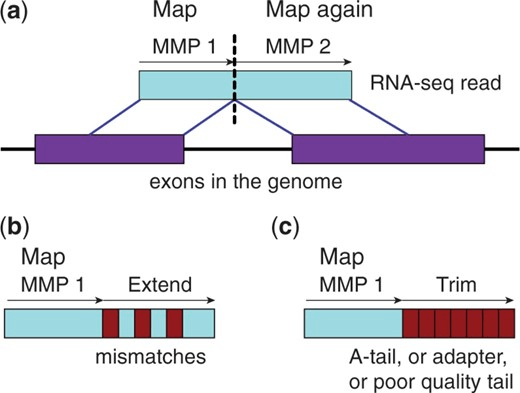
Maximum Mappable Prefix (MMP) approach for fast, accurate spliced alignments
Finds prefix that perfectly matches reference then repeats for unmatched regions
This automatically detects junctions instead of relying on databases
Represents the probability of the alignment starting at a particular position or state sos_o
The probability of the fragment "transitioning to another state"
Essentially, how likely does this fragment align somewhere else
For fun: Hidden Markov Models
2
3
4
We can use transcripts fraction
Normal
Cancerous
Because the cancer cell is transcribing more overall, we still get changes across the board
Real data has more than three transcripts and ratios are substantially smaller (e.g., 0.000001)
This can make computations and communications challenging, so we often scale everything to a million to use unsigned integers
| Transcript | Normal | Cancerous |
|---|---|---|
| 1 | 222,222 | 266,666 |
| 2 | 333,333 | 400,000 |
| 3 | 444,444 | 333,333 |
| Total | 1,000,000 | 1,000,000 |
Small floats require high precision (i.e., float64) and thus memory