Foundations of DS for everyone -I
This is a live streamed presentation. You will automatically follow the presenter and see the slide they're currently on.
This is a live streamed presentation. You will automatically follow the presenter and see the slide they're currently on.
dr.federica bianco | fbb.space | fedhere | fedhere
I: what is data science and working environment
what is data science?
dr.federica bianco | fbb.space | fedhere | fedhere
dr.federica bianco | fbb.space | fedhere | fedhere
coding
statistics
domain knowledge
Data Science: the field of studies that deals with the extraction of information from data within a domain context to enable interpretation and prediction of phenomena.
This includes development and application of statistical tools and machine learning and AI methods
dr.federica bianco | fbb.space | fedhere | fedhere
dr.federica bianco | fbb.space | fedhere | fedhere
Artificial Intelligence:
enable machines to make decisions without being explicitly programmed
Machine Learning:
machines learn directly from data and examples
Data Science: the field of studies that deals with the extraction of information from data within a domain context to enable interpretation and prediction of phenomena.
This includes development and application of statistical tools and machine learning and AI methods
Deep Learning
(Neural Networks)
we will refer to this as needed
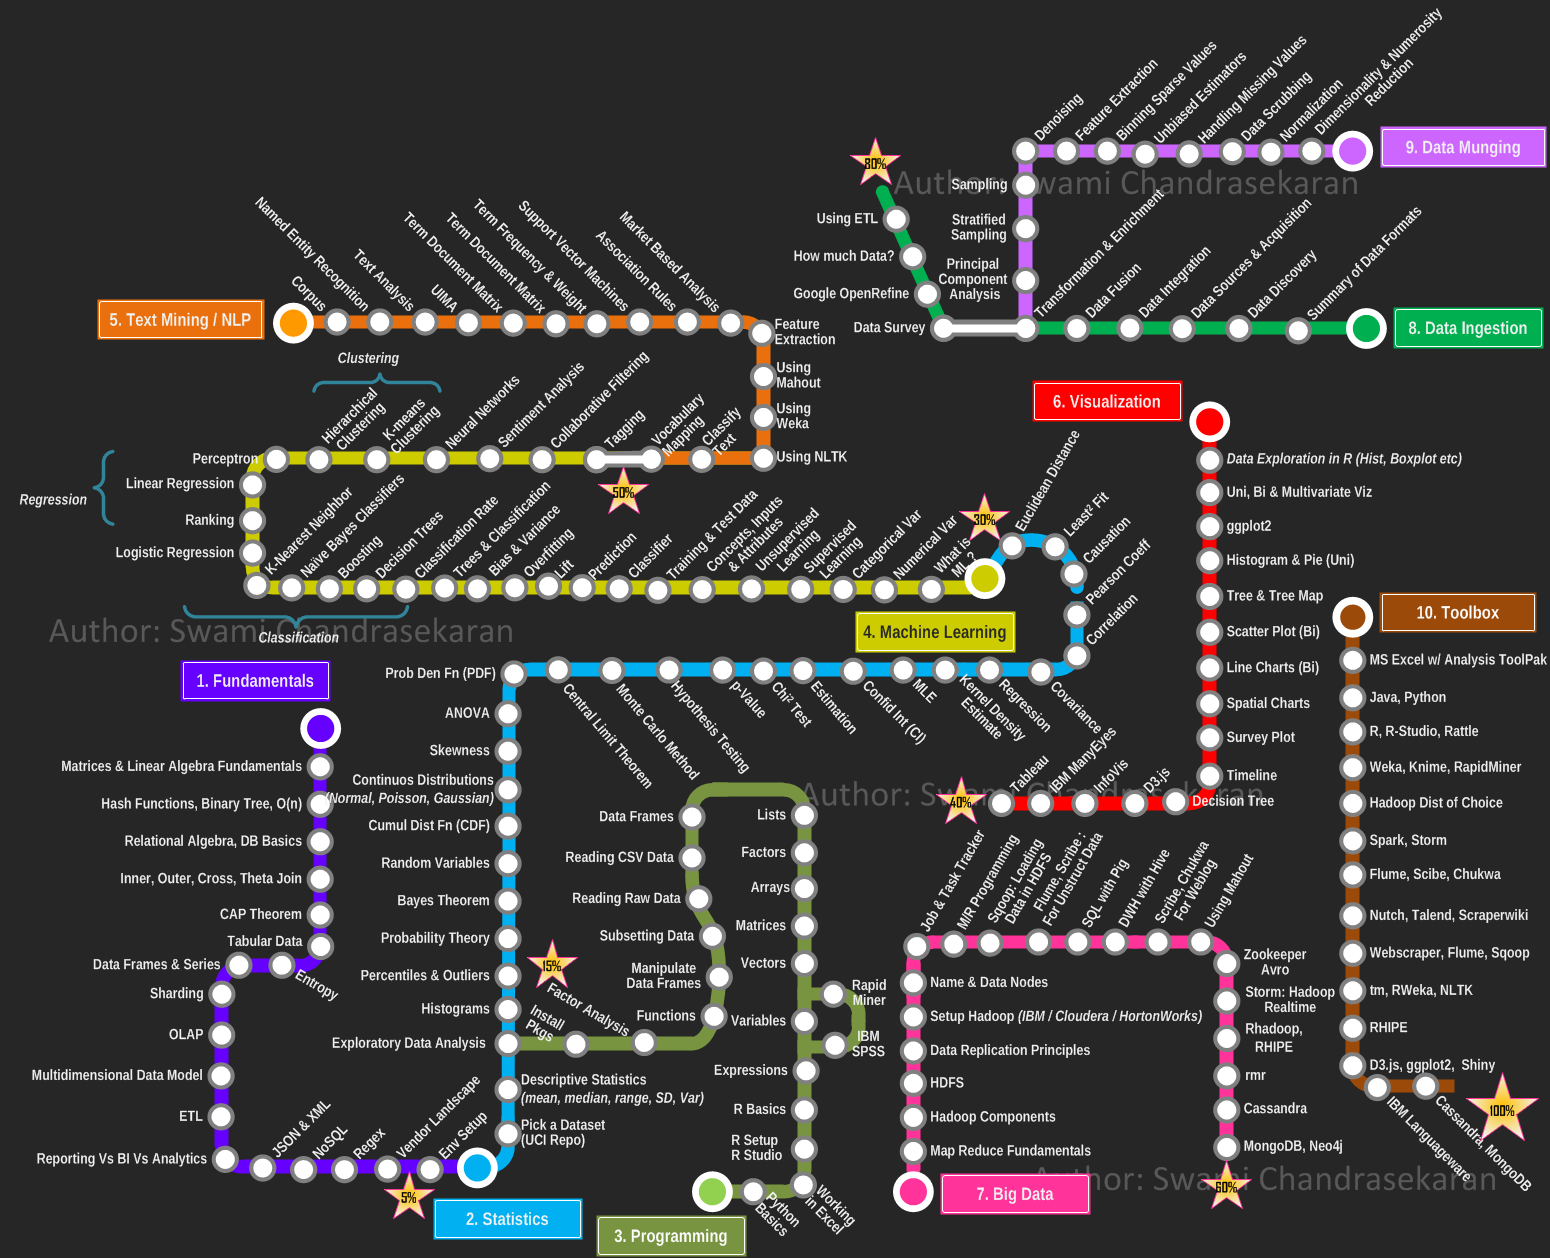
STATISTICS
PROGRAMMING
we will not get to this
PROGRAMMING
MACHINE LEARNING
DATA MUNGING
DATA INGESTION
but the focus is this
VISUALIZATION
NLP
STATISTICS
STATISTICS
PROGRAMMING
MACHINE LEARNING
VISUALIZATION
DATA MUNGING
DATA INGESTION
what's left?
probability distributions
p-values
uncertainties
python
STATISTICS
PROGRAMMING
MACHINE LEARNING
VISUALIZATION
DATA MUNGING
DATA INGESTION
what's left?
python
probability distributions
p-values
uncertainties
regression
(linear, template)
classification
(trees, neural networks)
clustering
some administrative stuff
😷
Be safe so we can stay!!
5% pre-class questions
15% class participation (ask questions, contribute in breakouts!!)
25% homework
15% midterm
30% final
5% pre-class questions
15% class participation (ask questions, contribute in breakouts!!)
25% homework
15% midterm
30% final
from beginning of class to 5 minutes past (be on time!)
questions on previous class material and reading assignments
ask questions
answer questions
get up and code
extra credit assignments
5% pre-class questions
15% class participation (ask questions, contribute in breakouts!!)
25% homework
15% midterm
30% final
Please work in groups of up to 3-5 people on homework as a collaborative projects.
All members of the group are responsible for the assignment.
The assignment must be uploaded in every student's repository. Does not have to be identical for all group members, but it has to be just as complete as the one turned in
5% pre-class questions
15% class participation
25% homework
15% midterm
30% final
to ensure a healthy and safe collaborative environment
3) join the slack with the link you receive after finishing the form
the tools
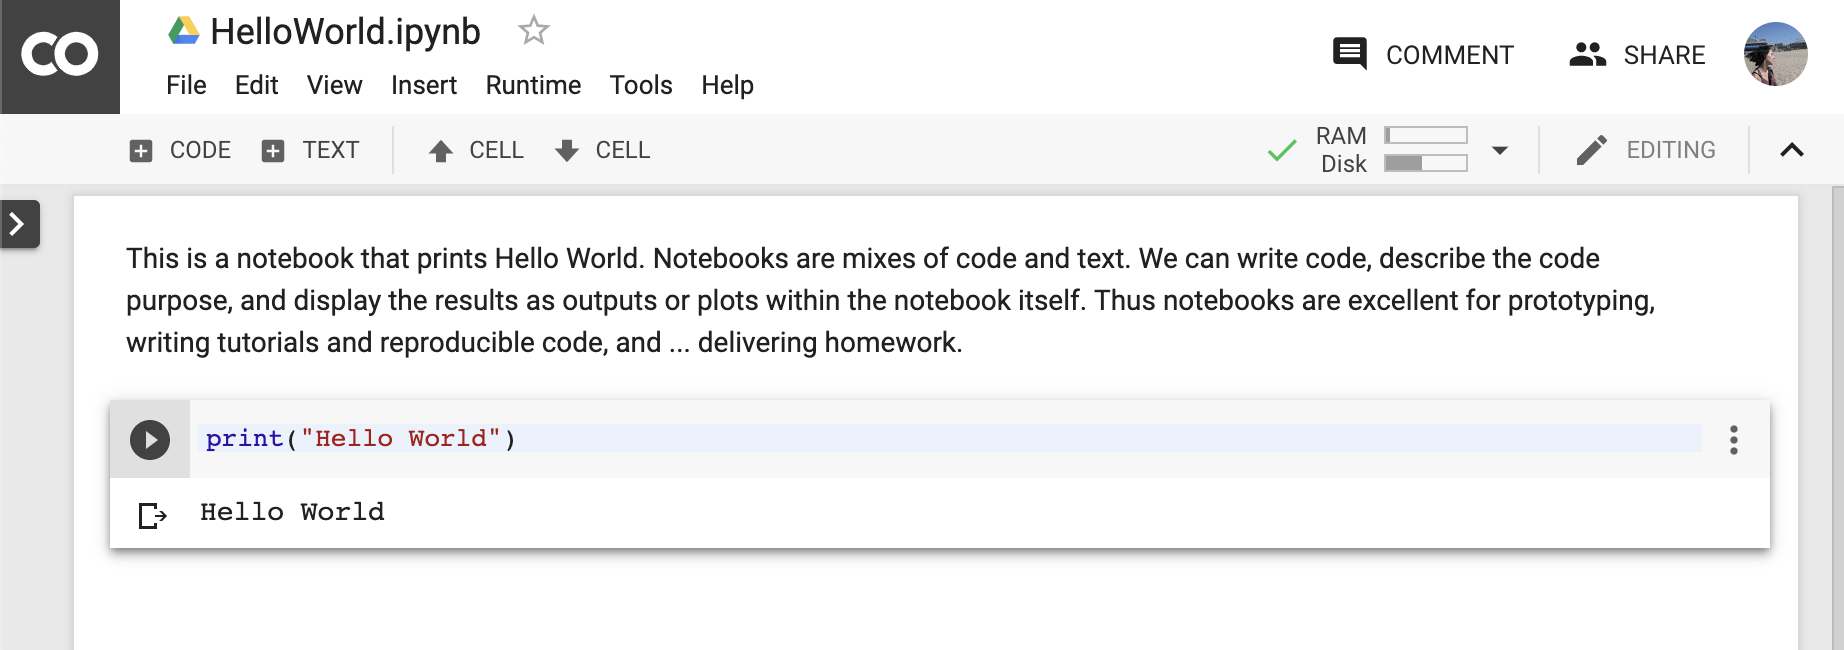
A collaborative platform for python coding
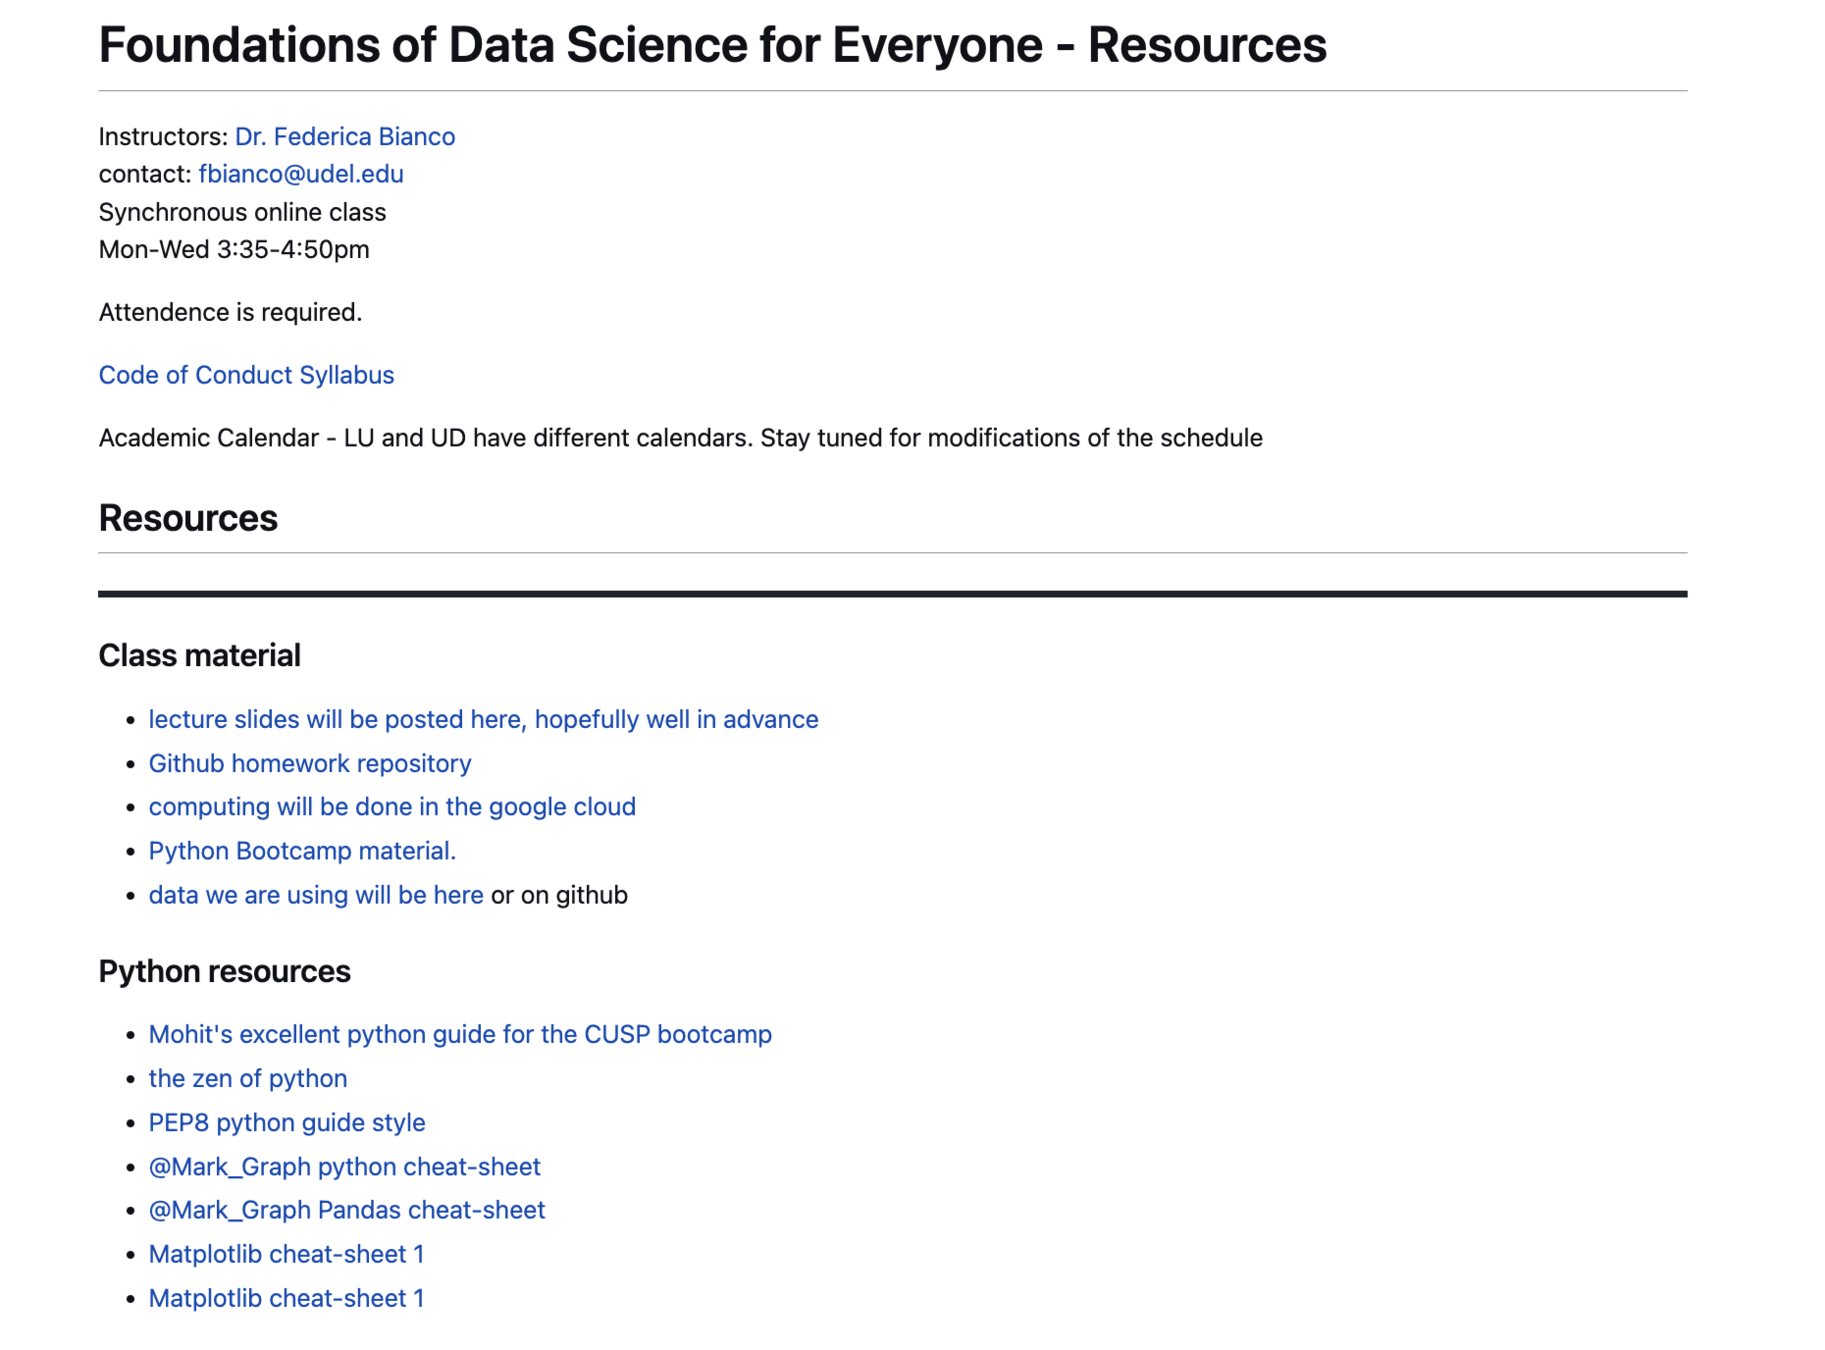
Resources: Notebook based
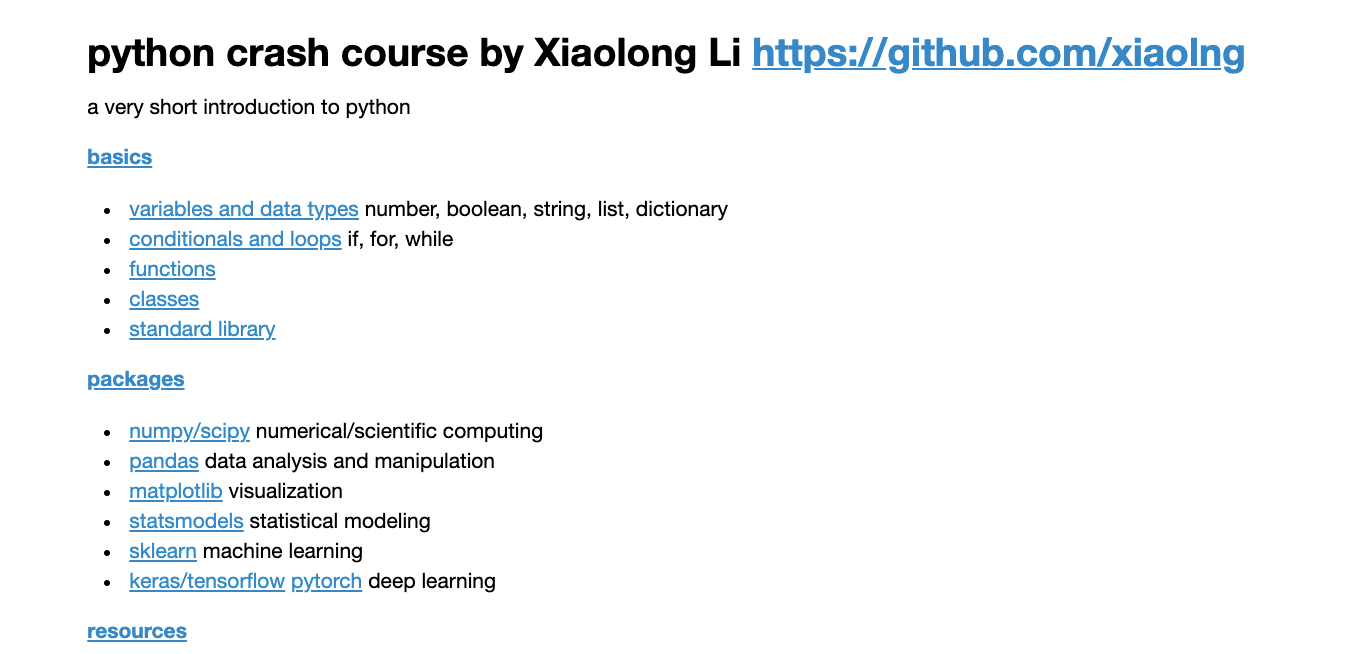
Most compact and rapid:
Xiaolong Li crash course
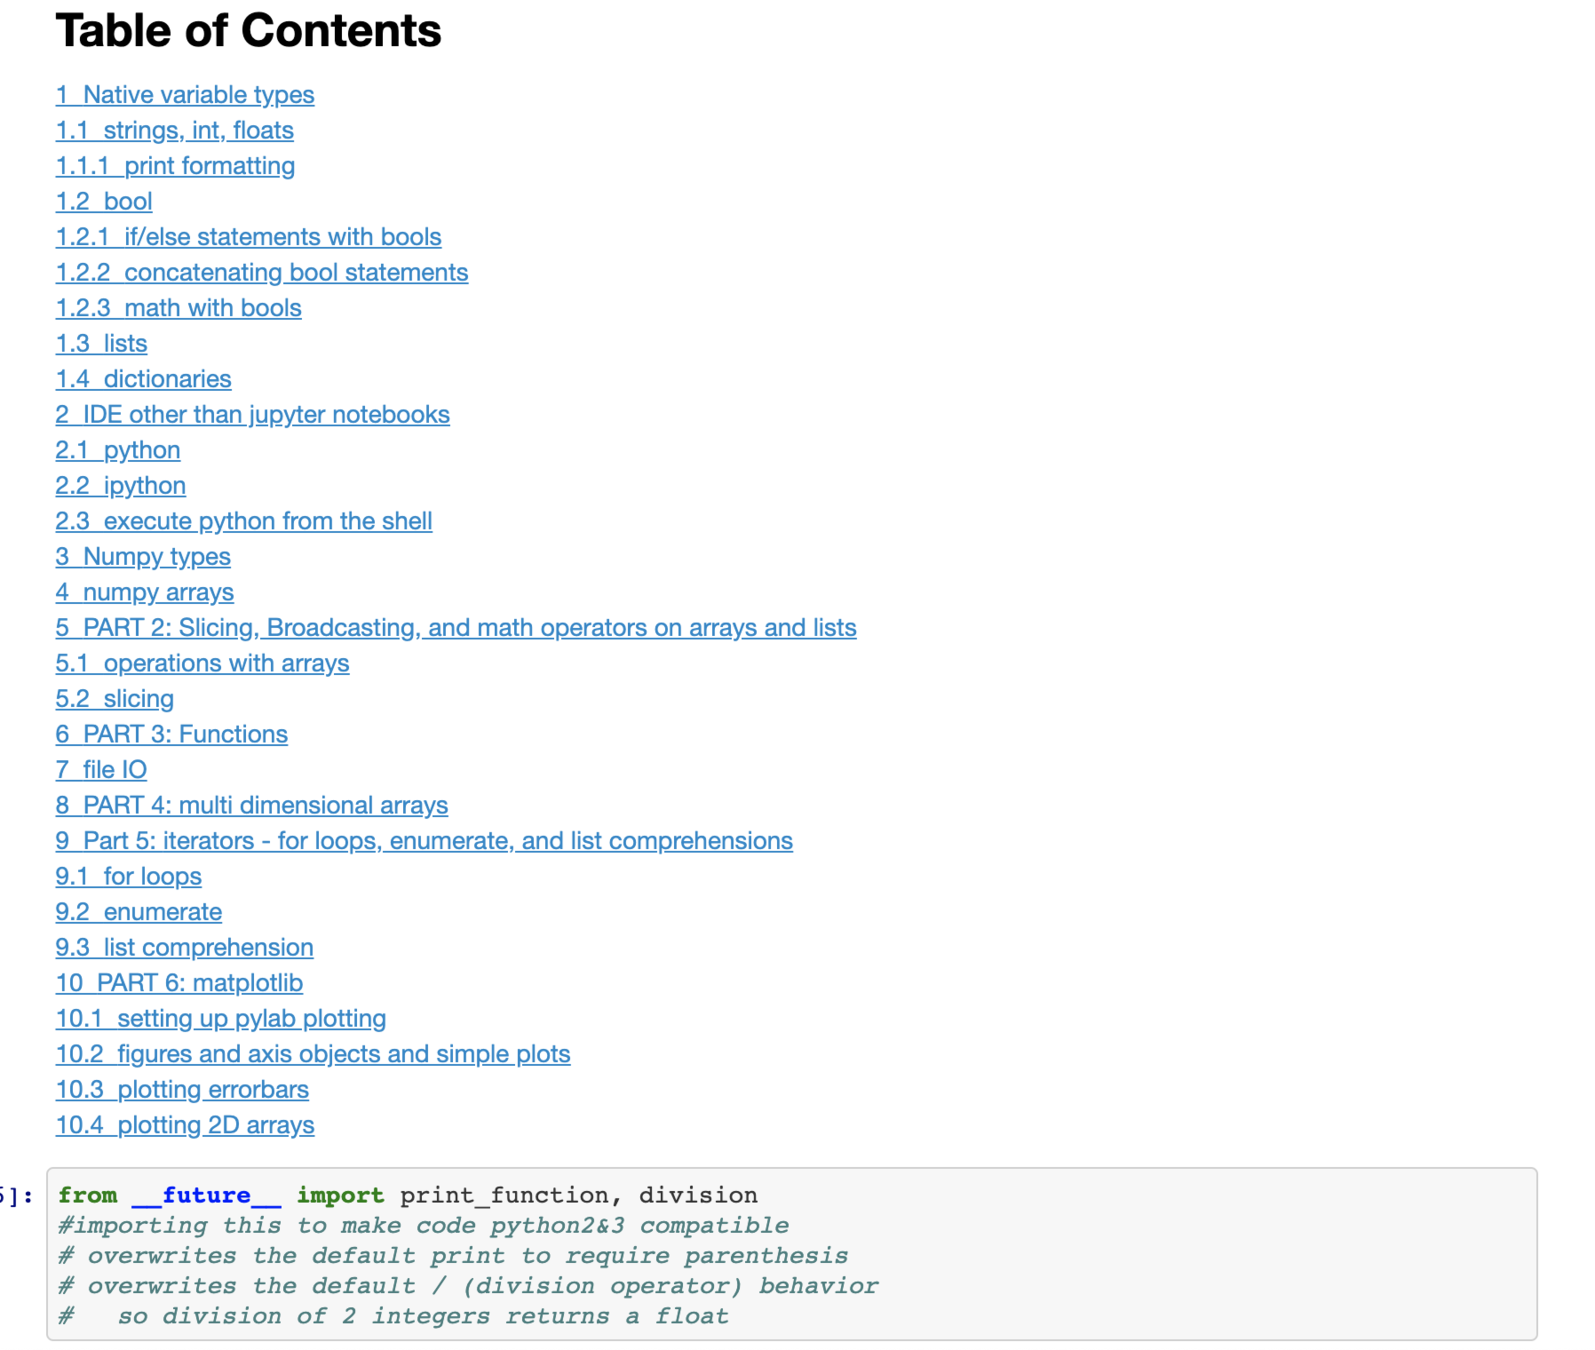
Slightly more comprehensive -
python bootcamp
If there is demand in a couple of weeks
I will run a live session going over this bootcamp
Resources: Notebook based
series of notebooks designed for Urban Science students by Dr. Mohit Sharma (in consultation with me)
recommanded if you are brand new to python and coding or are serious about cleaning up your foundamentals
Resources: Notebook based
Free series of videos on the Giraffe Academy
Resources: other
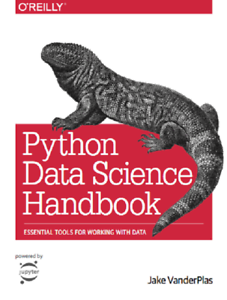
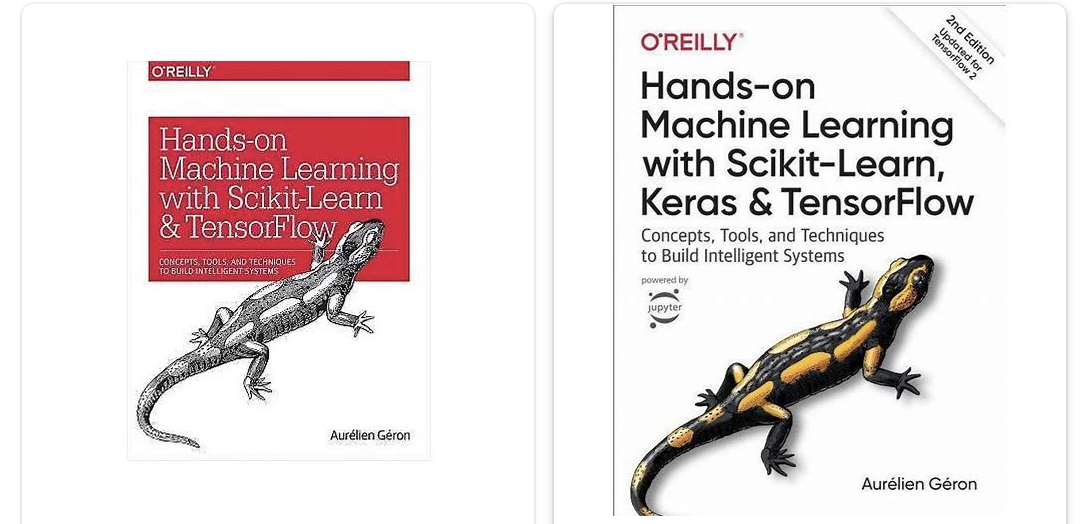
many books, on github you can find links to the PDFs... but we will do things a bit differently
Jake Vanderplas is a physicst-data scientists
https://www.academia.edu/40917232/Python_Data_Science_Handbook
PEP8: Python Enhancement Proposals 8
“This document gives coding conventions for the Python code comprising the standard library in the main Python distribution.”
Reproducible research means:
all numbers in a data analysis can be recalculated exactly (down to stochastic variables!) using the code and raw data provided by the analyst.
Claerbout, J. 1990,
Active Documents and Reproducible Results, Stanford Exploration Project Report, 67, 139
allows reproducibility through code distribution
the Git software
is a distributed version control system:
a version of the files on your local computer is made also available at a central server.
The history of the files is saved remotely so that any version (that was checked in) is retrievable.
allows version control
collaboration tool
by fork, fork and pull request, or by working directly as a collaborator
allows effective collaboration
you can ask coding questions, installation questions, colab questions...
you can ask coding questions, installation questions, colab questions...
you can ask coding questions, installation questions, colab questions...
it can be a toxic environment...
some administrative stuff (cont'd)
5% pre-class questions
15% class participation
25% homework
15% midterm
30% final
Homework projects must be turned in as jupyter notebooks by checking them into your github account in a DSPS_<firstinitialLastname> repo and the project directories HW<hw number> (unless otherwise stated). <finitialLastname> is e.g. fBianco
instructions
solution
homework are assigned as skeleton notebooks with missing code
You will have to insert the code to get the correct output
You should then discuss the results you got (e.g. comment on a plot
you will be graded on
(80% of the grade)
1) rendered plots (does it show what it should)
2) plot captions (can you interpret what it shows)
2) obtaining "correct" numbers where needed
3) interpreting each result you get
5% pre-class questions
15% class participation
25% homework
15% midterm
30% final
5% pre-class questions
15% class participation
25% homework
15% midterm
30% final
A statement must be included in the README explaining each team member’s contribution (similar to an acknowledge of contribution you would find in a Nature letter see, for example these contributions).
5% pre-class questions
15% class participation
25% homework
15% midterm
30% final
A statement must be included in the README explaining each team member’s contribution (similar to an acknowledge of contribution you would find in a Nature letter see, for example these contributions).
5% pre-class questions
15% class participation
25% homework
15% midterm
30% final
Each student must write a README file for their repository
(20% of the points)
in the readme you must state in your own words
instructions will be here
5% pre-class questions
15% class participation
25% homework
15% midterm
30% final
help: always available on slack!
please sign up asap by filling in the form!!
5% pre-class questions
15% class participation
25% homework
15% midterm
30% final
of course there is also Canvas, which will be used to give you grades and occasionally post messages
5% pre-class questions
15% class participation
25% homework
15% midterm
30% final
For the Midterm and the Final you are responsible for material in the labs, the reading, and the homework. In preparing for the exams, use the homework as a guide to which material is essential. In the Midterm and Final YOU WILL BE EXPECTED TO WORK INDIVIDUALLY.
Midterm... probably in class
advantages: interviews for jobs are often timed
issues: working under derass is not necessarily a required skill but that is why the midterm counts only 15%!
5% pre-class questions
15% class participation
25% homework
15% midterm
30% final
For the Midterm and the Final you are responsible for material in the labs, the reading, and the homework. In preparing for the exams, use the homework as a guide to which material is essential. In the Midterm and Final YOU WILL BE EXPECTED TO WORK INDIVIDUALLY.
Final: take home, multiple days.
5% pre-class questions
15% class participation
25% homework
15% midterm
30% final
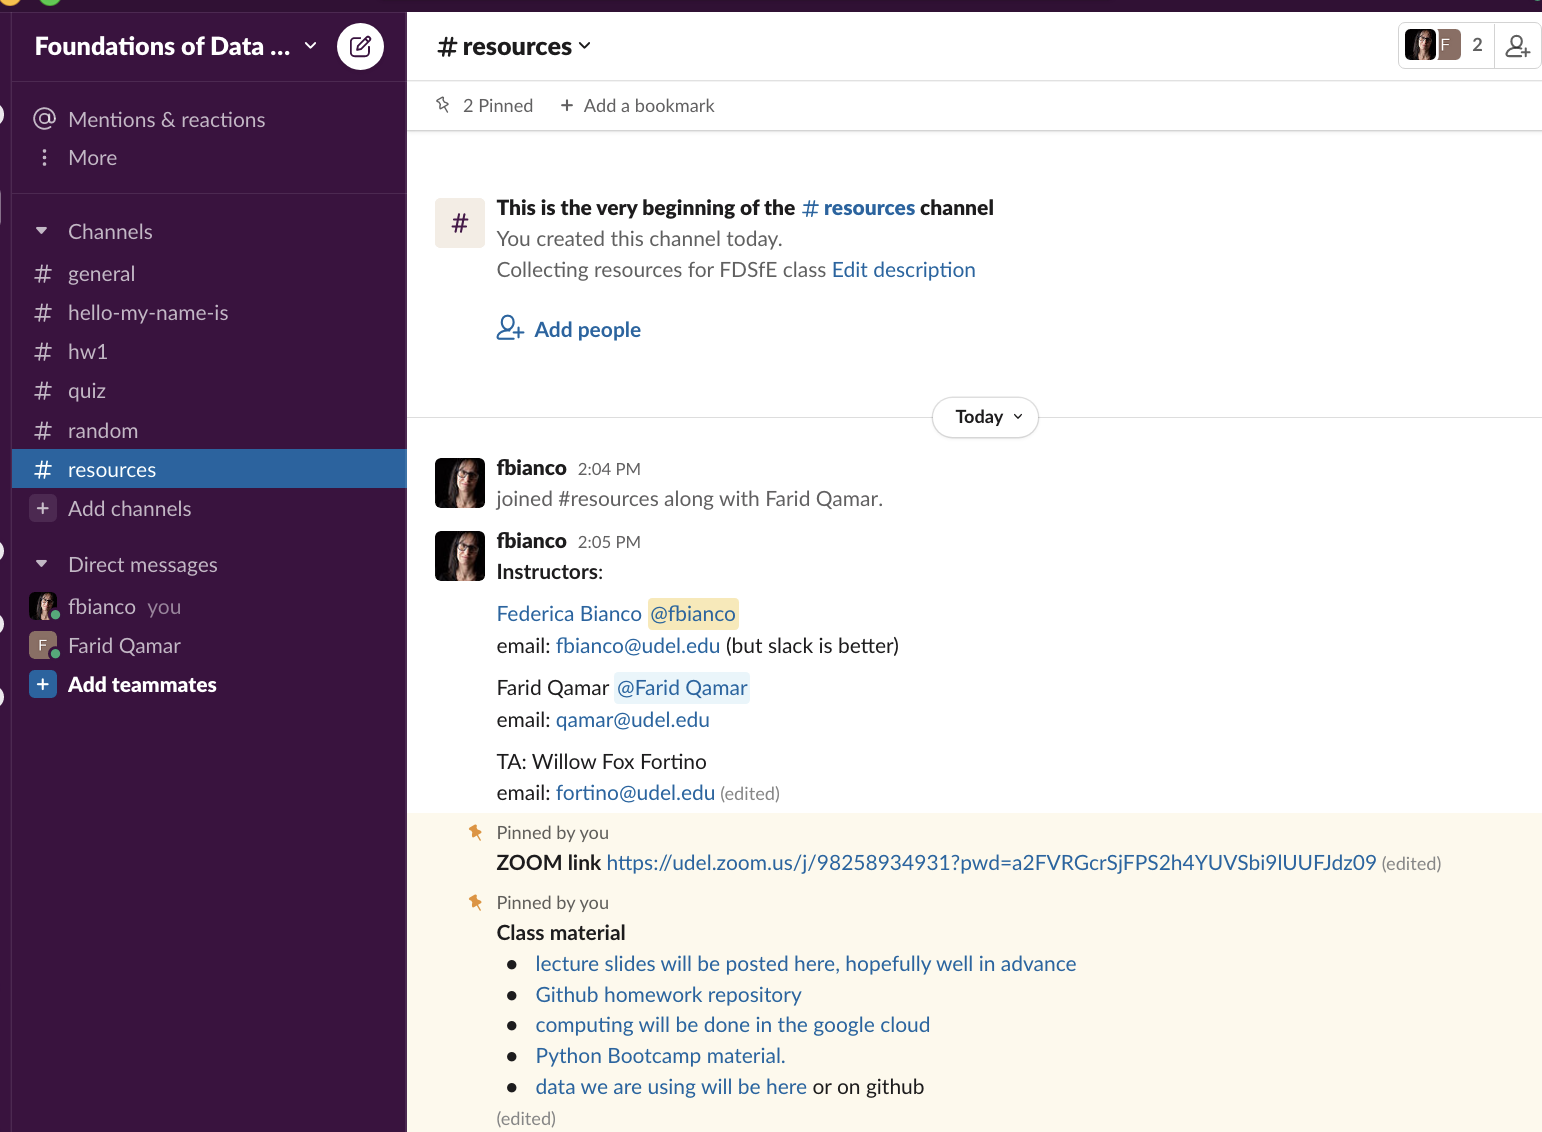
slack
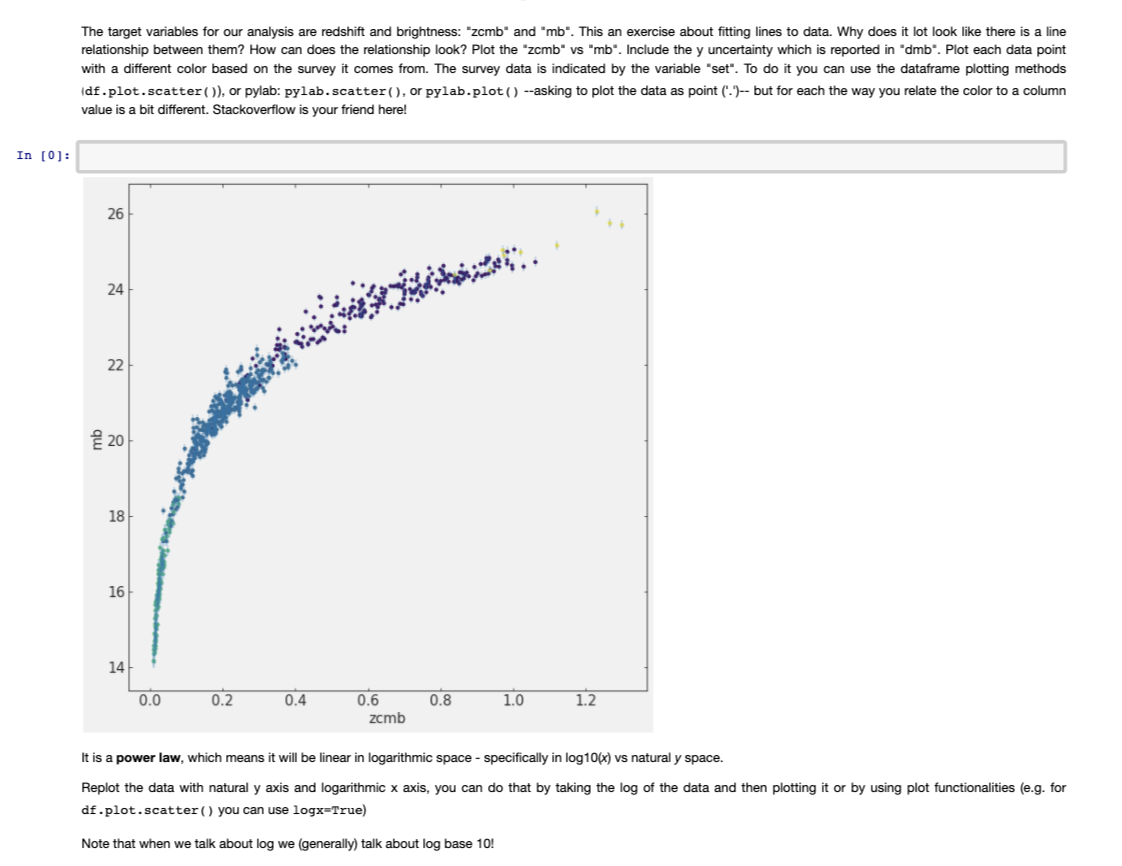
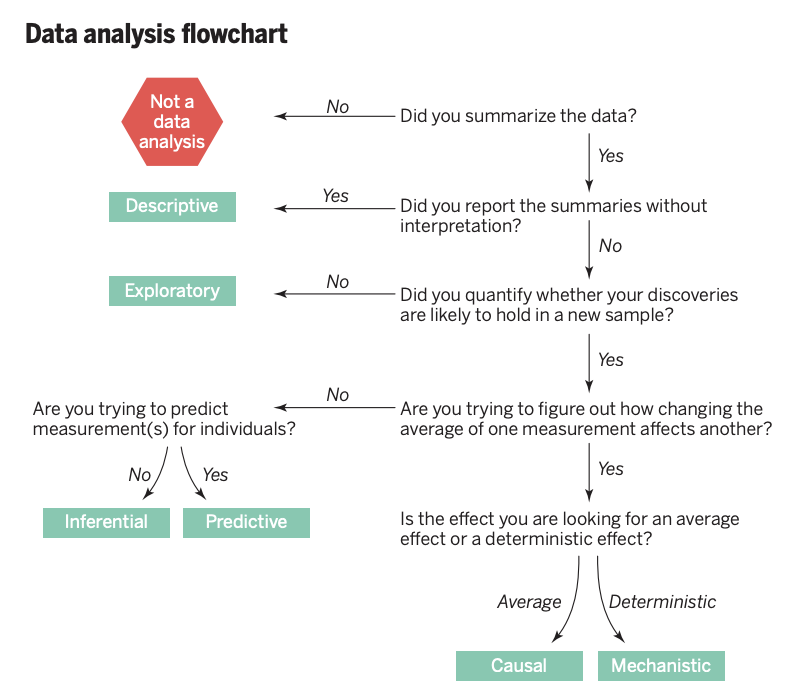
the steps of data-analysis and inference: descriptive and exploratory analysis
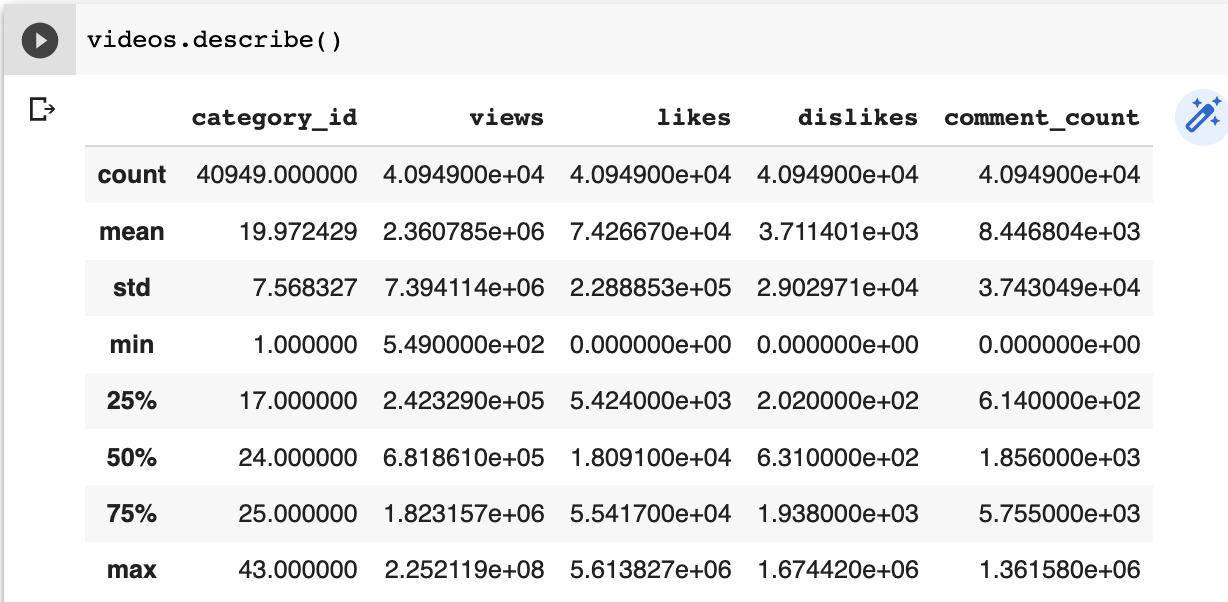
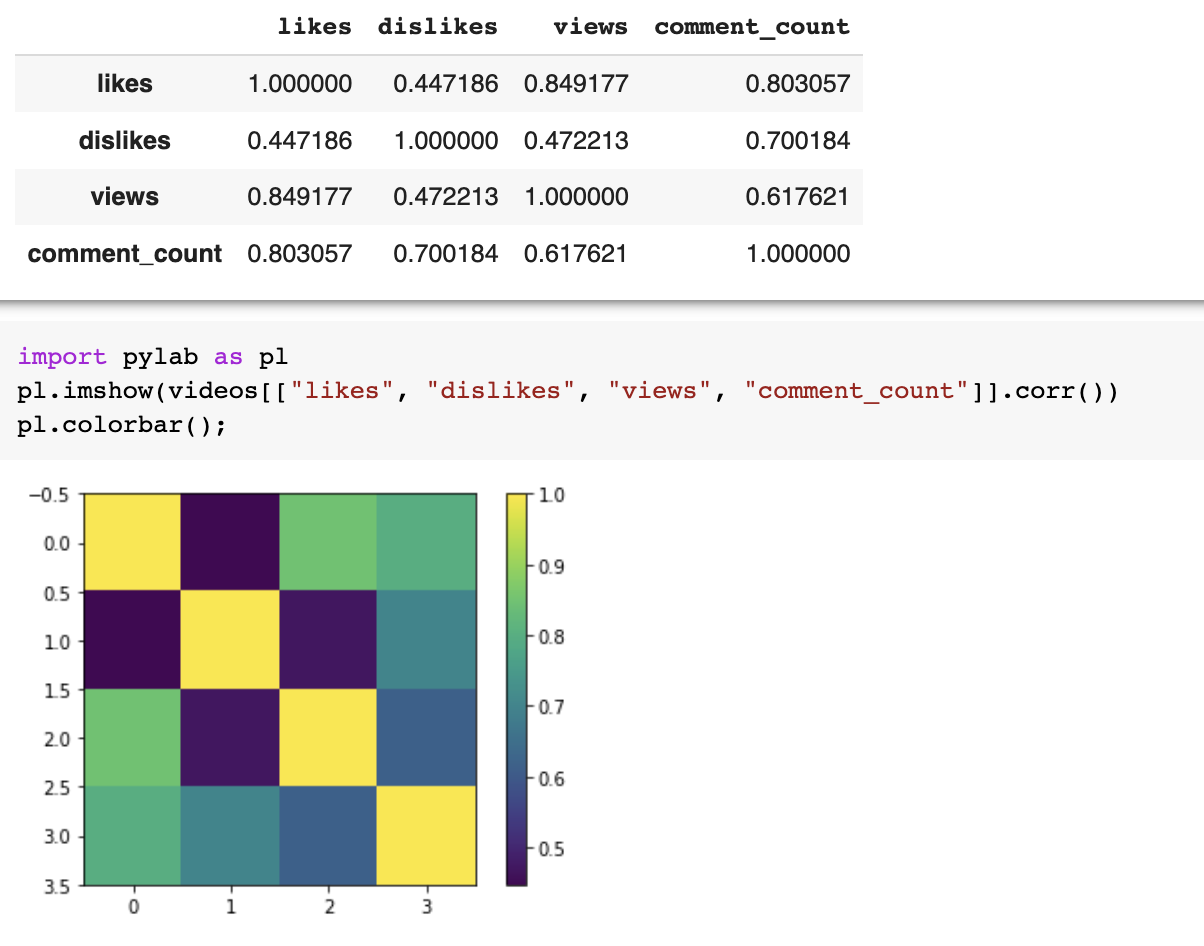
import pandas as pd
df = pd.read_csv(file_name)
df.describe()
- how is data organized
- is data complete?
- what are the statistical properties of the data
we will look at the statistical properties next week: mean, standard deviation, median, quantiles...
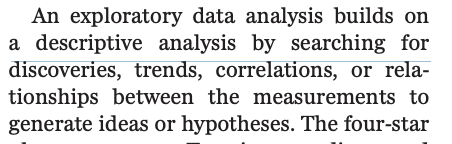
- searching for anomalies, trends, correlations, or relationships between the measurements
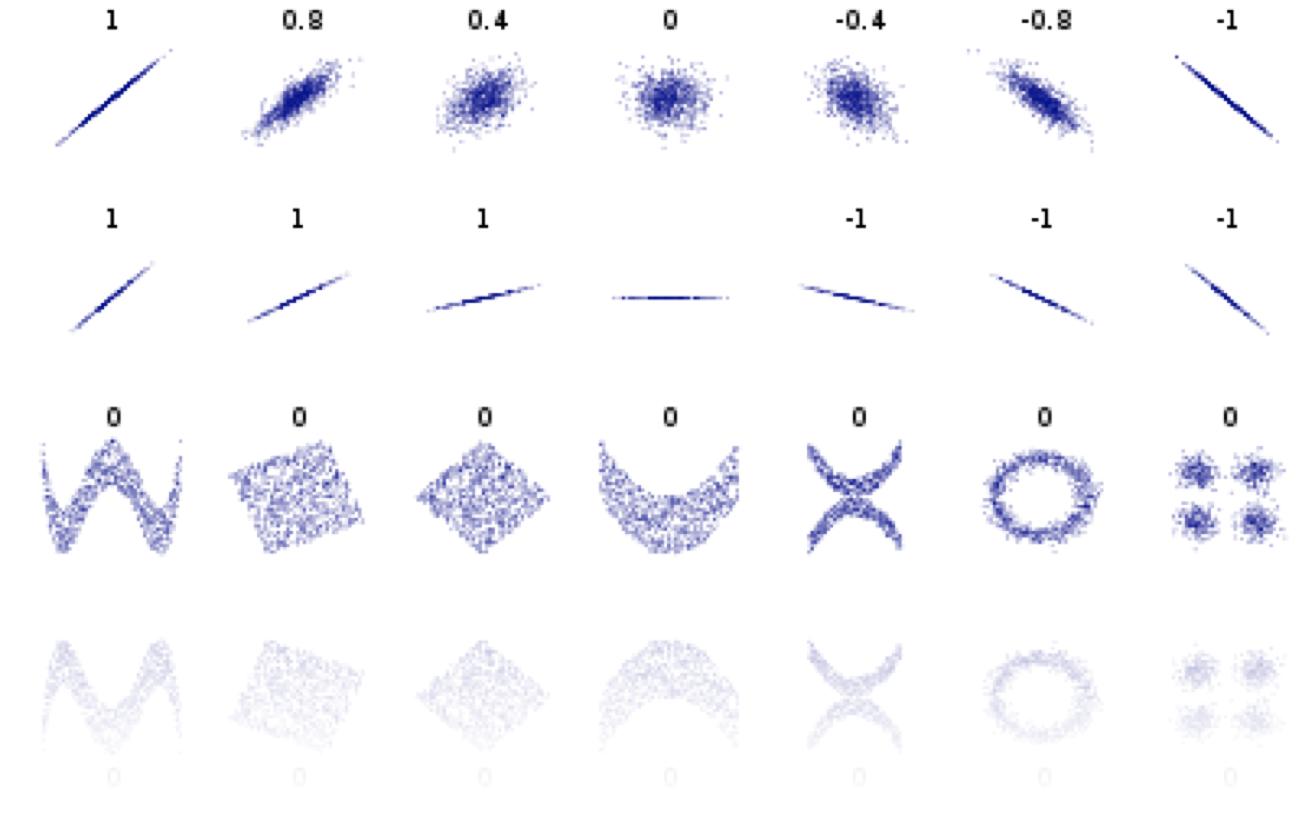
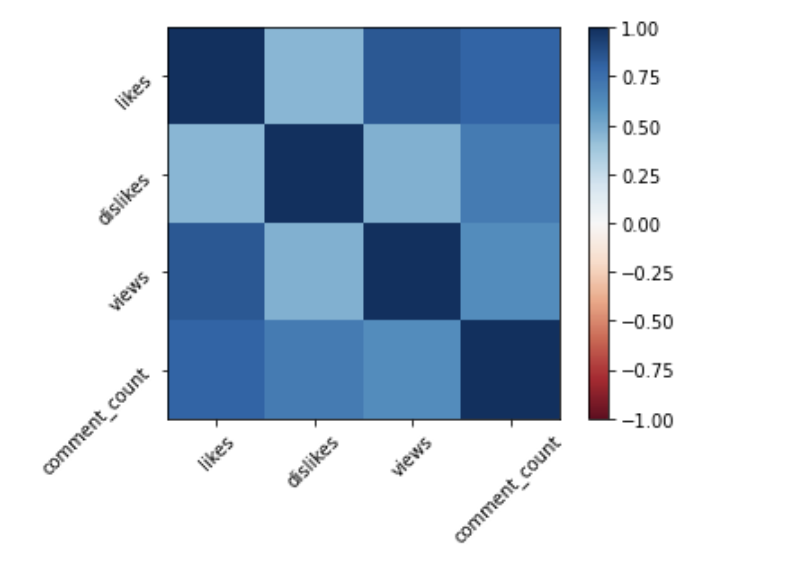
Pearson's correlation
Pearson's correlation measures linear correlation
Pearson's correlation
Pearson's correlation measures linear correlation
correlated
"positively" correlated
Pearson's correlation
Pearson's correlation measures linear correlation
correlated
"positively" correlated
Pearson's correlation
Pearson's correlation measures linear correlation
anticorrelated
"negatively" correlated
Pearson's correlation
Pearson's correlation measures linear correlation
anticorrelated
"negatively" correlated
Pearson's correlation
Pearson's correlation measures linear correlation
not linearly correlated
Pearson's coefficient = 0
does not mean that x and y are independent!
Pearson's correlation
Spearman's test
(Pearson's for ranked values)
Pearson's correlation
import pandas as pd
df = pd.read_csv(file_name)
df.corr()import pandas as pd
df = pd.read_csv(file_name)
df.corr()pl.imshow(vdf.corr(), clim=(-1,1), cmap='RdBu')
pl.xticks(list(range(len(df.corr()))),
df.columns, rotation=45)
pl.yticks(list(range(len(df.corr()))),
df.columns, rotation=45)
pl.colorbar();<- anticorrelated | correlated ->
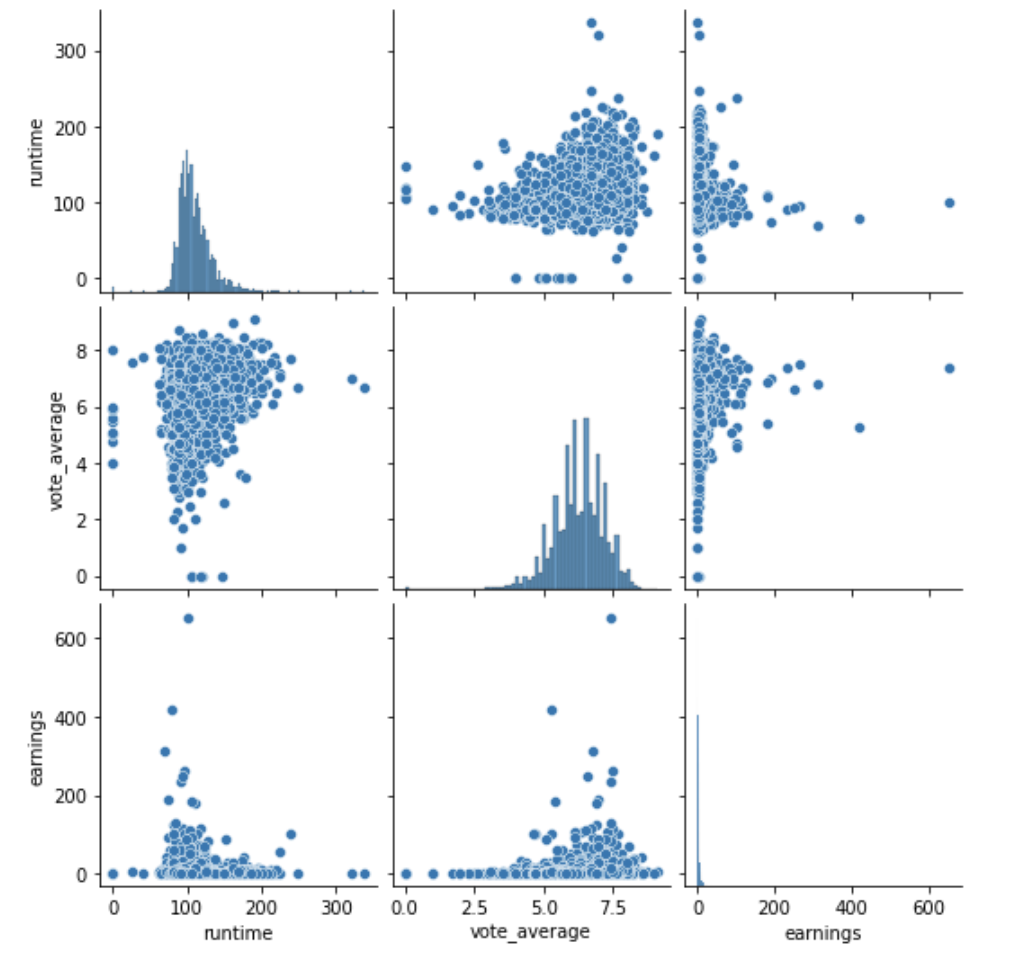
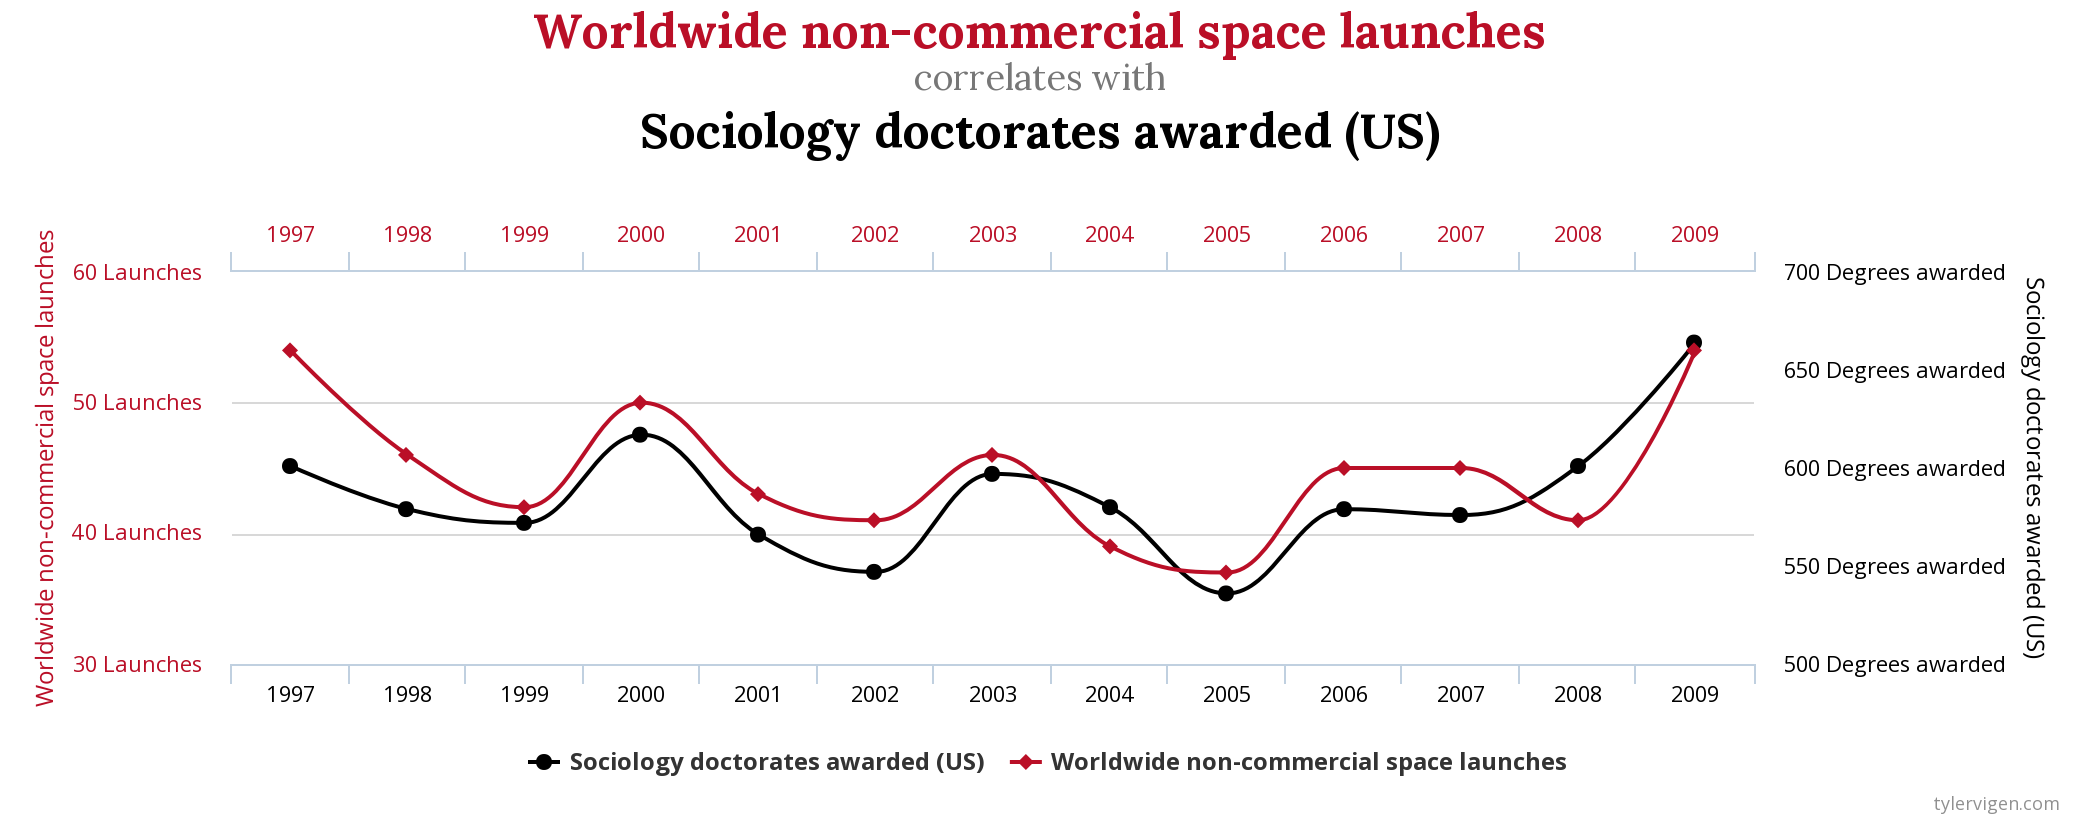
Correlation does not imply causality!!
2 things may be related because they share a cause but not cause each other:
icecream sales with temperature |death by drowning
with temperature
In the era of big data you may encounter truly spurious correlations
divorce rate in Maine | consumption of Margarine
the scientific method and good scientific practices part 1: Reproducibility
3 General principles of "good" science
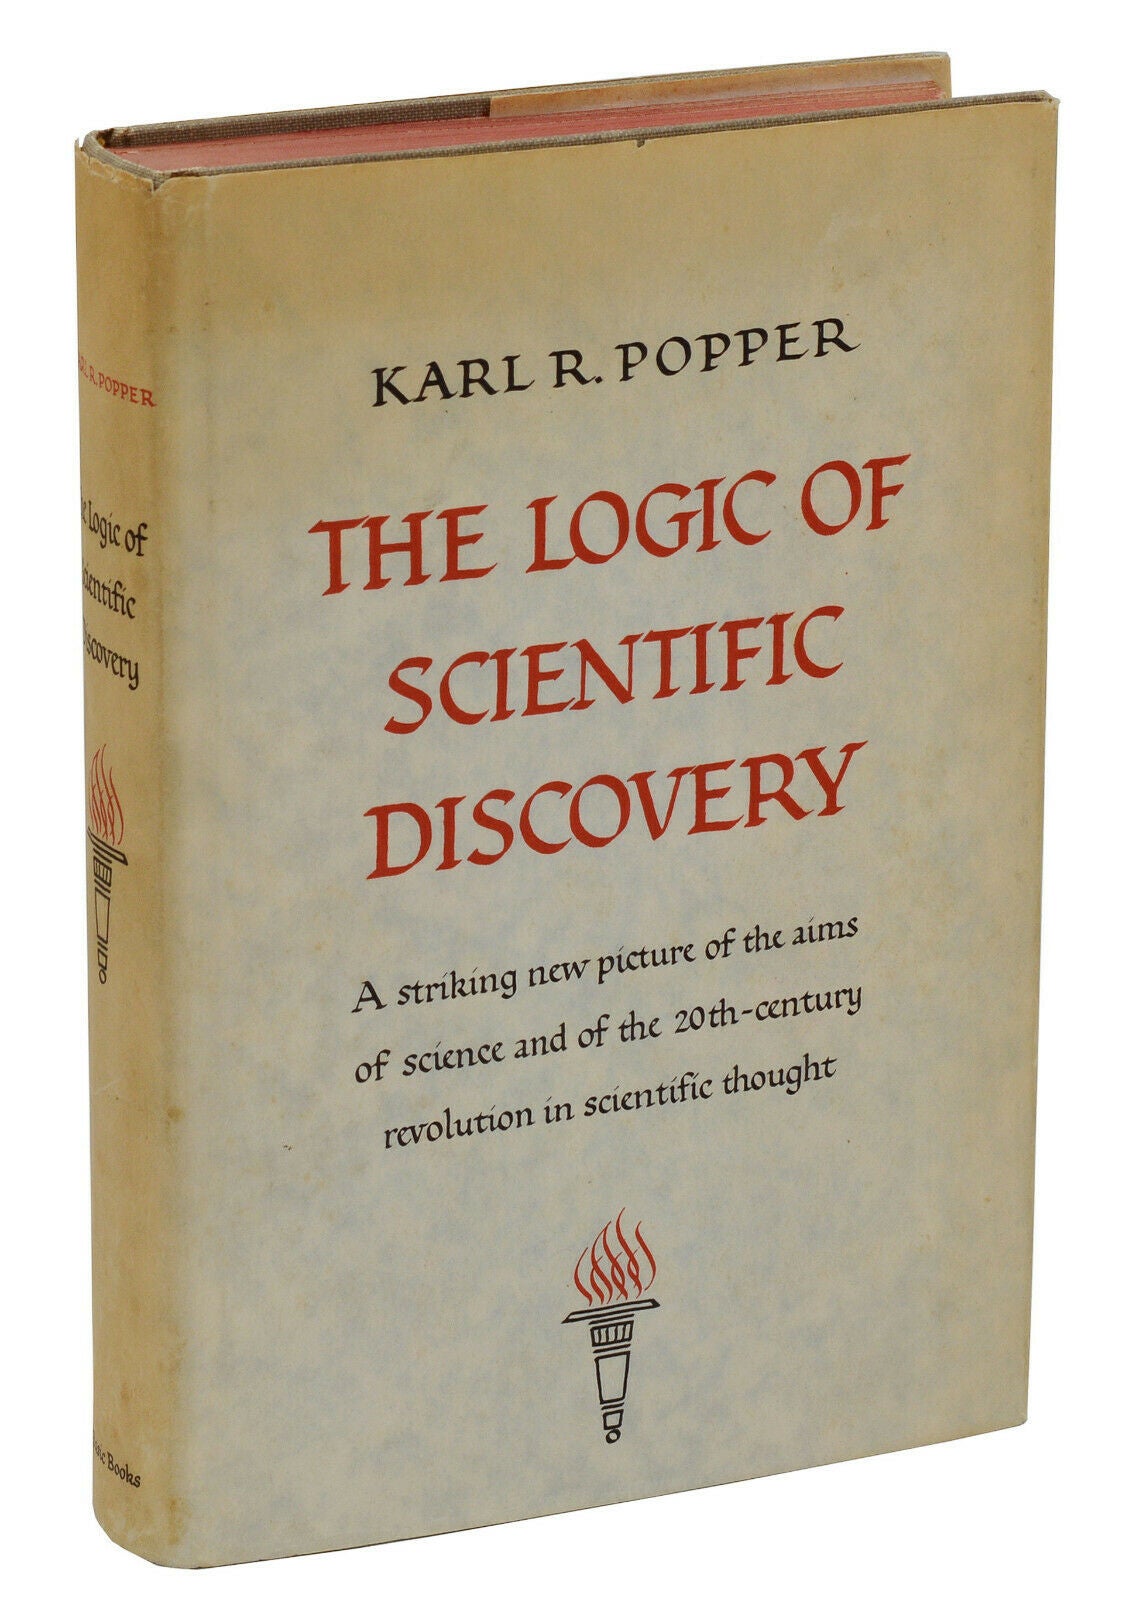
Falisifiability
Parsimony
Reproducibility
My proposal is based upon an asymmetry between verifiability and falsifiability; an asymmetry which results from the logical form of universal statements. For these are never derivable from singular statements, but can be contradicted by singular statements.
—Karl Popper, The Logic of Scientific Discovery
the demarcation problem:
what is science? what is not?
a scientific theory must be falsifiable
My proposal is based upon an asymmetry between verifiability and falsifiability; an asymmetry which results from the logical form of universal statements. For these are never derivable from singular statements, but can be contradicted by singular statements.
—Karl Popper, The Logic of Scientific Discovery
the demarcation problem:
what is science? what is not?
model
prediction
the demarcation problem
Einstein GR
the demarcation problem
model
prediction
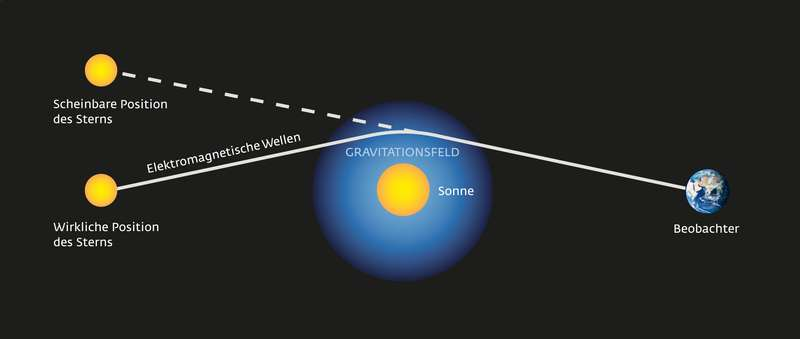
Light rays are deflected by mass
model
prediction
data
does not falsify
falsifies
GR
still holds
GR
rejected
the demarcation problem
position of star changes during eclipse
position of star does not change during eclipse
is phsychology a science?
the demarcation problem
DISCUSS!
the demarcation problem
things can get more complicated though:
most scientific theories are actually based largely on probabilistic induction and
modern inductive inference (Solomonoff, frequentist vs Bayesian methods...)
Reproducible research means:
the ability of a researcher to duplicate the results of a prior study using the same materials as were used by the original investigator. That is, a second researcher might use the same raw data to build the same analysis files and implement the same statistical analysis in an attempt to yield the same results.
assures a result is grounded in evidence
1
#openscience
#opendata
Reproducible research means:
the ability of a researcher to duplicate the results of a prior study using the same materials as were used by the original investigator. That is, a second researcher might use the same raw data to build the same analysis files and implement the same statistical analysis in an attempt to yield the same results.
facilitates scientific progress by avoiding the need to duplicate unoriginal research
2
Reproducible research means:
the ability of a researcher to duplicate the results of a prior study using the same materials as were used by the original investigator. That is, a second researcher might use the same raw data to build the same analysis files and implement the same statistical analysis in an attempt to yield the same results.
facilitate collaboration and teamwork
3
Reproducible research in practice:
using the code and raw data provided by the analyst.
Claerbout, J. 1990,
Active Documents and Reproducible Results, Stanford Exploration Project Report, 67, 139
Reproducible research means:
the ability of a researcher to duplicate the results of a prior study using the same materials as were used by the original investigator. That is, a second researcher might use the same raw data to build the same analysis files and implement the same statistical analysis in an attempt to yield the same results.
all numbers in a data analysis can be recalculated exactly (down to stochastic variables!)
Reproducible research means:
the ability of a researcher to duplicate the results of a prior study using the same materials as were used by the original investigator. That is, a second researcher might use the same raw data to build the same analysis files and implement the same statistical analysis in an attempt to yield the same results.
Reproducible research in practice:
using the code and raw data provided by the analyst.
all numbers in a data analysis can be recalculated exactly (down to stochastic variables!)
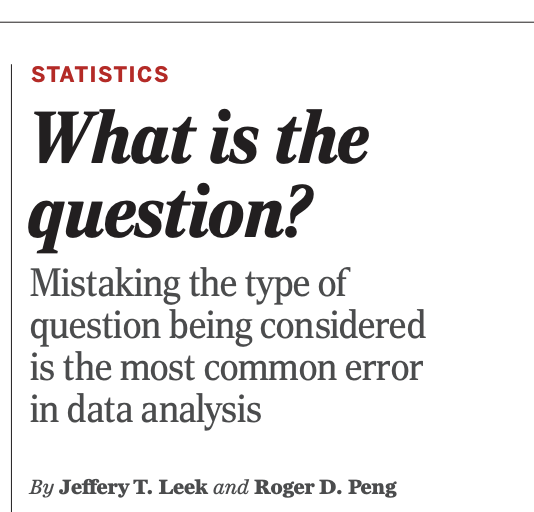
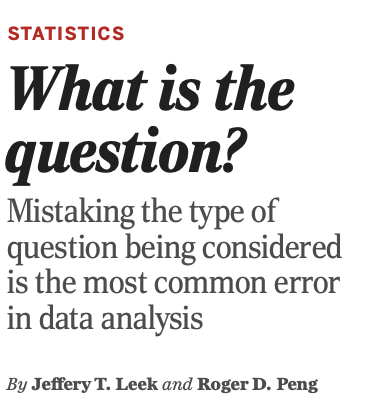
What is Data Science
Jeff Leek & Rodger Peng. 2015,
What is the Question?
the original link:
https://science.sciencemag.org/content/347/6228/1314.summary
(this link nees access to science magazine, but ou can use the link above which is the same file)
Claerbout, J. 1990,
Active Documents and Reproducible Results,
Stanford Exploration Project Report, 67, 139
http://sepwww.stanford.edu/data/media/public/docs/sep67/jon2/paper_html/
Text