Introduction to Volumetric image analysis using qim3d

Felipe Delestro
Senior Research Software Specialist @ QIM Center
Danmarks Tekniske Universitet (DTU)
fima@dtu.dk
QIM Center
Center for Quantification of Imaging Data from MAX IV


supported by


Rebecca
Engberg
Center Manager
Anders Bjorholm Dahl
Head of the QIM Center
Jon
Sporring
Deputy Head of the QIM Center


Volumetric data
≠
volumetric rendering
data is composed of voxels (3D pixels)
mesh rendering
data is made of vertices and faces
10x10x10
voxels
Z slices

X slices
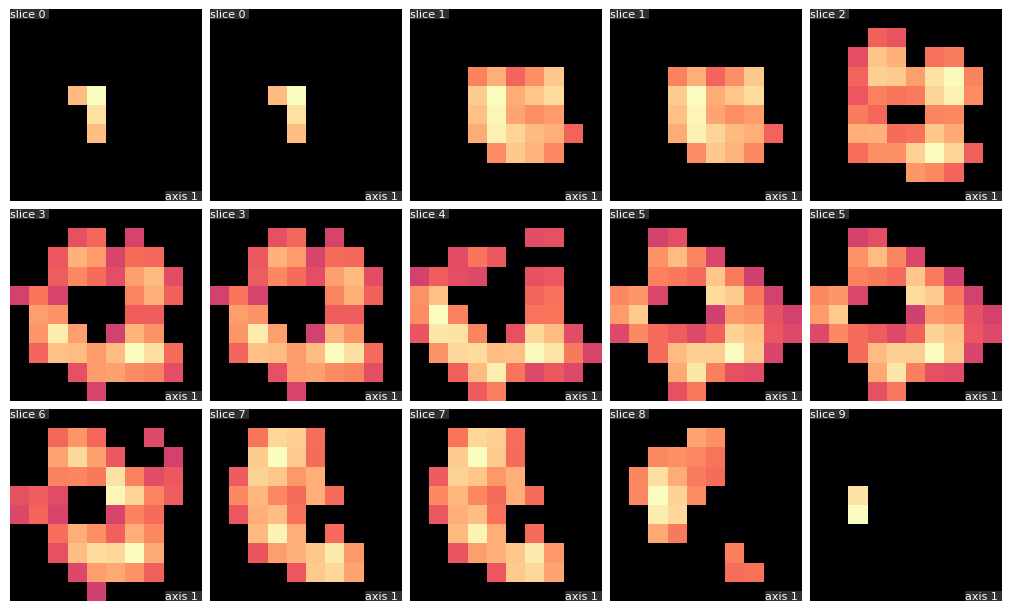
Image analys is different between 2D and 3D images
- Operations should be performed in 3D.
- Most tutorials and examples focus on 2D images.
- Dataset size could pose a challenge.
- Data visualization is more complex.
open-source Python library, that focuses on 3D volumetric data
Getting started is easy:
pip install qim3d

Documentation at platform.qim.dk/qim3d/
The library is grouped into few categories
🟢 Data handling
🟢 Stable and with lots of features
🟡 Functional but still under development
🔴 Early development stages
🟢 Visualization
🟡 Image analysis
🔴 Machine Learning
🟡 Graphical User Interfaces
🔴 Command Line Interface
Data handling
Volumetric data can be stored in a variety of file formats.
This can make the very first step of importing the data more complex than it should be
load and save
Data handling
Data handling
Volumetric data can be stored in a variety of file formats.
This can make the very first step of importing the data more complex than it should be
load and save
qim3d.io.load and qim3d.io.save can handle the most common data formats:
-
Tiff(including file stacks) HDF5-
TXRM/TXM/XRM NIfTI-
PIL(including file stacks) -
VOL/VGI DICOM
import qim3d

vol = qim3d.io.load("path/to/image.tif", virtual_stack=True)
Data handling
We make a distinction between load/save and import/export when the operation includes transformations to the data.
import and export
Currently we're implementing a 3D import/export following the OME-Zarr standard, which
uses chunked data with a
ulti-scales scheme.

Data handling
We have a repository of 3D volumetric data that can be freely used, and with qim3d they can be easily downloaded directly within python code
Downloader
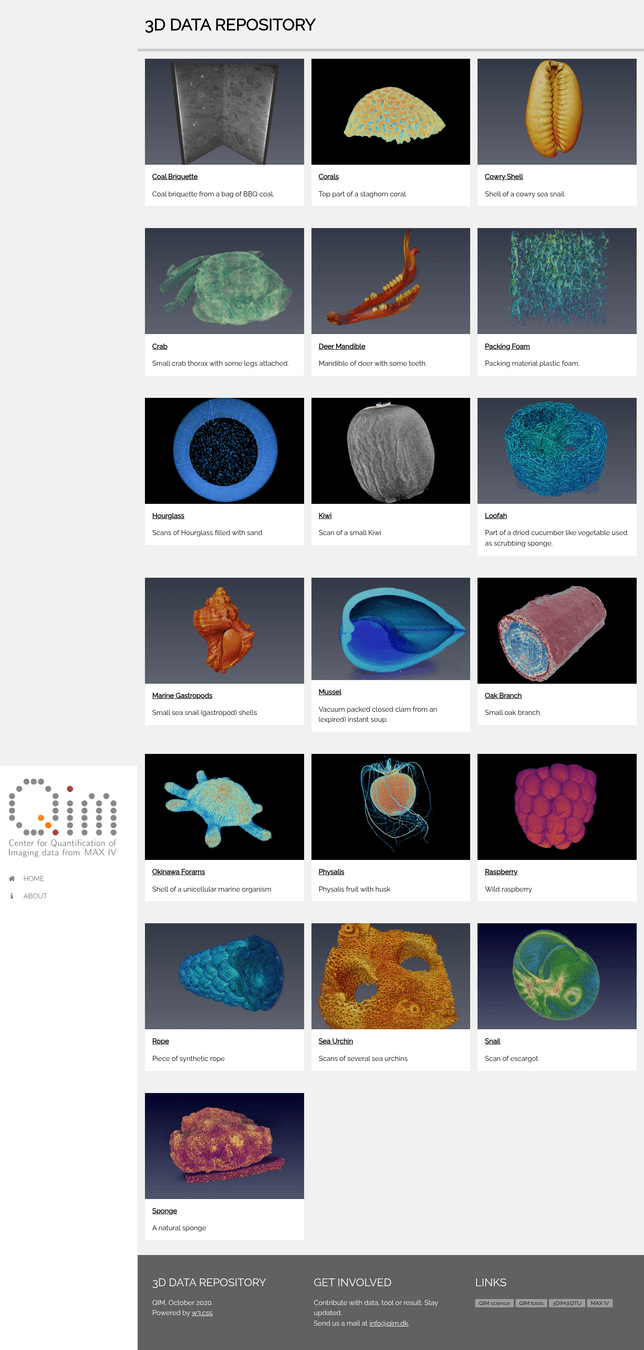
import qim3d

downloader = qim3d.io.Downloader()
data = downloader.Cowry_Shell.Cowry_DOWNSAMPLED(load_file=True)
Data handling
Generating synthetic volumetric data can be very helpful for method development, benchmarking or tutorials
Synthetic data
The function qim3d.generate.volume uses Perlin noise to generate a variety of complex volumes
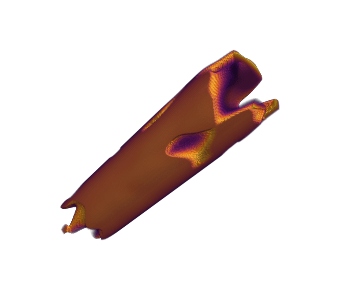
vol = qim3d.generate.volume(noise_scale = 0.015)vol = qim3d.generate.volume(base_shape = (200, 100, 100),
final_shape = (400, 100, 100),
noise_scale = 0.03,
gamma = 0.12,
threshold = 0.85,
object_shape = "tube"
)Data handling
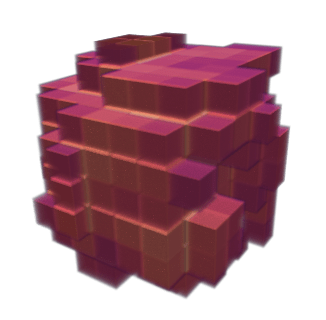
When using qim3d.generate.volume_collection we can generate groups of objects within the same volume, and also have their individual labels
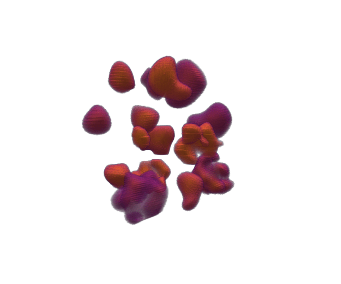


import qim3d

# Generate synthetic collection of objects
num_objects = 15
vol, labels = qim3d.generate.volume_collection(num_objects = num_objects)
vol
labels
Data handling
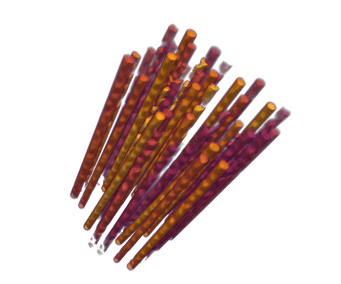
vol, labels = qim3d.generate.volume_collection(num_objects = 40,
                                        collection_shape = (300, 150, 150),
                                        min_shape = (280, 10, 10),
                                        max_shape = (290, 15, 15),
                                        min_object_noise = 0.08,
                                        max_object_noise = 0.09,
                                        max_rotation_degrees = 5,
                                        min_threshold = 0.7,
                                        max_threshold = 0.9,
                                        min_gamma = 0.10,
                                        max_gamma = 0.11,
                                        object_shape = "cylinder"
                                        )
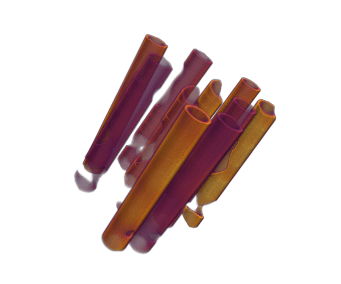
vol, labels = qim3d.generate.volume_collection(num_objects = 10,
                                        collection_shape = (200, 200, 200),
                                        min_shape = (180, 25, 25),
                                        max_shape = (190, 35, 35),
                                        min_object_noise = 0.02,
                                        max_object_noise = 0.03,
                                        max_rotation_degrees = 5,
                                        min_threshold = 0.7,
                                        max_threshold = 0.9,
                                        min_gamma = 0.10,
                                        max_gamma = 0.11,
                                        object_shape = "tube"
                                        )
Visualization
Visualization
Easily exploring volumetric data may not be so straightforward. The library provides helper functions this task simple and easy, even within Jupyter Notebooks
import qim3d

vol = qim3d.examples.bone_128x128x128
qim3d.viz.slicer(vol)
Visualization
import qim3d

vol = qim3d.examples.shell_225x128x128
qim3d.viz.slices_grid(vol, num_slices=15)
Visualization
import qim3d

vol = qim3d.examples.cement_128x128x128
binary = qim3d.filters.gaussian(vol, sigma = 2) < 60
labeled_volume, num_labels = qim3d.segmentation.watershed(binary)

color_map = qim3d.viz.colormaps.segmentation(num_labels, style = 'bright')
qim3d.viz.slicer(labeled_volume, slice_axis = 1, color_map=color_map)
qim3d.viz.colormaps.segmentation creates an colormap designes specifically for segmentation tasks
The parameter min_dist allows us to control how different neighbour colors are
Visualization
import qim3d

# Generate synthetic collection of objects
num_objects = 15
vol, labels = qim3d.generate.volume_collection(num_objects = num_objects)
# Visualize synthetic collection
qim3d.viz.volumetric(vol)Visualization
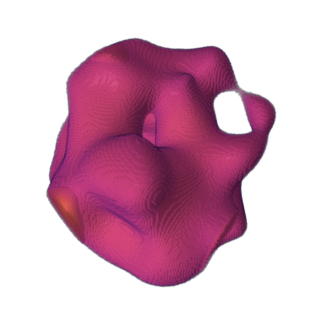
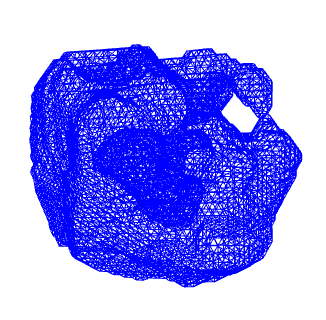
import qim3d

vol = qim3d.generate.volume(base_shape=(128,128,128),
                          final_shape=(128,128,128),
                          noise_scale=0.03,
                          order=1,
                          gamma=1,
                          max_value=255,
                          threshold=0.5,
                          dtype='uint8'
                          )

mesh = qim3d.mesh.from_volume(vol, step_size=3)
qim3d.viz.mesh(mesh.vertices, mesh.faces)Visualization
Visualization for OME-Zarr datasets is more challenging, but very important for large volumes
The qim3d library integrates with the itk-vtk-viewer, that can be launched locally from the command line
Visualization
Exploring chunks from a OME-Zarr dataset is also possible directly on a Jupyter notebook
import qim3d

# Download dataset
downloader = qim3d.io.Downloader()
data = downloader.Snail.Escargot(load_file=True)

# Export as OME-Zarr
qim3d.io.export_ome_zarr("Escargot.zarr", data, chunk_size=100, downsample_rate=2, replace=True)
# Explore chunks
qim3d.viz.chunks("Escargot.zarr")Image analysis
Image analysis
The goal of qim3d is to cover form basic functionalities that can serve as building blocks for more complex pipelines, up to implementation or wrappers for more complex methods
This will allow the library to be a central point for building pipelines for processing volumetric data
Image analysis
qim3d.filters contains implementations for common filter operations, including the option to run them on chunked data using Dask
qim3d.filters.Pipeline allows the creation of classes that act as filter pipelines
import qim3d
from qim3d.filters import Pipeline, Median, Gaussian, Maximum, Minimum

# Get data
vol = qim3d.examples.fly_150x256x256

# Show original
fig1 = qim3d.viz.slices_grid(vol, num_slices=5, display_figure=True)
# Create filter pipeline
pipeline = Pipeline(
    Median(size=5),
    Gaussian(sigma=3, dask = True)
)

# Append a third filter to the pipeline
pipeline.append(Maximum(size=3))

# Apply filter pipeline
vol_filtered = pipeline(vol)

# Show filtered
fig2 = qim3d.viz.slices_grid(vol_filtered, num_slices=5, display_figure=True)
Image analysis
The modules qim3d.detection and qim3d.segmentation contain wrappers for common methods that are useful when building larger pipelines
import qim3d

# Get data
vol = qim3d.examples.cement_128x128x128
vol_blurred = qim3d.filters.gaussian(vol, sigma=2)

# Detect blobs, and get binary_volume
blobs, binary_volume = qim3d.detection.blobs(
    vol_blurred,
    min_sigma=1,
    max_sigma=8,
    threshold=0.001,
    overlap=0.1,
    background="bright"
    )

# Visualize detected blobs
qim3d.viz.circles(blobs, vol, alpha=0.8, color='blue')
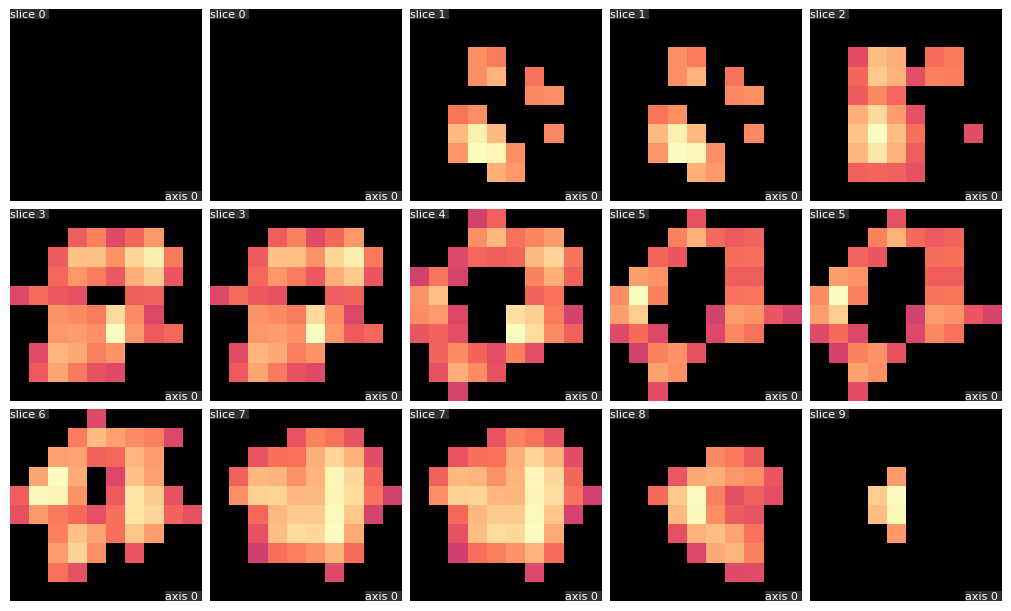
Image analysis
The modules qim3d.detection and qim3d.segmentation contain wrappers for common methods that are useful when building larger pipelines
import qim3d

vol = qim3d.examples.cement_128x128x128
bin_vol = qim3d.filters.gaussian(vol, sigma = 2)<60

fig1 = qim3d.viz.slices_grid(bin_vol, slice_axis=1, display_figure=True)
labeled_volume, num_labels = qim3d.segmentation.watershed(bin_vol)
cmap = qim3d.viz.colormaps.segmentation(num_labels)
fig2 = qim3d.viz.slices_grid(labeled_volume, slice_axis=1, color_map=cmap, display_figure=True)

Image analysis
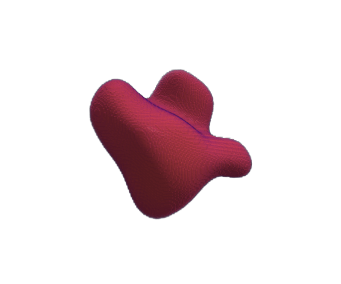
qim3d.operations gathers image analysis operations that perform more specific tasks. For example, here we use fade_mask to remove artifacts form the edge of a dataset
import qim3d
vol = qim3d.io.load('heartScan.tif')
qim3d.viz.volumetric(vol)
vol_faded = qim3d.operations.fade_mask(vol, decay_rate=4, ratio=0.45, geometric='cylindrical')
qim3d.viz.volumetrics(vol_faded)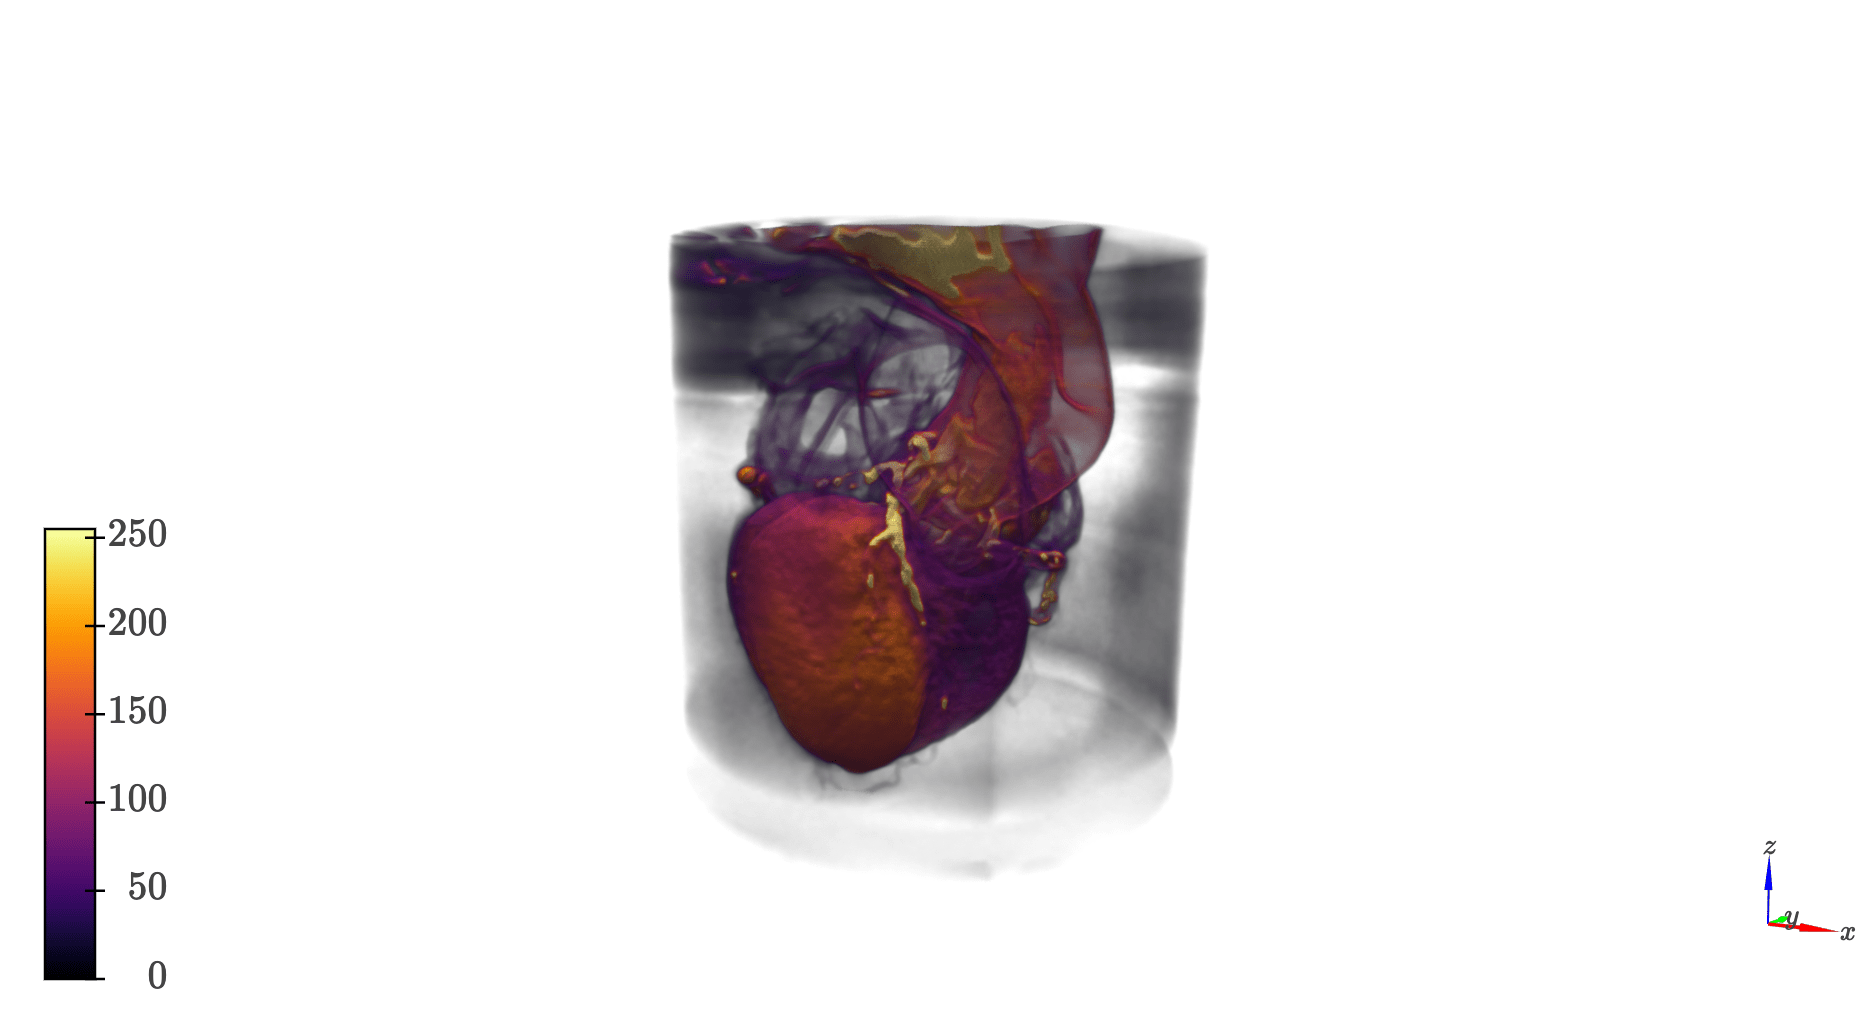
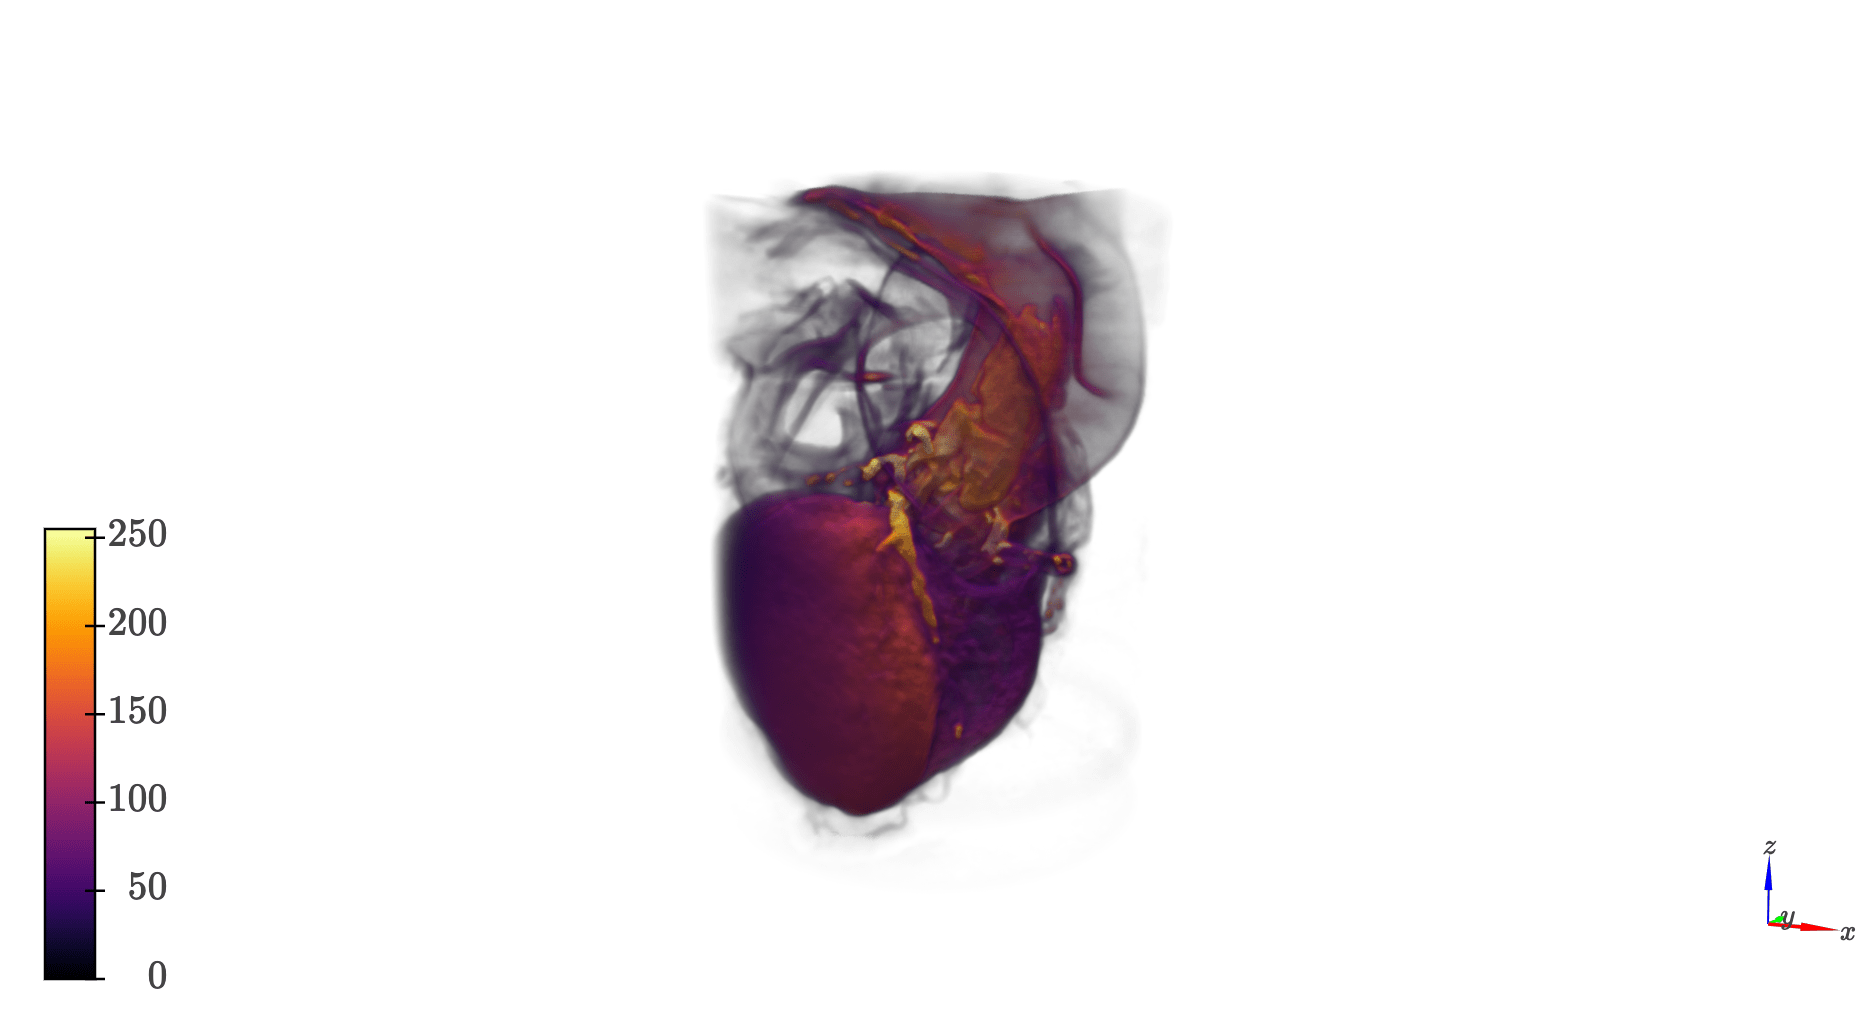
Image analysis
qim3d.processing is meant for more complex methods, that perform quantification tasks that are specific but common for volumetric data
The current implementations are:
- qim3d.processing.structure_tensor
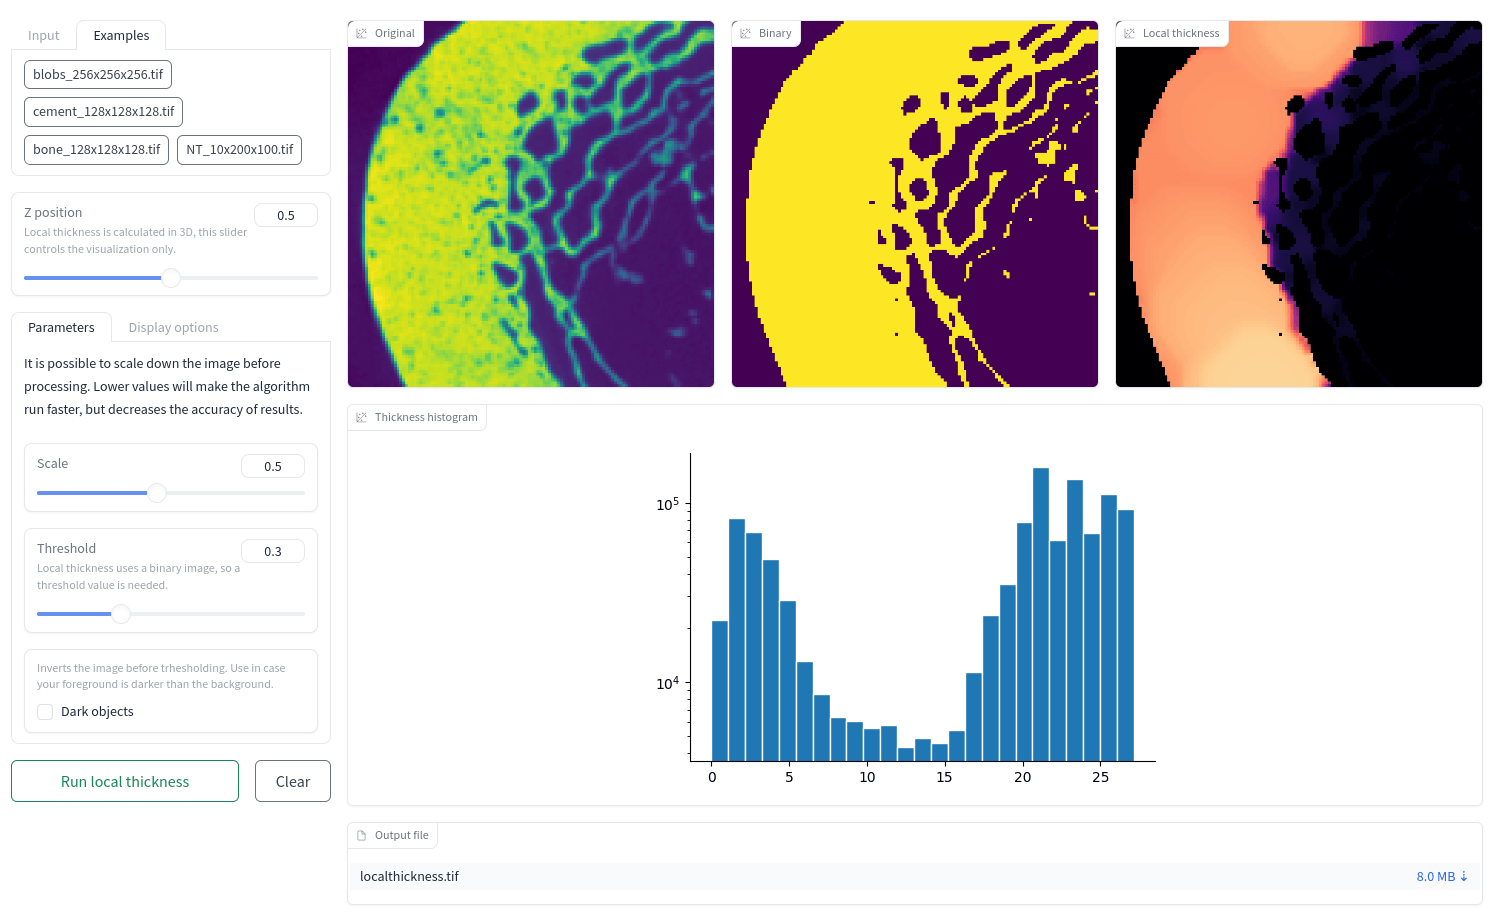
- qim3d.processing.local_thickness
Image analysis
Structure tensor
import qim3d

vol = qim3d.examples.NT_128x128x128
val, vec = qim3d.processing.structure_tensor(vol, visualize=True, axis=2)
Image analysis
Local thickness
import qim3d

vol = qim3d.examples.fly_150x256x256
lt_vol = qim3d.processing.local_thickness(vol, visualize=True, axis=0)
Machine learning
Machine learning
This module is still in the early stages of development, but our goal is to have a set of tools that can streamline the implementation of ML & DL pipelines for volumetric data
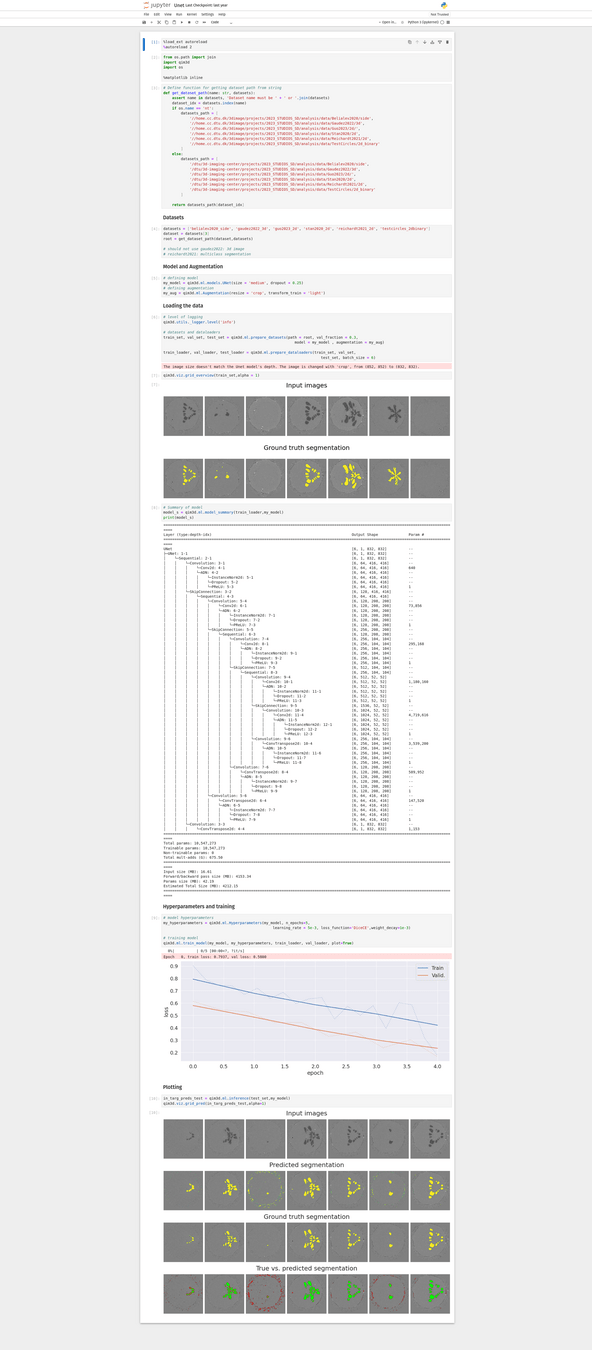
For example, currently, there are a few helper functions for setting DL archtechtures
# Make an Unet
my_model = qim3d.ml.models.UNet(size = 'medium', dropout = 0.25)

# Set augmentations
my_aug = qim3d.ml.Augmentation(resize = 'crop', transform_train = 'light')

# Set hyperparameters
my_hyperparameters = qim3d.ml.Hyperparameters(my_model, n_epochs=5, learning_rate = 5e-3,
                                              loss_function='DiceCE',weight_decay=1e-3)

# training model
qim3d.ml.train_model(my_model, my_hyperparameters, train_loader, val_loader, plot=True)
Graphical User interfaces
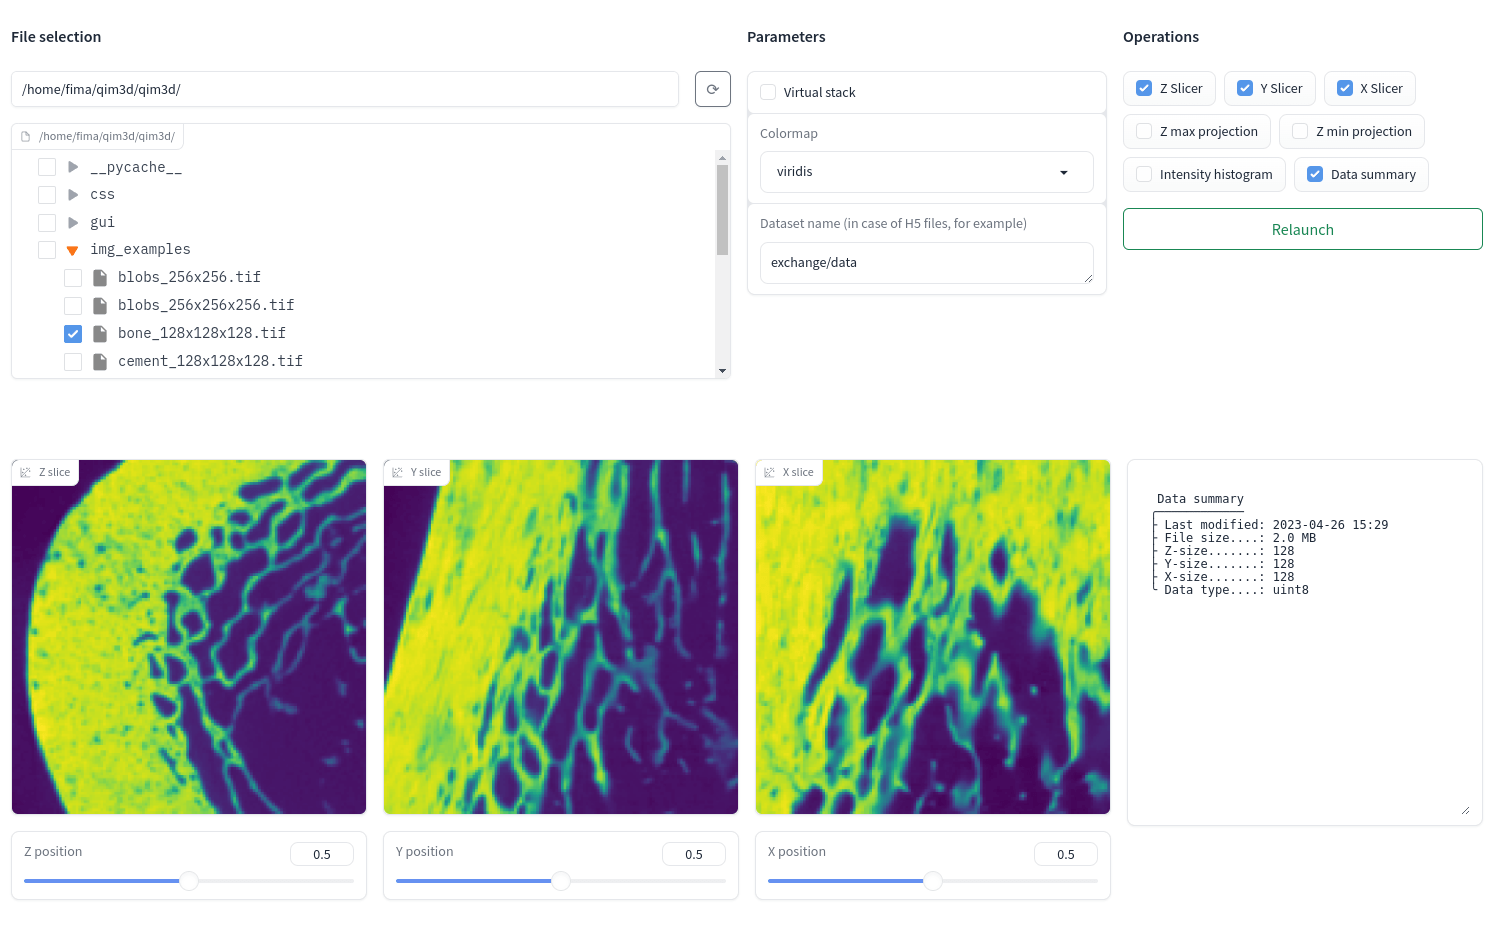
Graphical User interfaces
We use gradio for the development of GUIs that can easily be run on the browser as web apps.
This approach allows the versatility of for example having interfaces running on a HPC cluster, and having only the front end exposed to the user
&

Graphical User interfaces
Graphical User interfaces
Graphical User interfaces
import qim3d

vol = qim3d.examples.NT_128x128x128
annotation_tool = qim3d.gui.annotation_tool.Interface()

# We can directly pass the image we loaded to the interface
app = annotation_tool.launch(vol[0])
Command line interface
Command line interface

Command line interface
fima@pop-os ~ $ qim3d viz Okinawa_Foram_1.zarr/


itk-vtk-viewer
=> Serving /home/fima/Notebooks/Qim3d on port 3000

    enp0s31f6 => http://10.52.0.158:3000/
    wlp0s20f3 => http://10.197.104.229:3000/

Serving directory '/home/fima/Notebooks/Qim3d'
http://localhost:8042/

Visualization url:
http://localhost:3000/?rotate=false&fileToLoad=http://localhost:8042/Okinawa_Foram_1.zarr
The library is an open-source project, and you're all welcome to contribute!
documentation and
installation instructions:
Practical session notes
conda create -n qim3d python=3.11
conda activate qim3d
pip install qim3d
test by running qim3d on the terminal, or pip show qim3d
pip install jupyterInstall jupyter
documentation for qim3d: platform.qim.dk/qim3d/