Mapeando fenología
desde el cielo
Teledetectando con Python:
Procesamiento de imágenes satélite y seguimiento fenológico


About me
- Licenciado en Geografía (UGR)
- Experto en SIG (UNIA)
- Máster en Ordenación del Territorio (US)
- Doctorando en fenología (UHU)
- Ligado laboralmente a Doñana desde 2008

Paro
END
EBD
Trabajo
Digdgeo


@mopayyo
GIS & Remote Sensing
About my job
Laboratorio de SIG Y Teledetección
Estación Biológica de Doñana


- Acceso a Servicios Web Mapping
- Asistencia científica en SIG y Teledetección
- Asistencia equipamiento tecnológico (GPS, radiometría, etc...)
- Cursos y formación
- Proyectos científicos propios
- Programa de seguimiento Doñana


Javier Bustamante Díaz
Responsable científico
(Investigador Científico)
Ricardo Díaz-Delgado Hernández
Dr. Biología
Isabel Afán Asencio
Responsable Técnico
Dra. Biología
David Aragonés Borrego
Ingeniero Forestal
Diego García Díaz
Geógrafo
About my job


About my job

https://github.com/LAST-EBD
Teledetección

- Hay casi 6.000 satélites orbitando alrededor de la tierra.
- Un 60% inactivos y convertidos en basura espacial
- ~ 2400 satélites activos
- Distintos tipos de sensores
- Distintos tipos de niveles de procesado
GIS&Beers


Teledetección (Resoluciones)


Espectral
Espacial


Temporal

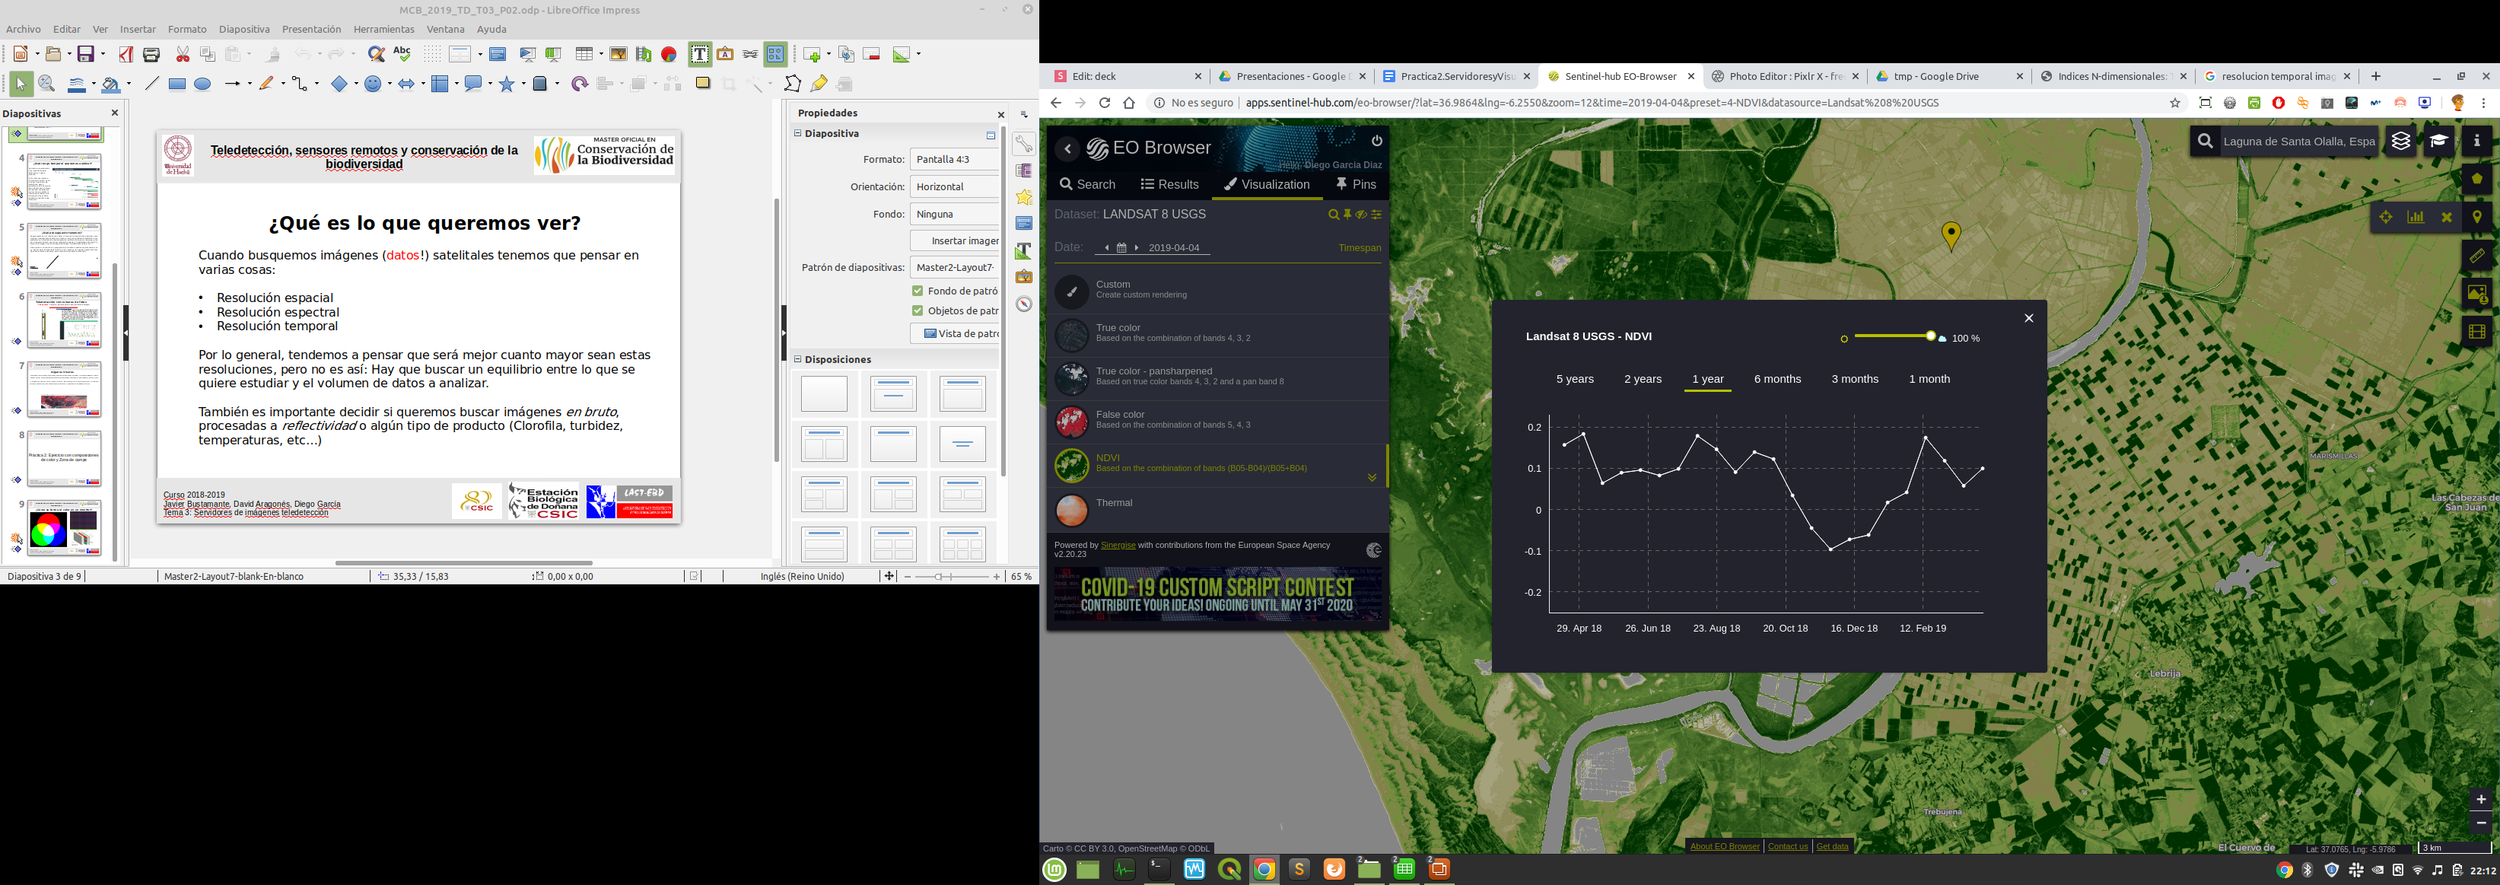
Teledetección (NDVI y Descarga)
Satellite image = Data!
| 2 | 5 | 8 | 6 | 7 |
|---|---|---|---|---|
| 8 | 7 | 5 | 6 | 3 |
| 0 | 0 | 0 | 0 | 1 |
| 2 | 2 | 3 | 0 | 0 |
| 4 | 4 | 8 | 2 | 5 |
1. Earth Explorer (USGS)
https://earthexplorer.usgs.gov/
2.. SciHub (ESA)
https://scihub.copernicus.eu/
3. EO Browser (ESA)
http://apps.sentinel-hub.com/eo-browser/
4. Land Viewer (EOS)
https://lv.eosda.com/
| 2 | 5 | 8 | 6 | 0 |
|---|---|---|---|---|
| 8 | 7 | 5 | 6 | 3 |
| 0 | 0 | 0 | 0 | 1 |
| 2 | 2 | 3 | 0 | 0 |
| 3 | 4 | 8 | 2 | 5 |
| 2 | 5 | 8 | 6 | 1 |
|---|---|---|---|---|
| 8 | 7 | 5 | 6 | 3 |
| 0 | 0 | 0 | 0 | 1 |
| 2 | 2 | 3 | 0 | 0 |
| 1 | 7 | 9 | 4 | 4 |


| 0.2 | 0.5 | -0.1 | 0.2 | 0.3 |
|---|---|---|---|---|
| -0.3 | -0.1 | 0 | 0.2 | 0.4 |
| 0 | 0 | 0 | 0 | 1 |
| 0.2 | 0.3 | 0.4 | 0.1 | 0 |
| -0.2 | -0.5 | -0.4 | 0.1 | 0.3 |

Images download

Google Earth Engine

- Cambio de paradigma
- Plataforma en la nube para la visualización y el procesado de información cartográfica
- Petabytes de datos (imágenes satélite de diversos satélites/sensores)
- Datos rasters (Coberturas de usos del suelo, datos climáticos, etc...)
- Datos vectoriales
- Posibilidad de usar datasets propios
- Algoritmos de computación (posibilidad de desarrollar nuevos)
- Aplicaciones a escala global
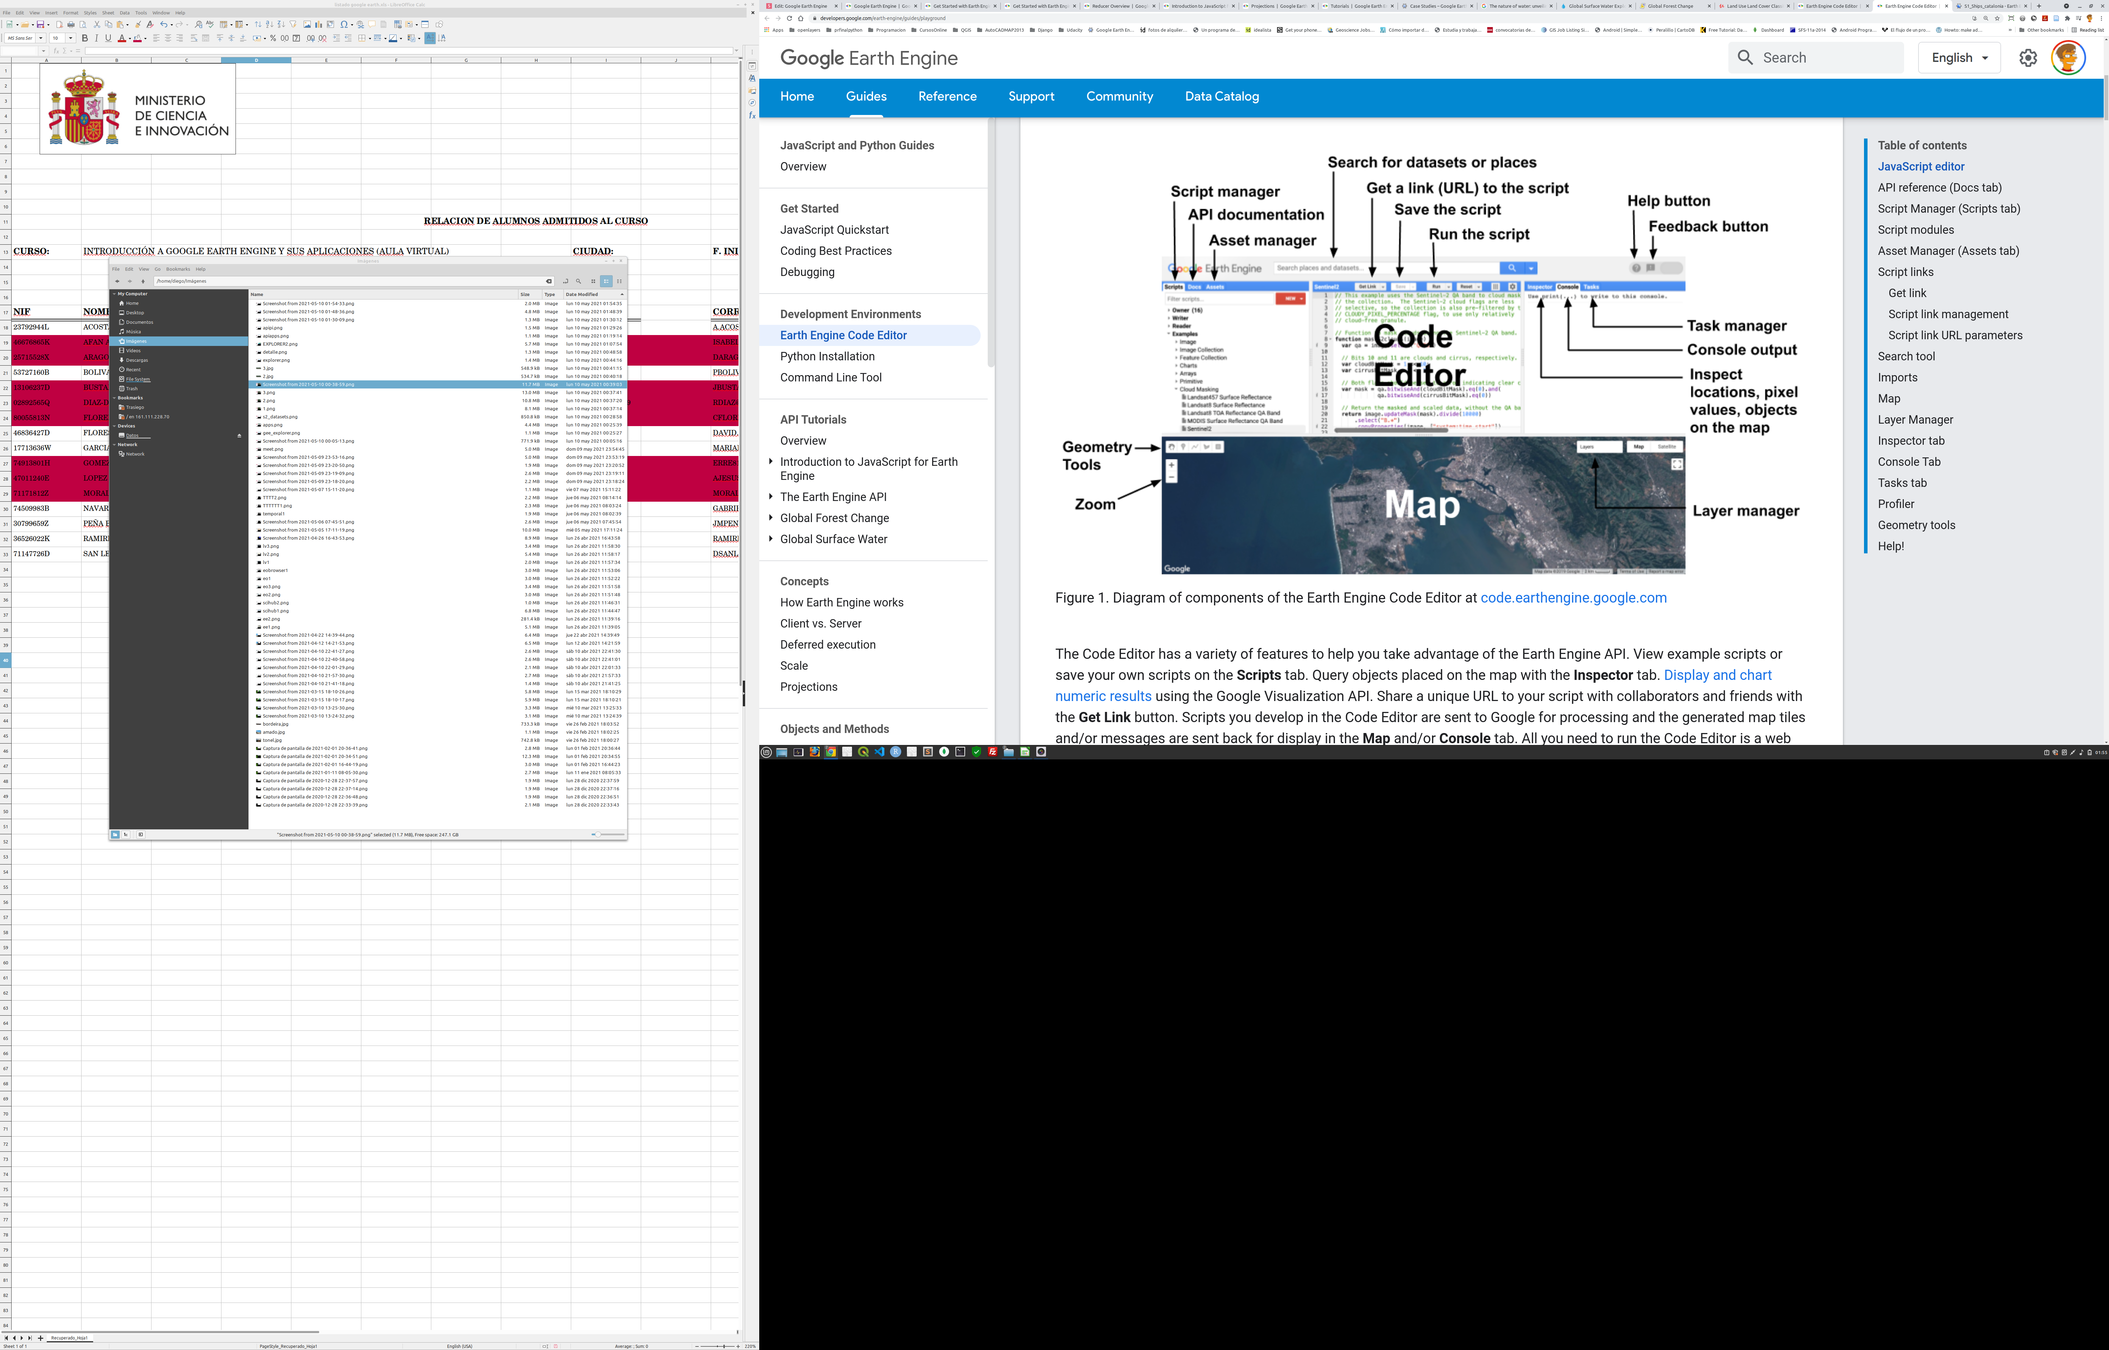

Google Earth Engine
3 minutos para jugar con GEE
Phenology


Tiempo

Phenology


- Metodología testada para hacer la reconstrucción de los cultivos en relación a la zona de alimentación del cernícalo primilla en la vega del Guadalquivir (Victoria Campón; Eladio Rodríguez)
- Mejora de las clasificaciones basadas en imágenes
Geemap
Paquete de python basada en la API de Python de Google Earth Engine y la aplicación de mapas Leaflet


https://www.youtube.com/c/Qiushengwu
Ndvi2Gif
Paquete de python basado en Geemap para el trabajo con índices de vegetación estacionales


Ndvi2Gif
import os
import ee
import geemap


class NdviSeasonality:


    '''Class to generate NDVI seasonal compoositions gifs. Seasons are defined like fixed parameters and we use ee.
    Reducer Max to get the maximun NDVI reached in every seasons. Then we combine then in a raster with 4 bands,
    one band per season. Color combination will show phenology over the seasons and over the years.
    Args:
        roi (ee.Geometry): Geometry to cross with satellite collections. Can be taken from roi on map, geojson or shapefile.
        start_year (int): First year to look for.
        end_year (int): End year to look for.
        sat (ee.ImageCollection): Available Sentinel 2 (default. 2015-present) and Landsat 4 TM, 5 TM, 7 ETM+, 8 OLI (1984-present).
    Returns:
        gif: Gif file with ndvi seasonal yearly composites.
        images: GeoTIFF with ndvi seasonal yearly composites.
    '''

    def __init__(self, roi=None, start_year=2016, end_year=2020, sat='Sentinel', key='max'):

        # Here we get the roi. Valid inputs are draws on the map, shapefiles or geojson
        self.roi = roi
        if self.roi is None:
            # When no geometry is passed we use a default area over Donana Natural Space
            self.roi = ee.Geometry.Polygon(
                [[[-6.766047, 36.776586],
                  [-6.766047, 37.202186],
                  [-5.867729, 37.202186],
                  [-5.867729, 36.776586],
                  [-6.766047, 36.776586]]], None, False)

        elif isinstance(self.roi, str):
            if self.roi.endswith('.shp'):
                self.roi = geemap.shp_to_ee(self.roi).geometry()
            elif self.roi.endswith('.geojson'):
                self.roi = geemap.geojson_to_ee(self.roi).geometry()
            else:
                print('It seems that your path is broken. Remember that await for shapefiles or geojson')

        else:

            if not isinstance(roi, ee.Geometry):

                try:
                    self.roi = self.roi.geometry()
                except Exception as e:
                    print('Could not convert the provided roi to ee.Geometry')
                    print(e)
                    return

        self.start_year = start_year
        self.end_year = end_year
        if sat not in ['Sentinel', 'Landsat', 'MODIS', 'sar']:
            print('You should choose one from Sentinel, Landsat, MODIS or sar')
        else:
            self.sat = sat

        self.sat = sat
        if key not in ['max', 'median', 'perc_90']:
            print('Please choose between max, median or perc_90 as available stats')
        else:
            self.key=key
        self.imagelist = []
        # Here we define the periods, feel free to change the dates in case your are looking for different seasons
        self.winter = ['-01-01', '-03-31']
        self.spring = ['-04-01', '-06-30']
        self.summer = ['-07-01', '-09-30']
        self.autumn = ['-10-01', '-12-31']
        # Here we define one dict for each season, in order to have the choice to choose the stat (max and median for the moment, it could be whatever supported for GEE)
        self.dwinter = {}
        self.dspring = {}
        self.dsummer = {}
        self.dautumn = {}

        # Here we defined the collections to generate the ndvi
        # Just need Red and NIR bandas, so avoid and rename them to apply the ndvi formula...
        # ...to all sensors in the same way
        # Get Landsat surface reflectance collections for OLI, ETM+ and TM sensors.

        LC08col = ee.ImageCollection("LANDSAT/LC08/C01/T1_SR").select(['B4', 'B5'], ['Red', 'Nir'])
        LE07col = ee.ImageCollection("LANDSAT/LE07/C01/T1_SR").select(['B3', 'B4'], ['Red', 'Nir'])
        LT05col = ee.ImageCollection("LANDSAT/LT05/C01/T1_SR").select(['B3', 'B4'], ['Red', 'Nir'])
        LT04col = ee.ImageCollection("LANDSAT/LT04/C01/T1_SR").select(['B3', 'B4'], ['Red', 'Nir'])

        # Notice that S2 is not in Surface Reflectance but in TOA, this because otherwise only
        # had data starting in 2017. Using BOA we have 2 extra years, starting at 2015
        # We use the wide 8 band instead of the 8A narrower badn, that is also more similar to landsat NIR
        # But this way we have NDVI at 10 m instead of 20. And we are using TOA instead of SR, so who cares?

        S2col = ee.ImageCollection("COPERNICUS/S2").select(['B4', 'B8'], ['Red', 'Nir'])

        # Get MODIS MOD09Q1.006 Terra Surface Reflectance 8-Day Global 250m
        # This is going to be the coarse resolution we will add (250 m) but it cold be a good choice
        # for large areas. And we good pretty good data from 2000 until present
        MOD09Q1 = ee.ImageCollection("MODIS/006/MOD09Q1").select(['sur_refl_b01', 'sur_refl_b02'], ['Red', 'Nir'])

        # Let's try to add Sentinel 1 to have some SAR data analysis capabilities
        s1 = ee.ImageCollection('COPERNICUS/S1_GRD').filter(ee.Filter.listContains('transmitterReceiverPolarisation', 'VH')).filter(ee.Filter.eq('instrumentMode', 'IW'))
        s1Ascending = s1.filter(ee.Filter.eq('orbitProperties_pass', 'ASCENDING'))
        s1Descending = s1.filter(ee.Filter.eq('orbitProperties_pass', 'DESCENDING'))
        s1SAR = s1Ascending.select('VH').merge(s1Descending.select('VH'))


        # Set the collection that will be used
        if self.sat == 'Sentinel':
            self.ndvi_col = S2col
        elif self.sat == 'Landsat':
            self.ndvi_col = LC08col.merge(LE07col).merge(LT05col).merge(LT04col)
        elif self.sat == 'MODIS':
            self.ndvi_col = MOD09Q1
        elif self.sat == 'sar':
            self.ndvi_col = s1SAR
        else:
            print('Not a valid satellite')
            pass

    def get_ndvi(self, image):

        '''Here we apply the NDVI calculation'''

        return image.normalizedDifference(['Nir', 'Red'])


    def get_winter(self, y):

        '''Here comes the funny thing. We generate the winter image for each year'''

        init, ends = str(y) + self.winter[0], str(y) + self.winter[1]

        if self.sat != 'sar':

            self.dwinter['max'] = self.ndvi_col.filterDate(init, ends).map(self.get_ndvi).max()
            self.dwinter['median'] = self.ndvi_col.filterDate(init, ends).map(self.get_ndvi).median()
            self.dwinter['perc_90'] = self.ndvi_col.filterDate(init, ends).map(self.get_ndvi).reduce(ee.Reducer.percentile([90]))

        else:

            self.dwinter['max'] = self.ndvi_col.filterDate(init, ends).max()
            self.dwinter['median'] = self.ndvi_col.filterDate(init, ends).median()
            self.dwinter['perc_90'] = self.ndvi_col.filterDate(init, ends).reduce(ee.Reducer.percentile([90]))

        return self.dwinter[self.key]

    def get_spring(self, y):

        '''Here comes the funny thing. We generate the spring image for each year'''

        init, ends = str(y) + self.spring[0], str(y) + self.spring[1]

        if self.sat != 'sar':

            self.dspring['max'] = self.ndvi_col.filterDate(init, ends).map(self.get_ndvi).max()
            self.dspring['median'] = self.ndvi_col.filterDate(init, ends).map(self.get_ndvi).median()
            self.dspring['perc_90'] = self.ndvi_col.filterDate(init, ends).map(self.get_ndvi).reduce(ee.Reducer.percentile([90]))

        else:

            self.dspring['max'] = self.ndvi_col.filterDate(init, ends).max()
            self.dspring['median'] = self.ndvi_col.filterDate(init, ends).median()
            self.dspring['perc_90'] = self.ndvi_col.filterDate(init, ends).reduce(ee.Reducer.percentile([90]))

        return self.dspring[self.key]


    def get_summer(self, y):

        '''Here comes the funny thing. We generate the summer image for each year'''

        init, ends = str(y) + self.summer[0], str(y) + self.summer[1]

        if self.sat != 'sar':

            self.dsummer['max'] = self.ndvi_col.filterDate(init, ends).map(self.get_ndvi).max()
            self.dsummer['median'] = self.ndvi_col.filterDate(init, ends).map(self.get_ndvi).median()
            self.dsummer['perc_90'] = self.ndvi_col.filterDate(init, ends).map(self.get_ndvi).reduce(ee.Reducer.percentile([90]))

        else:

            self.dsummer['max'] = self.ndvi_col.filterDate(init, ends).max()
            self.dsummer['median'] = self.ndvi_col.filterDate(init, ends).median()
            self.dsummer['perc_90'] = self.ndvi_col.filterDate(init, ends).reduce(ee.Reducer.percentile([90]))

        return self.dsummer[self.key]

    def get_autumn(self, y):

        '''Here comes the funny thing. We generate the autumn image for each year'''

        init, ends = str(y) + self.autumn[0], str(y) + self.autumn[1]

        if self.sat != 'sar':

            self.dautumn['max'] = self.ndvi_col.filterDate(init, ends).map(self.get_ndvi).max()
            self.dautumn['median'] = self.ndvi_col.filterDate(init, ends).map(self.get_ndvi).median()
            self.dautumn['perc_90'] = self.ndvi_col.filterDate(init, ends).map(self.get_ndvi).reduce(ee.Reducer.percentile([90]))

        else:

            self.dautumn['max'] = self.ndvi_col.filterDate(init, ends).max()
            self.dautumn['median'] = self.ndvi_col.filterDate(init, ends).median()
            self.dautumn['perc_90'] = self.ndvi_col.filterDate(init, ends).reduce(ee.Reducer.percentile([90]))

        return self.dautumn[self.key]

    def get_year_composite(self):

        '''Return the composite ndvi for each year'''

        # Maybe this should do with .map instead of a loop
        for y in range(self.start_year, self.end_year):

            composite = ee.Image.cat(self.get_winter(y), self.get_spring(y), self.get_summer(y), self.get_autumn(y)).clip(self.roi)

            if self.sat != 'sar':

                if self.key != 'perc_90':

                    compositer = composite.select(['nd', 'nd_1', 'nd_2', 'nd_3'], ['winter', 'spring', 'summer', 'autumn'])

                else:

                    compositer = composite.select(['nd_p90', 'nd_p90_1', 'nd_p90_2', 'nd_p90_3'], ['winter', 'spring', 'summer', 'autumn'])

            else:

                if self.key != 'perc_90':

                    compositer = composite.select(['VH', 'VH_1', 'VH_2', 'VH_3'], ['winter', 'spring', 'summer', 'autumn'])

                else:

                    compositer = composite.select(['VH_p90', 'VH_p90_1', 'VH_p90_2', 'VH_p90_3'], ['winter', 'spring', 'summer', 'autumn'])


            self.imagelist.append(compositer)


        ndvi_comp_coll = ee.ImageCollection.fromImages(self.imagelist)

        return ndvi_comp_coll


    def get_perc(self, image):

        '''Compute percentiles to use them as input in visualizatin parameters'''

        return [image.reduceRegions(self.roi, ee.Reducer.percentile([5]),
                    scale=10, crs='EPSG:4326').getInfo()['features'][0]['properties']['p5'],
                image.reduceRegions(self.roi, ee.Reducer.percentile([95]),
                    scale=10, crs='EPSG:4326').getInfo()['features'][0]['properties']['p95']]


    def get_gif(self, name='mygif.gif', bands=['winter', 'spring', 'summer']):

        '''Export NDVI year compositions as .gif to your local folder.
        This method calls geemap.download_ee_video & geemap.add_text_to_gif.
        Args:
            name (string): Name of the output gif. It will be saved at your current working directory.
            bands (list): List where you define the band combination for your gif.
        Returns:
            object(gif): myname.gif and myname_texted.gif downloaded at your current working directory
        '''

        self.imagelist = [0]
        self.get_year_composite()

        # We can't define an minimun and maximun for sar data, since it depends a lot on the region
        # Compute those values can take a lot of time, so we decided to keep a viz param standar for optical data
        # and just compute them for sar data, so we split viz params in two depending on sar or opical data
        # Of course, sar data it takes more time to be generated. This apply to get the gif not to export the images
        out_gif = os.path.join(os.getcwd(), name)
        self.imagelist = []

        if self.sat == 'sar':

            d = {'winter':self.dwinter, 'spring': self.dspring, 'summer': self.dsummer, 'autumn': self.dautumn}

            minimos = [self.get_perc(d[i][self.key])[0] for i in bands]
            maximos = [self.get_perc(d[i][self.key])[1] for i in bands]

            #min_ = self.get_perc(self.dwinter[self.key])[0]
            #max_ = self.get_perc(self.dwinter[self.key])[1]

            print(minimos, maximos)

            video_args = {
              'dimensions': 768,
              'region': self.roi,
              'framesPerSecond': 10,
              'bands': bands,
              'min': minimos,
              'max': maximos,
              'gamma': [1, 1, 1]}

        else:

            video_args = {
              'dimensions': 768,
              'region': self.roi,
              'framesPerSecond': 10,
              'bands': bands,
              'min': 0.15,
              'max': 0.85,
              'gamma': [1, 1, 1]}

        geemap.download_ee_video(self.get_year_composite(), video_args, out_gif)
        texted_gif = out_gif[:-4] + '_texted.gif'
        geemap.add_text_to_gif(out_gif, texted_gif, xy=('5%', '90%'),
                               text_sequence=self.start_year, font_size=30, font_color='#ffffff',
                               add_progress_bar=False, duration=300)


    def get_export_single(self, image, name='mycomposition.tif', crs='EPSG:4326', scale=10):

        '''Export single composition as .tif to your local folder. So long as we can do really nice
        multiseasonal composites, e.g. median seasonal NDVI for whole Africa between 2001 and 2020.
        I thought that would be interesting to have the chance to export this composites.
        This method calls geemap.ee_export_image.

        Args:
            crs (string): Coordinate Reference System of the output tifs. Use EPSG style e.g. "EPSG:4326"; "EPSG:32629"
            scale (int): Value for pixel size of your output tifs, default is 10 because default sat is Sentinel 2 NDVI,
                with bands 8 and 4 (10 m pix/resolution). In case you choose Landsat yous should change scale to 30.
                You can also considerer use this parameter like resample in case you get a size limitation error
                when try to download a big area.
        Returns:
          object(tif): 4 bands mycompositon.tif, with max, median or perc_90 for the period you chosen,
          downloaded at your current working directory
          '''

        filename = os.path.join(os.getcwd(), name)
        geemap.ee_export_image(image, filename=filename, scale=scale, crs=crs, region=self.roi, file_per_band=False)

        print('Image have been exported')


    def get_export(self, crs='EPSG:4326', scale=10):

        '''Export NDVI year compositions as .tif to your local folder.
        This method calls geemap.ee_export_image.

        Args:
            crs (string): Coordinate Reference System of the output tifs. Use EPSG style e.g. "EPSG:4326"; "EPSG:32629"
            scale (int): Value for pixel size of your output tifs, default is 10 because default sat is Sentinel 2 NDVI,
                with bands 8 and 4 (10 m pix/resolution). In case you choose Landsat yous should change scale to 30.
                You can also considerer use this parameter like resample in case you get a size limitation error
                when try to download a big area.
        Returns:
          object(tif): 4 bands ndvi_year.tif per year in your ndvi collection, downloaded at your current working directory
          '''

        self.imagelist = []
        self.get_year_composite()

        count = (len(self.imagelist))
        print(count)

        for n in range(count):
            year = self.start_year + n
            image = self.imagelist[n]
            name = 'ndvi_' + str(year) + '.tif'
            filename = os.path.join(os.getcwd(), name)
            print('Exporting {}'.format(filename), '\n')
            geemap.ee_export_image(image, filename=filename, scale=scale, crs=crs, region=self.roi, file_per_band=False)

        print('All the images in the ndvi collection have been exported')

- Clase NdviSeasonality
- Satélites:
- MODIS,
- Sentinel 1 y 2
- Lansat (4, 5, 7 y 8)
- Definición de "bandas temporales" para calcular los estadísticos (Max, Median, Perc_90)
Ndvi2Gif
5 minutos para jugar con Ndvi2Gif
PhenoApp
Aplicación basada en Ndvi2Gif, que se incorporará como nueva clase de la librería de Python
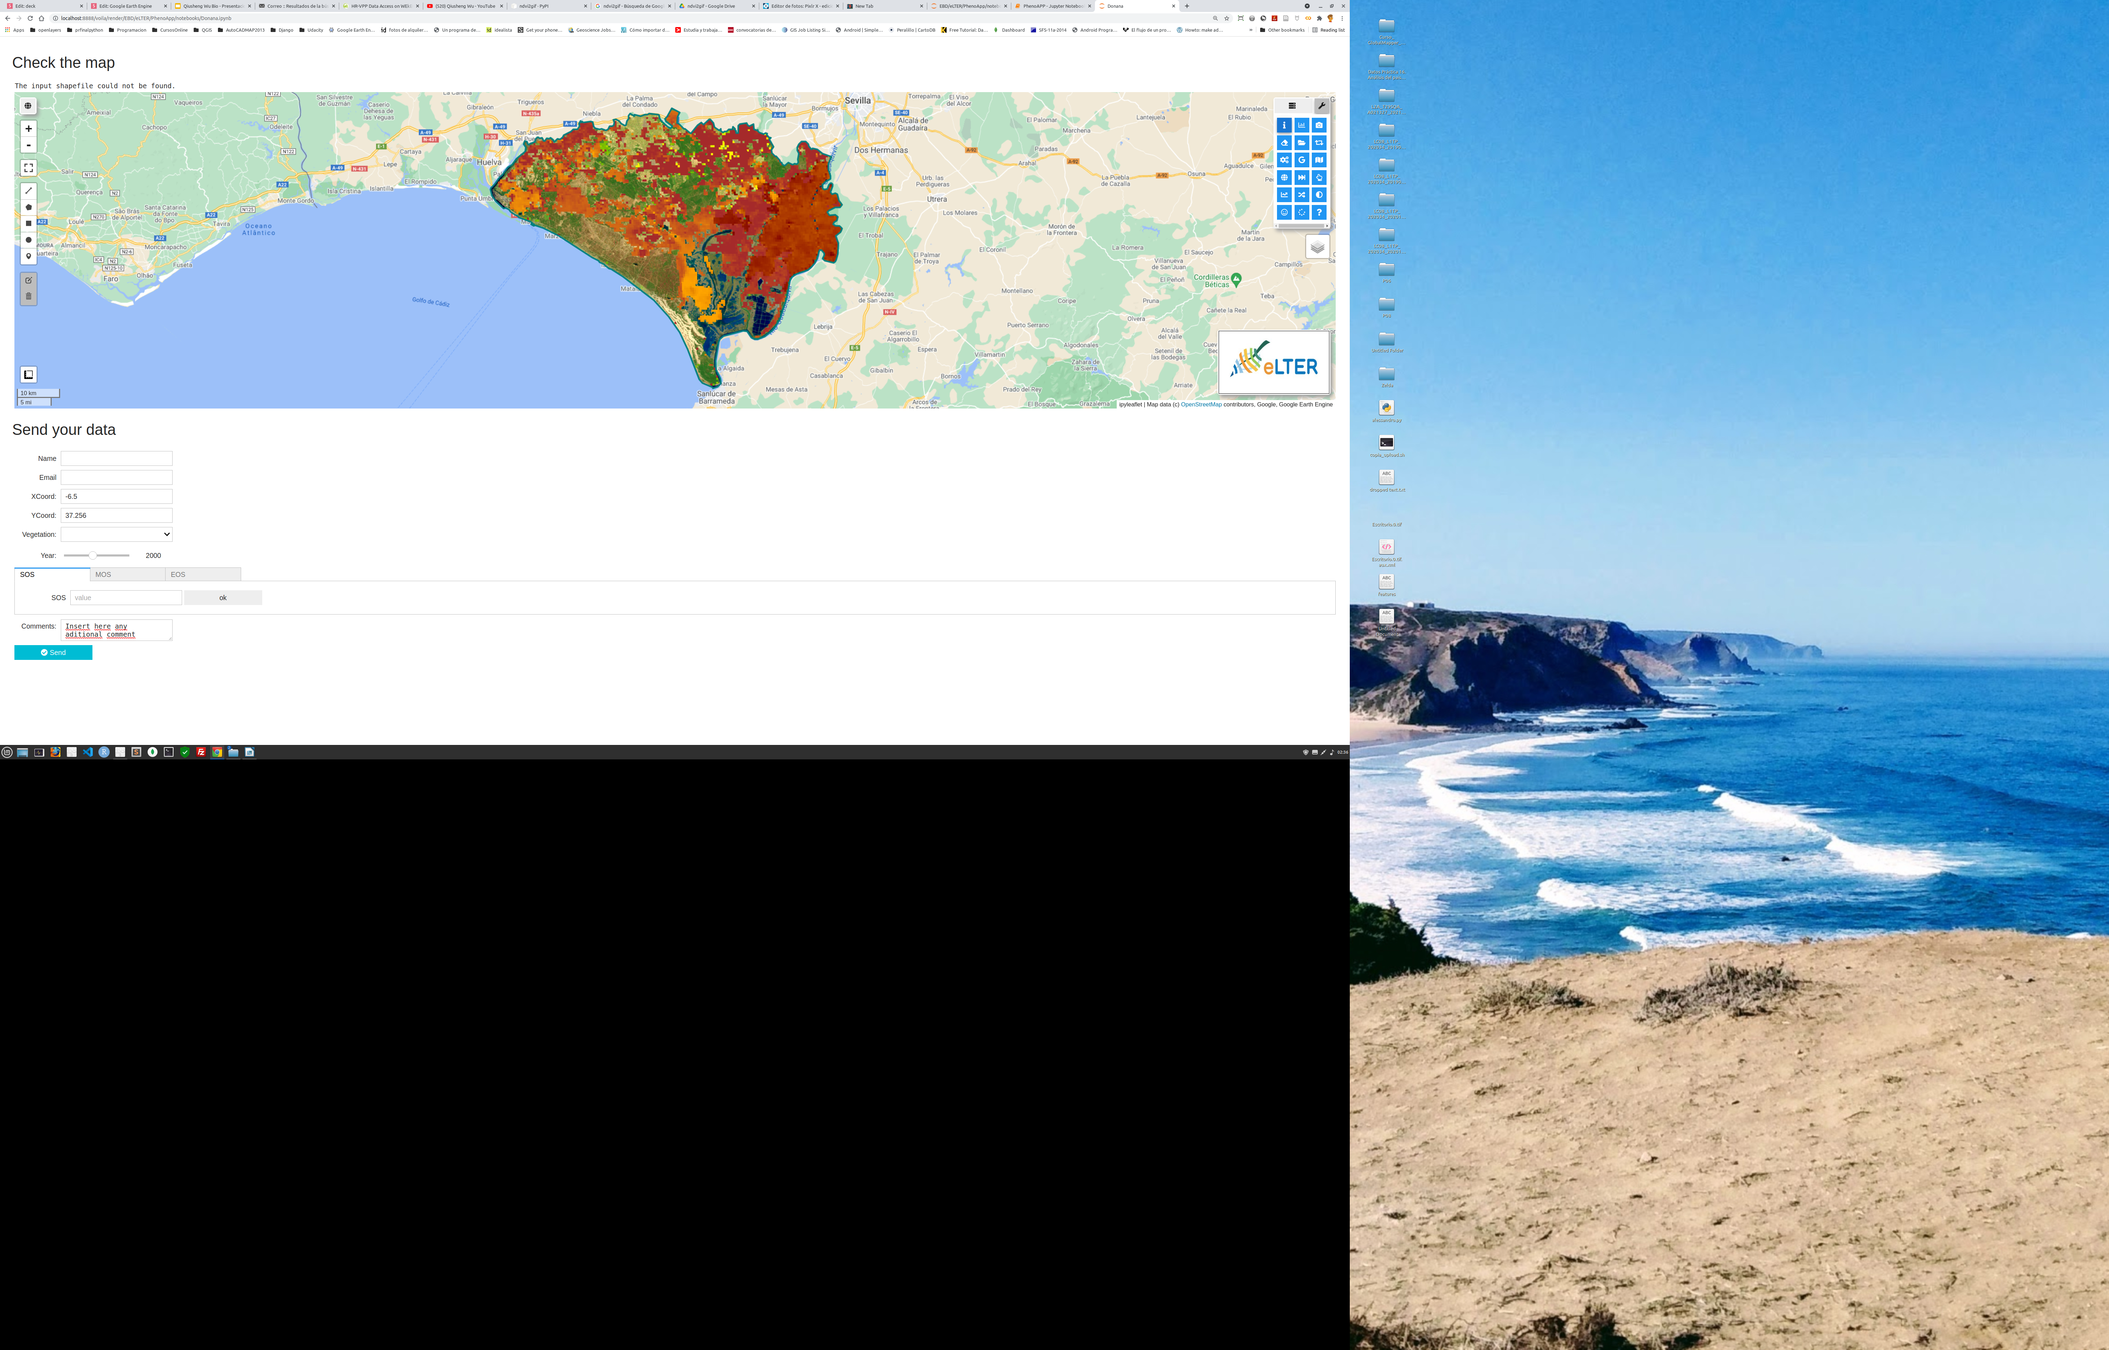

- Consulta y envío de parámetros fenológicos para los distintos sites de eLTER
- Work in progress...
- ToDo List:
- Add Classification method
- Add phenology Class
- Add bands time interactive
Agradecimientos y preguntas
Gracias
¿Alguna pregunta?