Causal Inference Based on Assignment Mechanism
ICS212

Definitions
A function of the data we use to compare null hypothesis to observed data
Treatment effect assumption articulated specifically enough to allow us to fill in missing potential outcomes
Randomization Distribution
Under null hypothesis, the probability of observing test statistic at least as extreme as actually observed
The set of plausible values of the average causal effect
Values of test statistic under all possible assignments.
Test Statistic
p-value
Sharp Null Hypothesis
Fisher Interval
Match the terms and the definitions
Fisher Test Algorithm/Workflow
Before looking at observed Y data
Use the observed Y data
Obtain p-value
specify sharp null
specify test statistic
specify what is "extreme"
fill in missing potential outcomes
compute test statistic for all possible assignments
determine p-value of observed test statistic
compute test statistic
CTV Example 41
The Experiment and the Data

STEP 1: Specify a sharp null hypothesis
STEP 2: Specify a test statistic
CTV Example 41
The Experiment and the Data
STEP 1: Specify a sharp null hypothesis
STEP 2: Specify a test statistic
CTV Example 41
The Experiment and the Data
STEP 1: Specify a sharp null hypothesis
STEP 2: Specify a test statistic
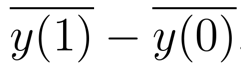
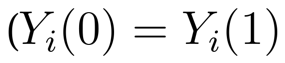
The terms in these two expressions look similar but are different in important ways. Explain.
Uppercase Yi of zero and one refer to the two potential outcomes of each individual. the lowercase ys with bars are means within the control and treatment groups (observed values).
CTV Example 41
The Experiment and the Data
STEP 1: Specify a sharp null hypothesis
STEP 2: Specify a test statistic
The terms in these two expressions look similar but are different in important ways. Explain.
CTV Example 41
The Experiment and the Data
What are we doing here?
(70 + 66 + 78.9)/3 - (55+72+72.7)/3
71.6 - 66.5
5.1
Computing the test statistic for the observed data. It it the "naive" treatment effect we have spoken of before.
CTV Example 41
The Experiment and the Data
What are we doing here?
(70 + 66 + 78.9)/3 - (55+72+72.7)/3
71.6 - 66.5
5.1
CTV Example 41
The Experiment and the Data
The next step is "specify what values are more extreme." How do we do it here?
= 5.1
We simply observe that in this case bigger is more extreme. That is, when we think about what can happen in our analysis we'll be saying something like "what is the probability of getting a result that is at least this big?"
CTV Example 41
The Experiment and the Data
The next step is "specify what values are more extreme." How do we do it here?
= 5.1
CTV Example 41
The Experiment and the Data
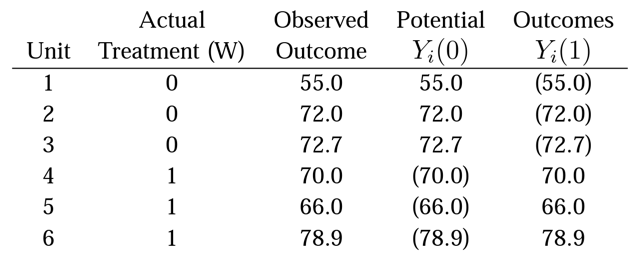
Now we want to fill in the potential outcomes under the strong null hypothesis. How do we do this?
We add columns for potential outcome Yi(1) and Yi(0) and insert the observed values. And then we "compute" the missing potential outcomes by "applying" the strong null.
screen shot from p 42
CTV Example 41
The Experiment and the Data
Now we want to fill in the potential outcomes under the strong null hypothesis. How do we do this?
screen shot from p 42
CTV Example 42
Fill in the observed outcomes.
Strong null is ZERO TREATMENT EFFECT. Fill in potential outcomes corresponding to "nothing happened."
screen shot from p 42
CTV Example 42
Fill in the observed outcomes.
Strong null is ZERO TREATMENT EFFECT. Fill in potential outcomes corresponding to "nothing happened."
screen shot from p 42
CTV Example 43
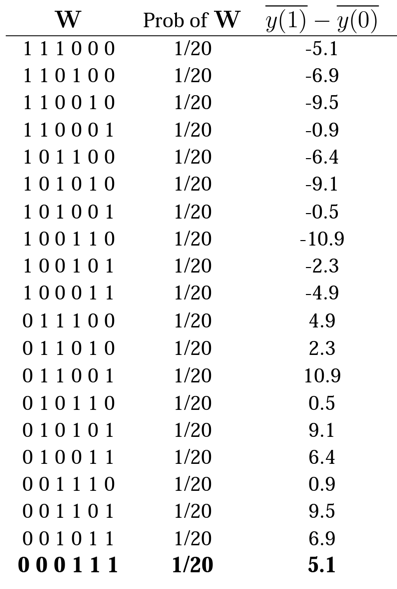
Why does this describe all the possible assignments with the same sample sizes? Why does the last row represent the observed data?
STEP 5: For each possible assignment compute test statistic
Why 20 rows here?
This is a classic choose k from n situation with k=3, n=6. The formula is
n! / k!(n-k)!
which in this case is 20=6!/3!3!
screen shot from p 43
W, we remember is standard notation for assignment where wi=1 if unit i is treated, 0 if unit i is control.
Here the columns represent units 1 through 6.
Thus 101010 represents the assignment where units 1,3, and 5 are treated while 2,4,6 are control.
Units 1, 2, and 3 have W=0 and so are not treated. Units 4,5, and 6 have W=1 and so are treated.
CTV Example 43
Why does this describe all the possible assignments with the same sample sizes? Why does the last row represent the observed data?
STEP 5: For each possible assignment compute test statistic
Why 20 rows here?
screen shot from p 43
CTV Example 43
- What do all the 1/20 mean?
- Pick one of the numbers in column 3 on the right and explain where it comes from.
We figured out that there are 20 possible random assignments and since each one is treated as equally likely, the probability associated with each one is 1/20=0.05.
Let's pick, for example, the 4.9 on line 11. The W is 011100 so units 2,3,4 are treated and 1,5,6 are control:
(72+72.7+70)/3 - (55+66+78.9)/3 = 214.7 71.6 - 189.9/3 63.3
screen shot from p 42
screen shot from p 43
CTV Example 43
- What do all the 1/20 mean?
- Pick one of the numbers in column 3 on the right and explain where it comes from.
screen shot from p 42
screen shot from p 43
CTV Example 43
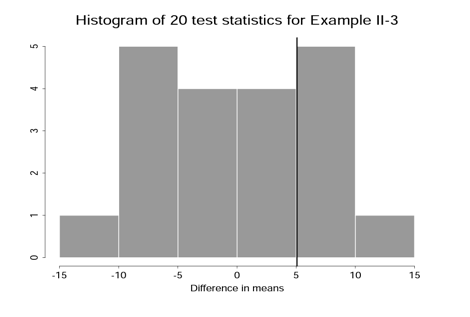
Here are all the assignments that yield an outcome at least as large as the one we observed. And here is a histogram of all the test statistic values. What's going on here? What does it mean?
screen shots from p 43
CTV Example 45
Let's sketch pseudocode for performing this sort of thing in R
we start with 6 observations and W 0 0 0 1 1 1