R for Psychological Science?
Danielle Navarro
13 July 2018, useR! conference, Brisbane
A very unplanned presentation 🙃


slides.com/djnavarro/user2018
This is me...
This is my lab...
https://compcogscisydney.org/

R in teaching
(Part 1)
R in research

(Part 2)
R more generally??


(Part 3)
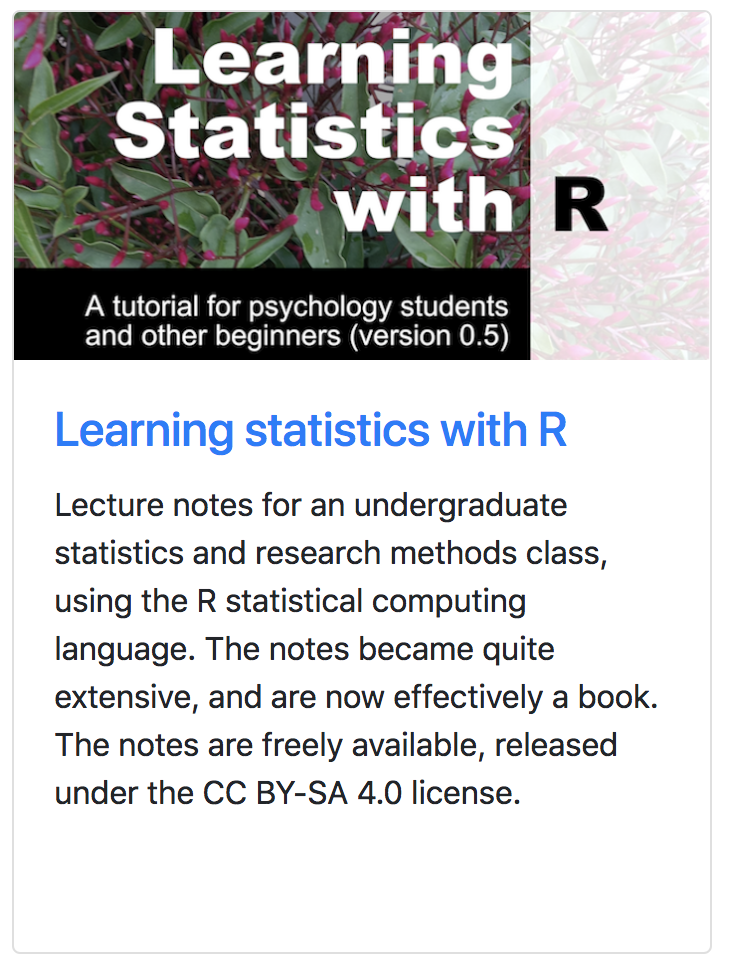
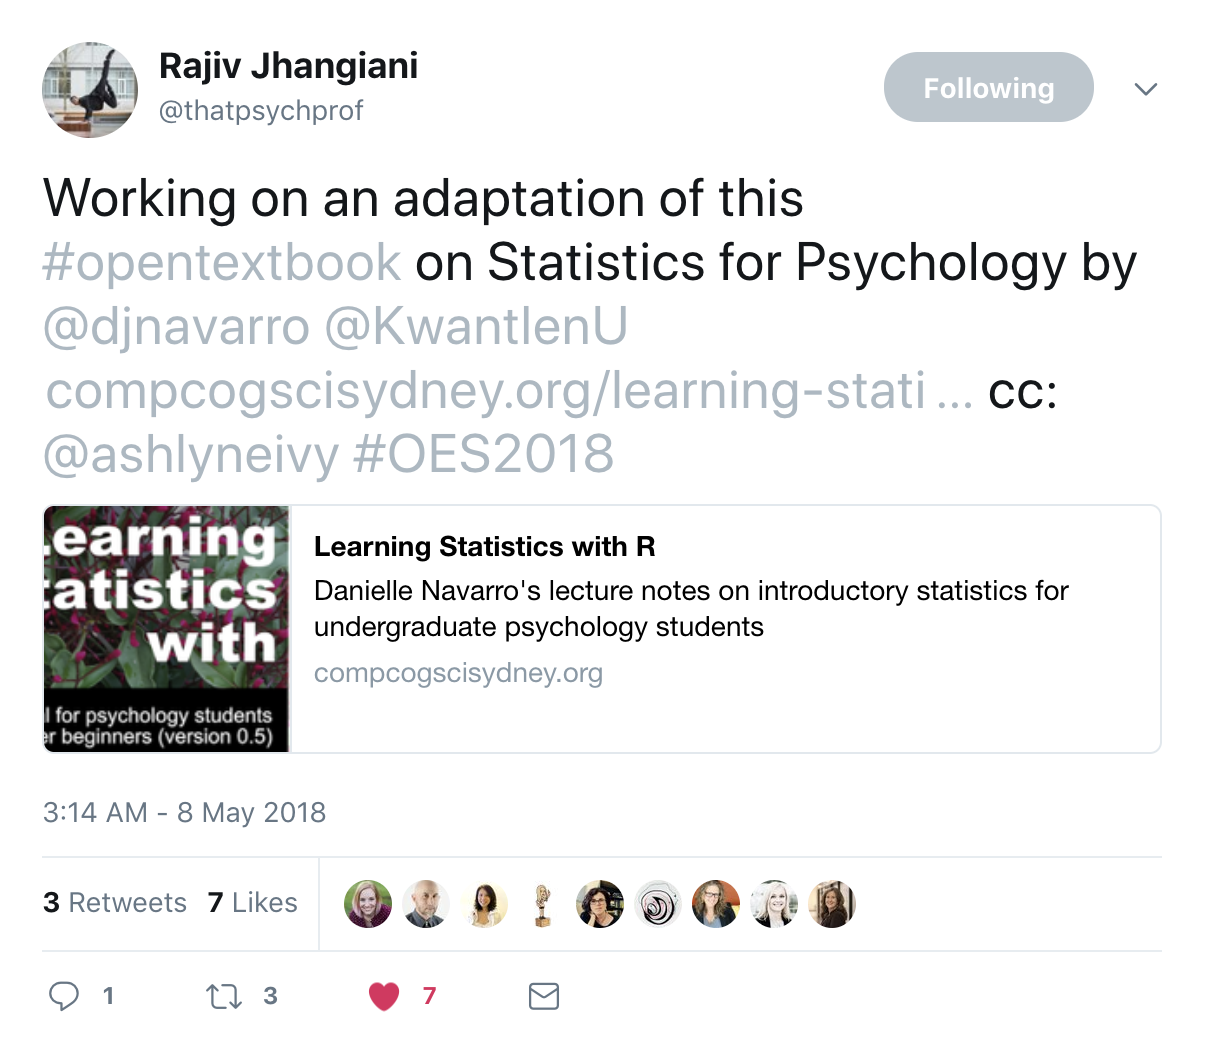
1. Learning Statistics with R: An accidental textbook
compcogscisydney.org/learning-statistics-with-r/
- It is a grim, terrible world without snapchat
- I am asked to teach intro stats to 300 psych students
- I make a huge mistake
The year is 2010
Want!
- Reasoning about data
- Working with data
- Using "real" tools
Do not want
- Memorising commands
- Rote learning tests
- Strict rules for analysis
- Fear!
Frequentist statistics
Bayesian statistics
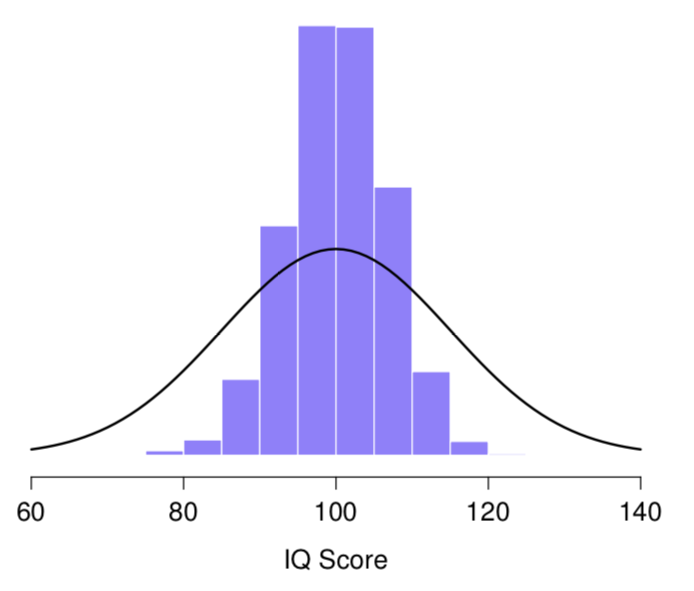
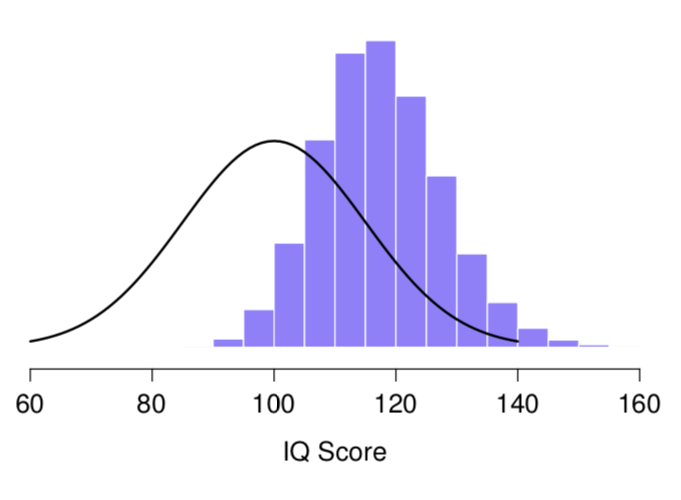
We teach the sampling distribution of the mean
...but we don't talk about sampling distributions in any other context
Sampling distribution for the maximum of 5 measurements?
Easy to simulate, if you have the tools!

Concerns were raised
- We'll lose professional accreditation
- IT department won't allow it
- Interface is too confusing
- SPSS is the academic standard
- Our other classes use SPSS
- Other universities don't use R
- Employers value SPSS
- Academics won't learn it
- The students will hate it
* I wasn't at UNSW at the time, but I've heard these sentiments from all over
What to use as a textbook?
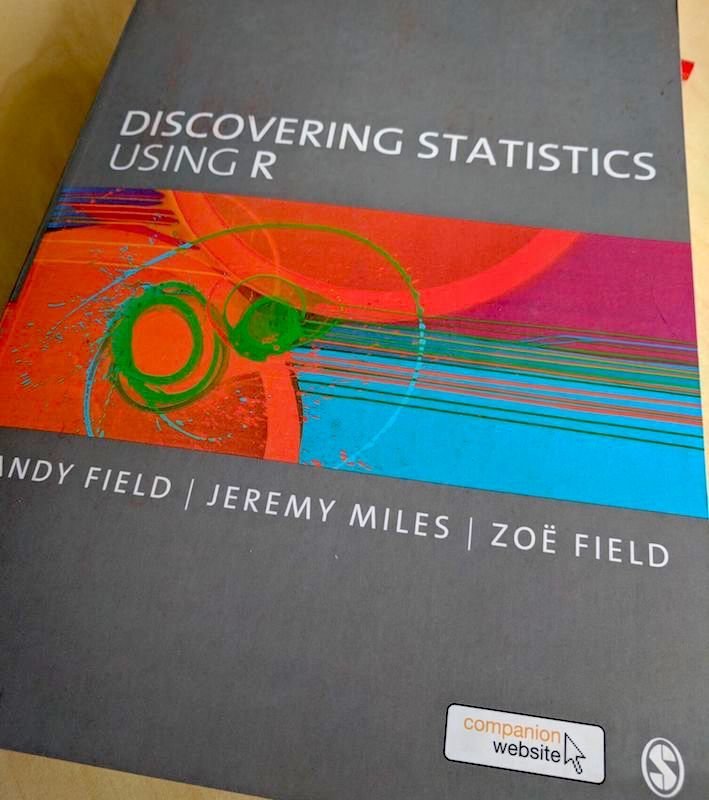
it's 2010?

A lot of my students are priced out
my_data <- attach(iris)
I attached the data, and it doesn't work...
... ah, right. I can't reasonably expect to take a text written for a different audience and think it will work in my class.
So I wrote my own lecture notes
http://compcogscisydney.org/
learning-statistics-with-r/
I tried to address student fears
I aimed for a relaxed style
I covered the usual topics for psych methods
Extended to cover Bayesian and orthodox
I tried to show complexity where I could
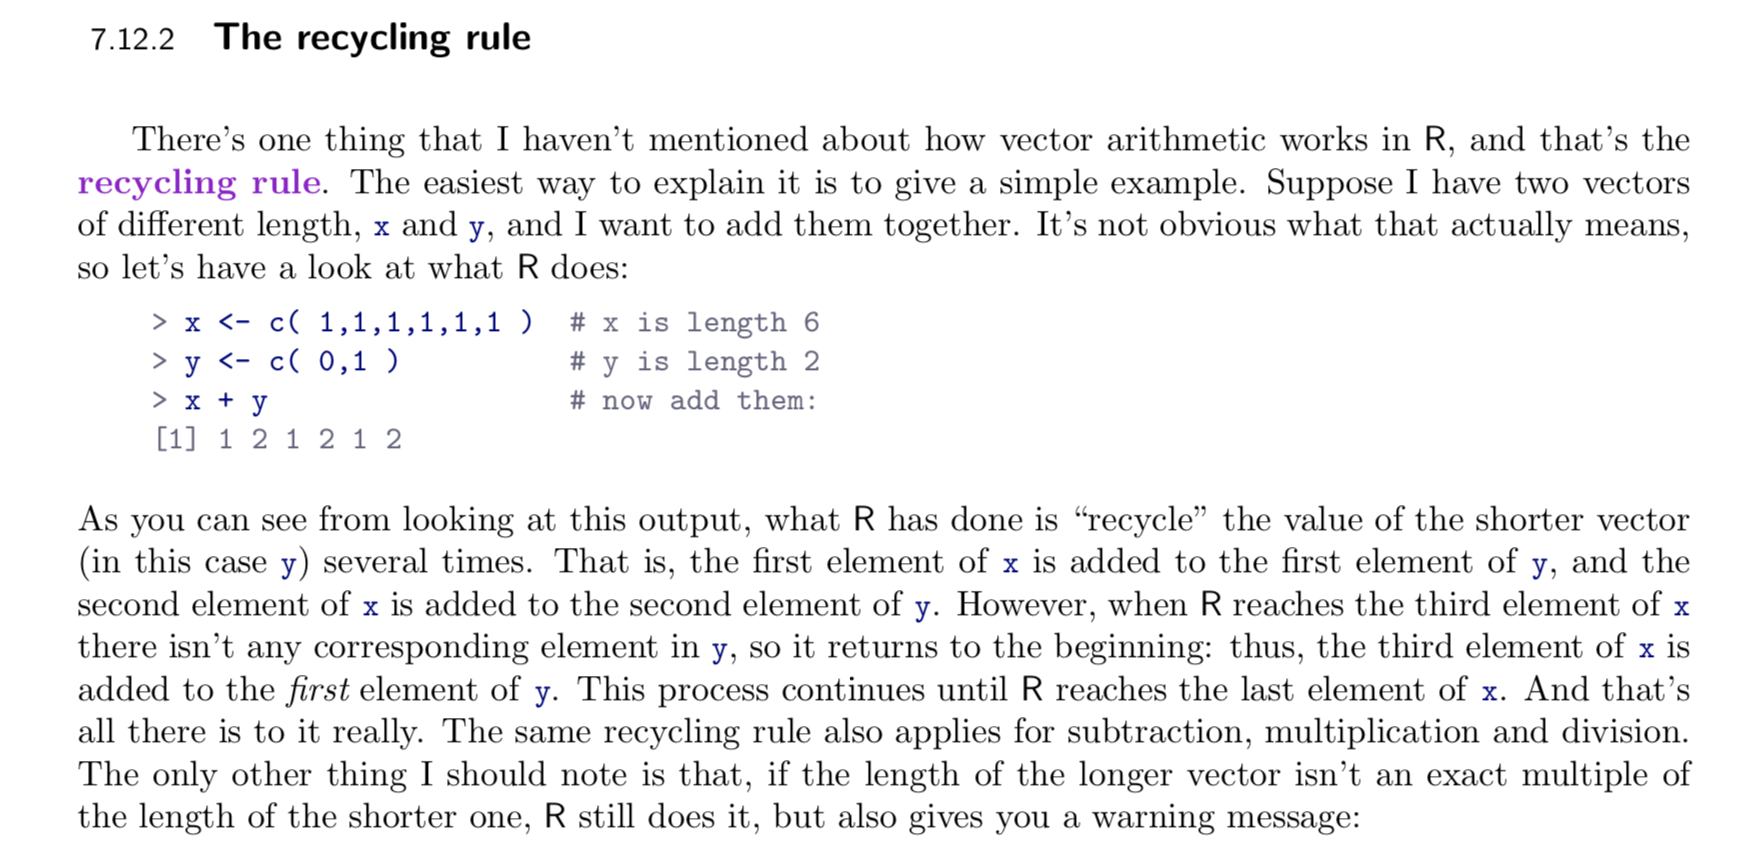
I discussed some of R's quirks
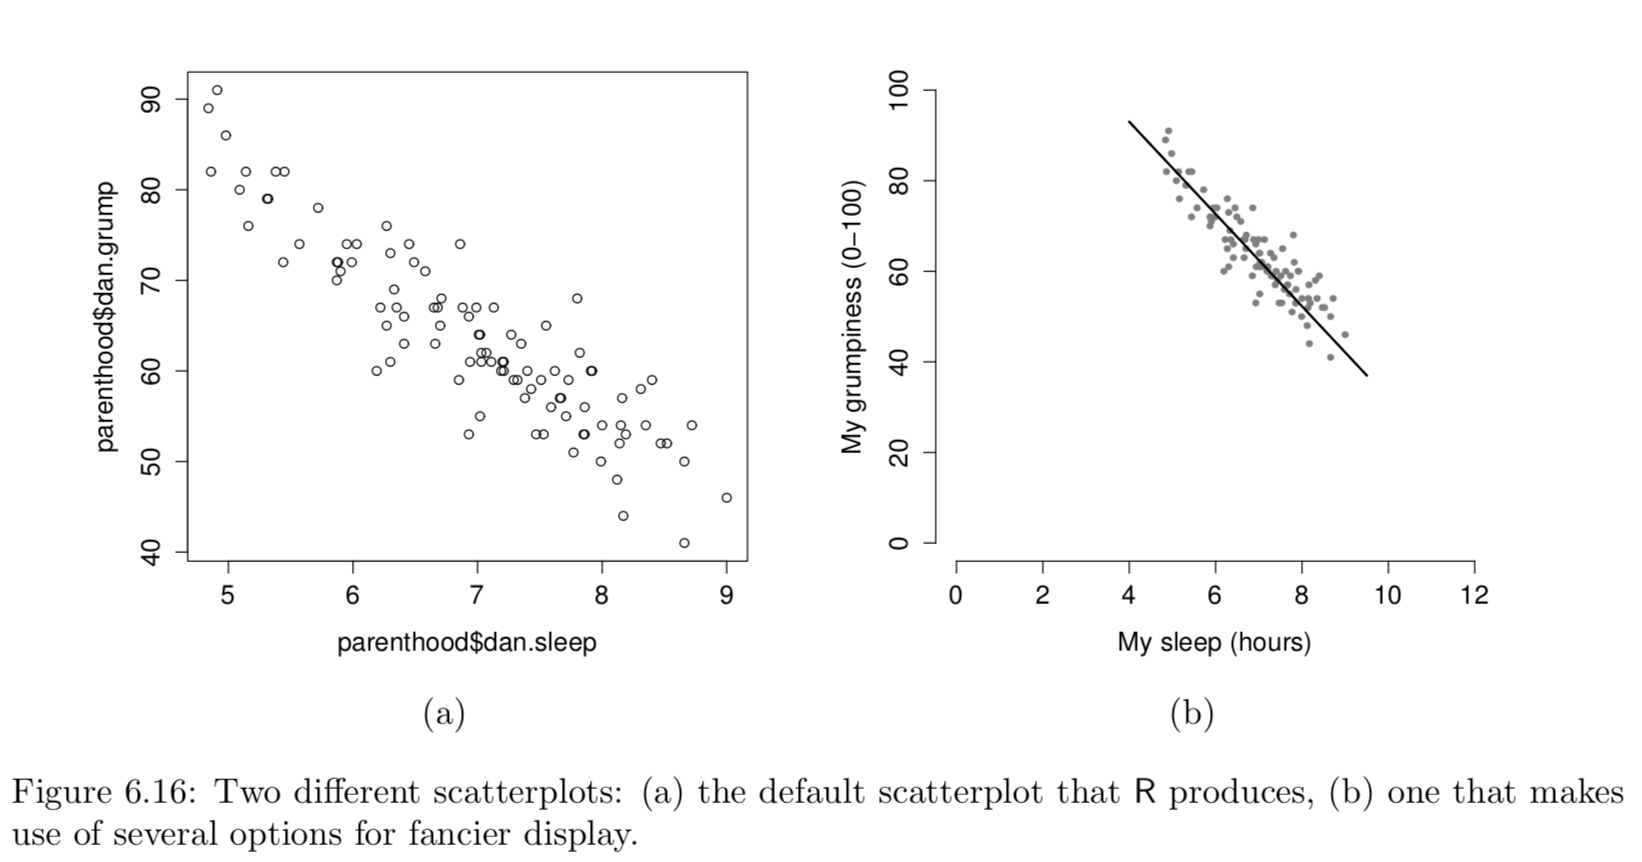
I covered basic data visualisation
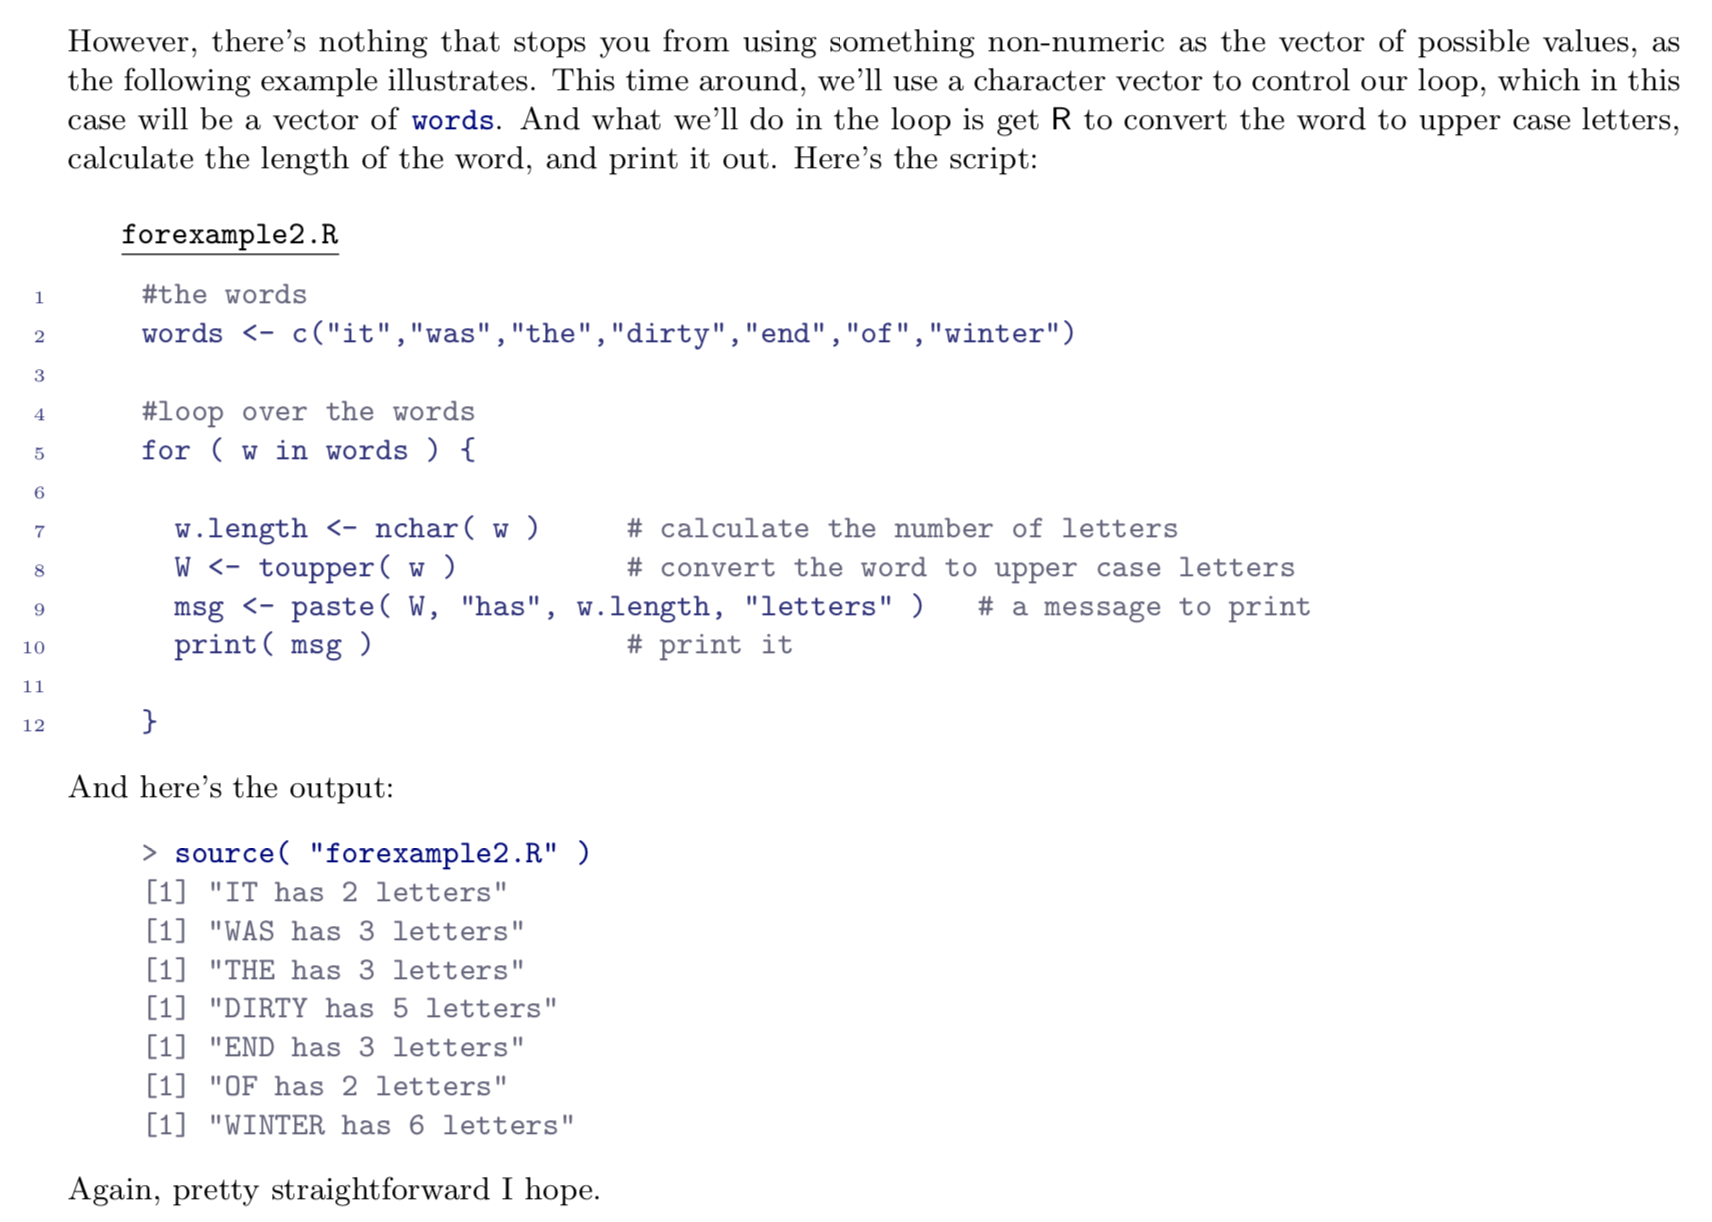
I covered basic programming
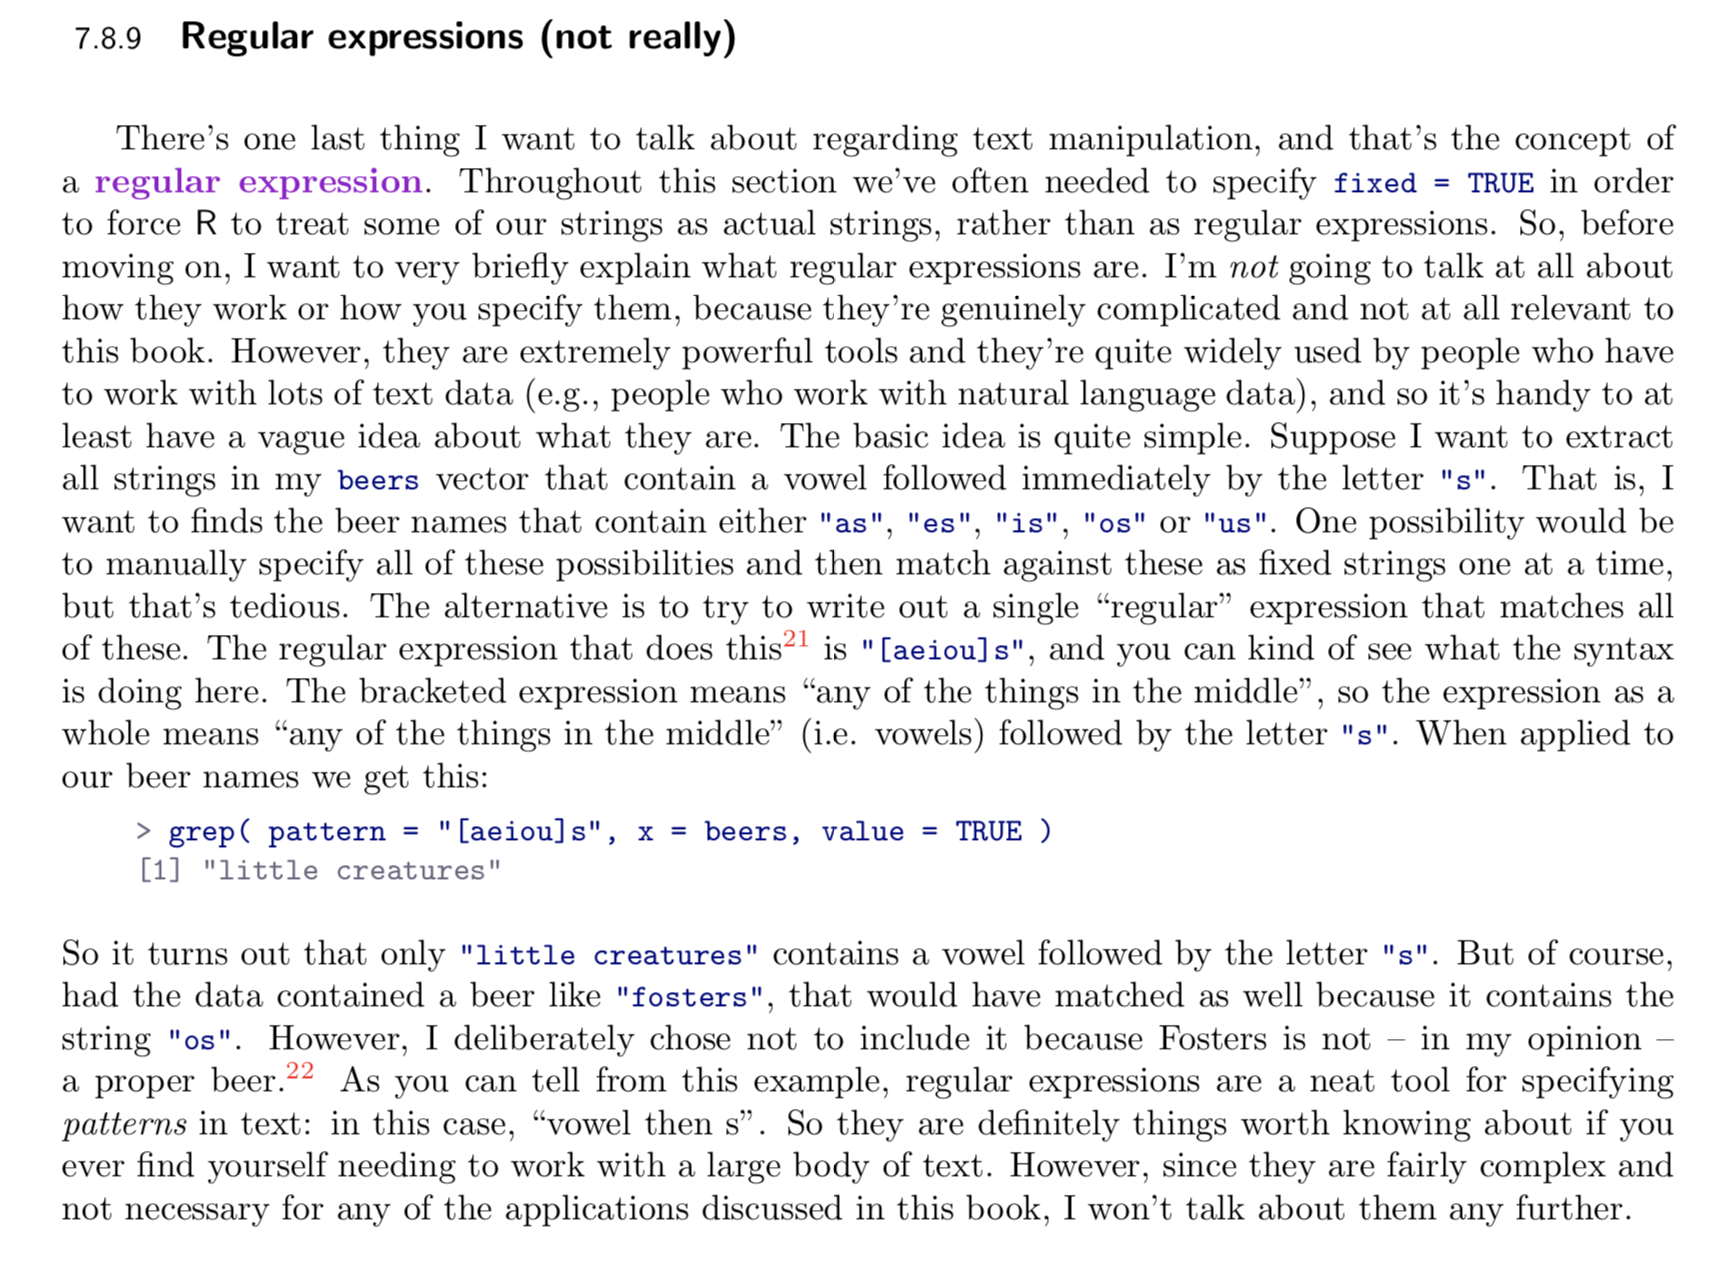
I even touched on regular expressions for some reason
... I may have gone a little overboard
So... how did it go?
- My student evaluations were excellent 💯
- I won a teaching award 🙄
- I ended up with a book, apparently 📕
Well, it certainly helped me
The students?
- They learned the basics of R nicely 🎉
- They grasped the statistical concepts better 🎉
- They needed more exercises ⏱️
- They struggled to generalise 😢
- Written in LaTeX
- Predates tidyverse
- Needs editing
- Etc
The book has limitations
Also this...
"An introductory textbook, well-written though it is, does not constitute a scholarly work"

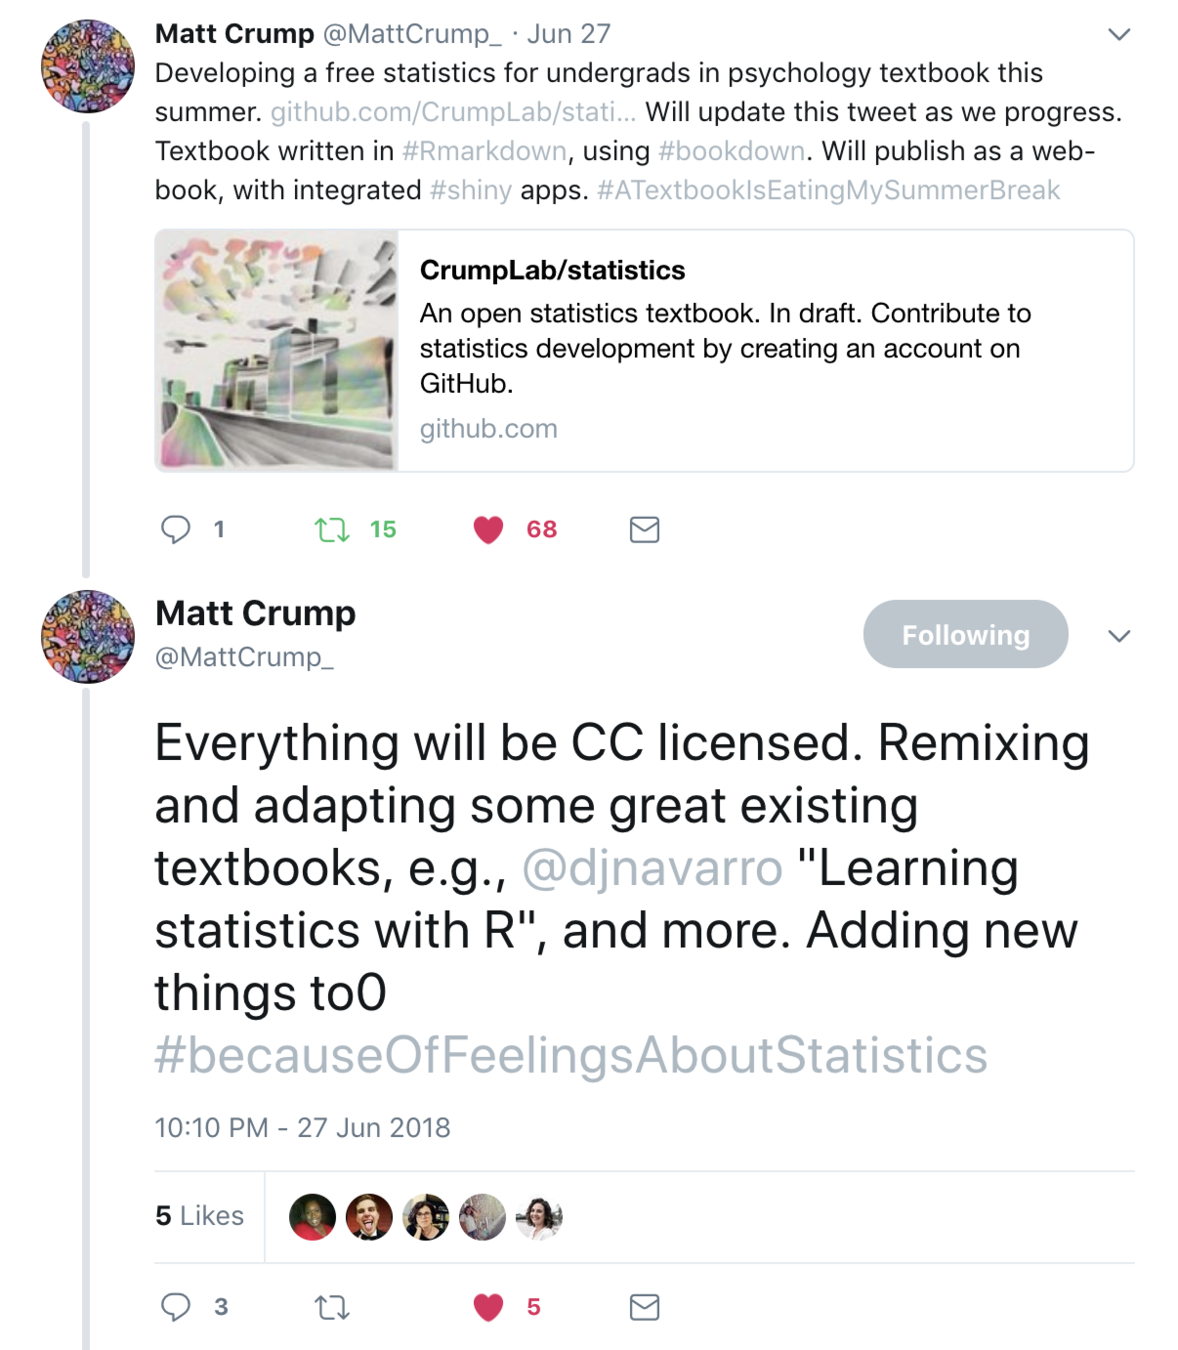
Open Access
- CC-BY-SA 4.0
- Source on GitHub
- Links:
http://compcogscisydney.org/
learning-statistics-with-r/
Yay!!!!
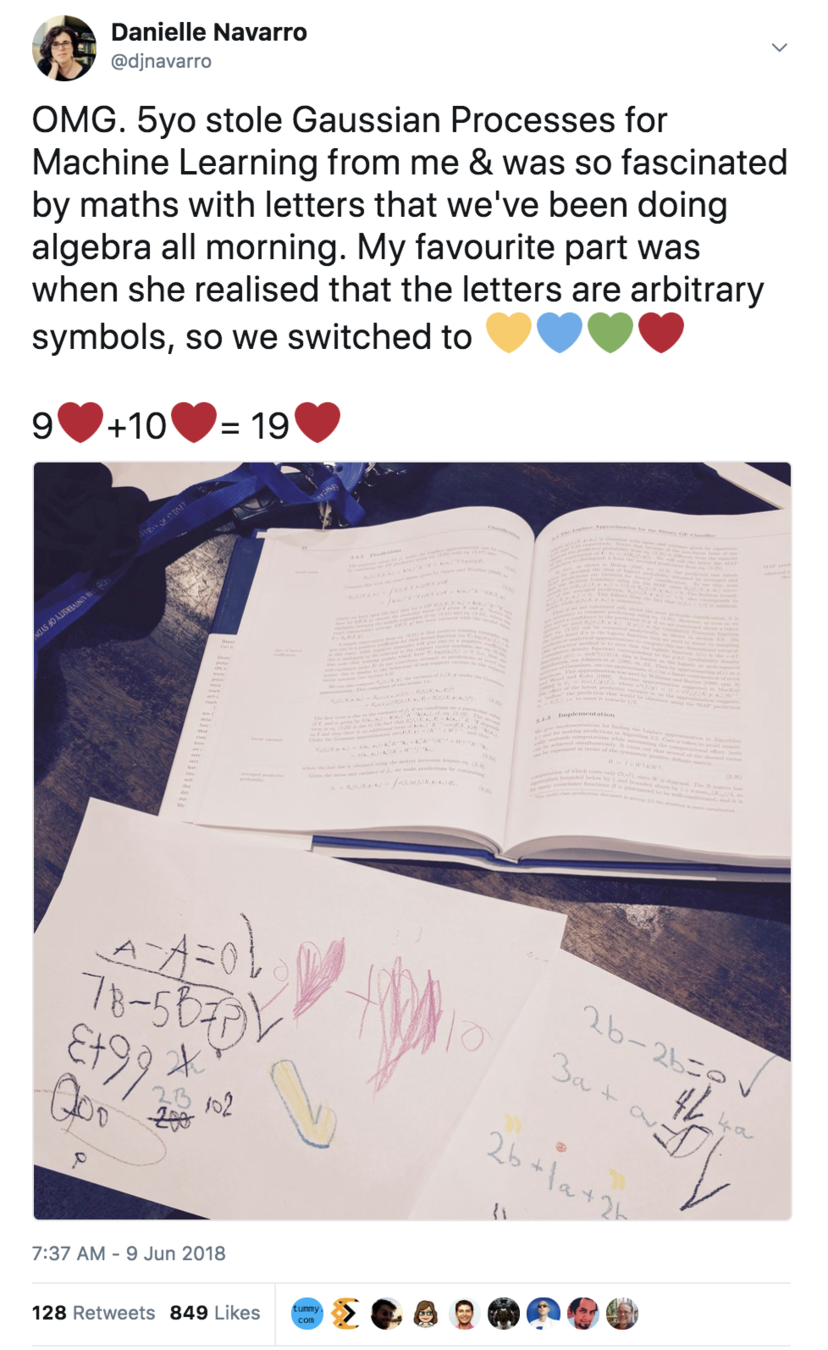
2. Probabilistic models of cognition with R
compcogscisydney.org/projects/
Photo by Tachina Lee on Unsplash
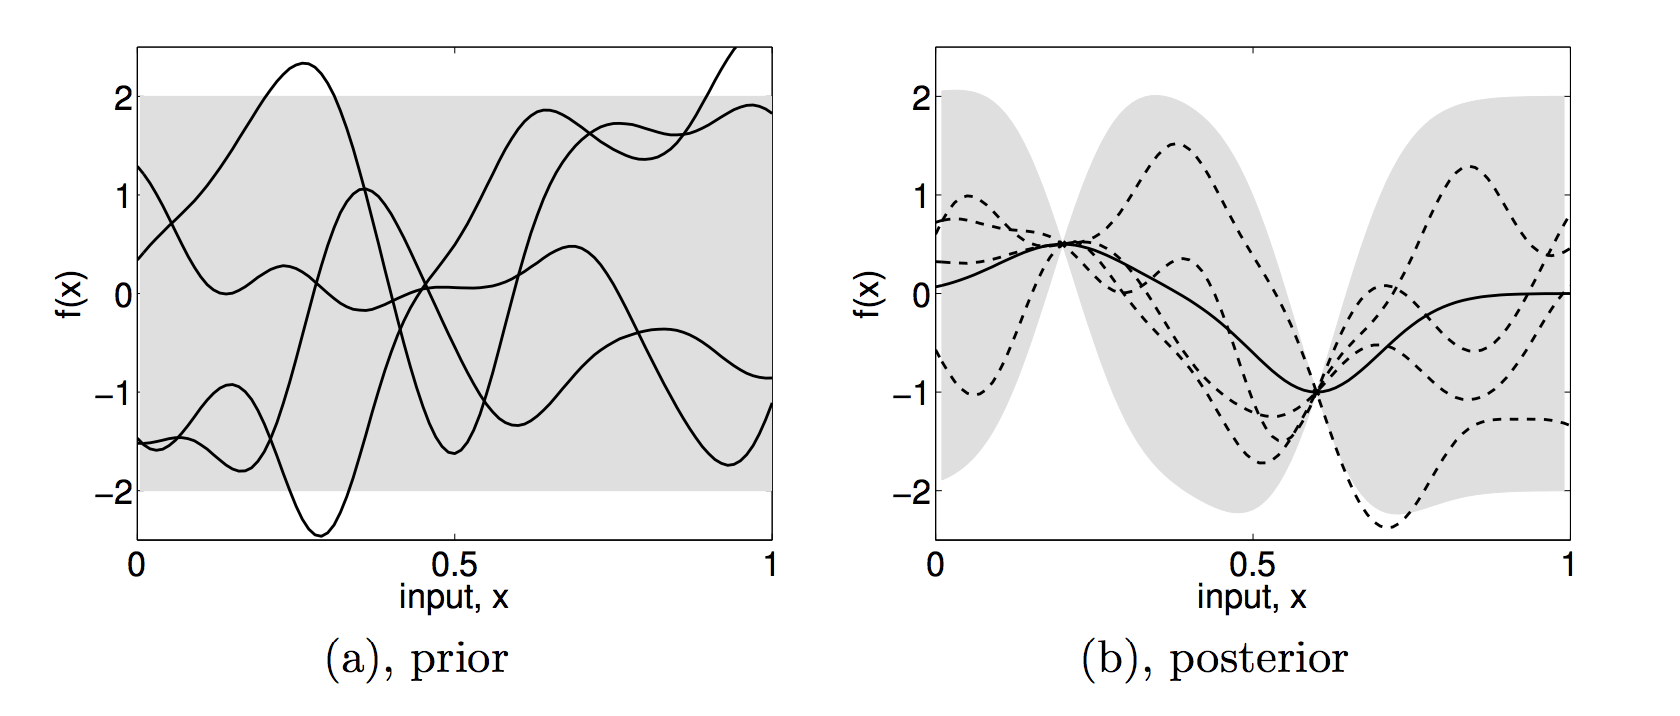
2.1 Reasoning with Gaussian Processes
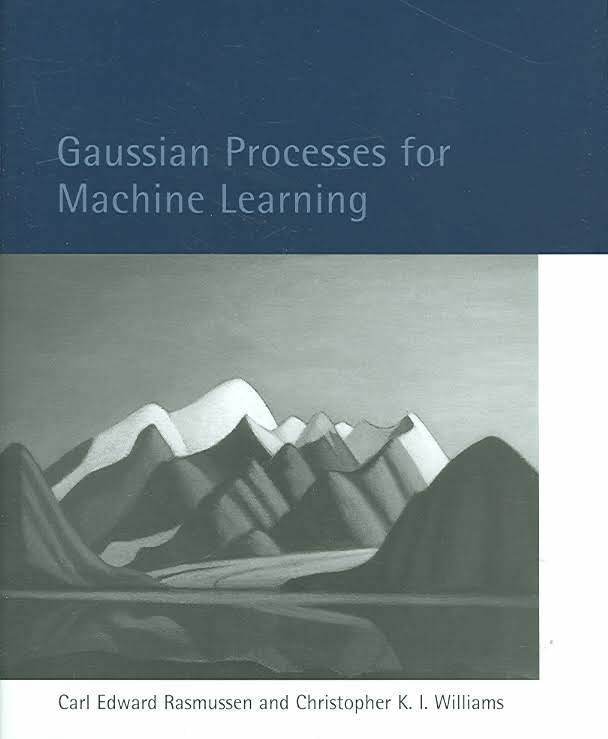
Used to solve regression and classification problems
Sharks have plaxium blood
Seagulls do not
Can be applied as a model for human inductive reasoning
Training set:
Test set:
- Sharks
- Seagulls
- Goldfish
- Penguins
Rather a lot of methodological details here
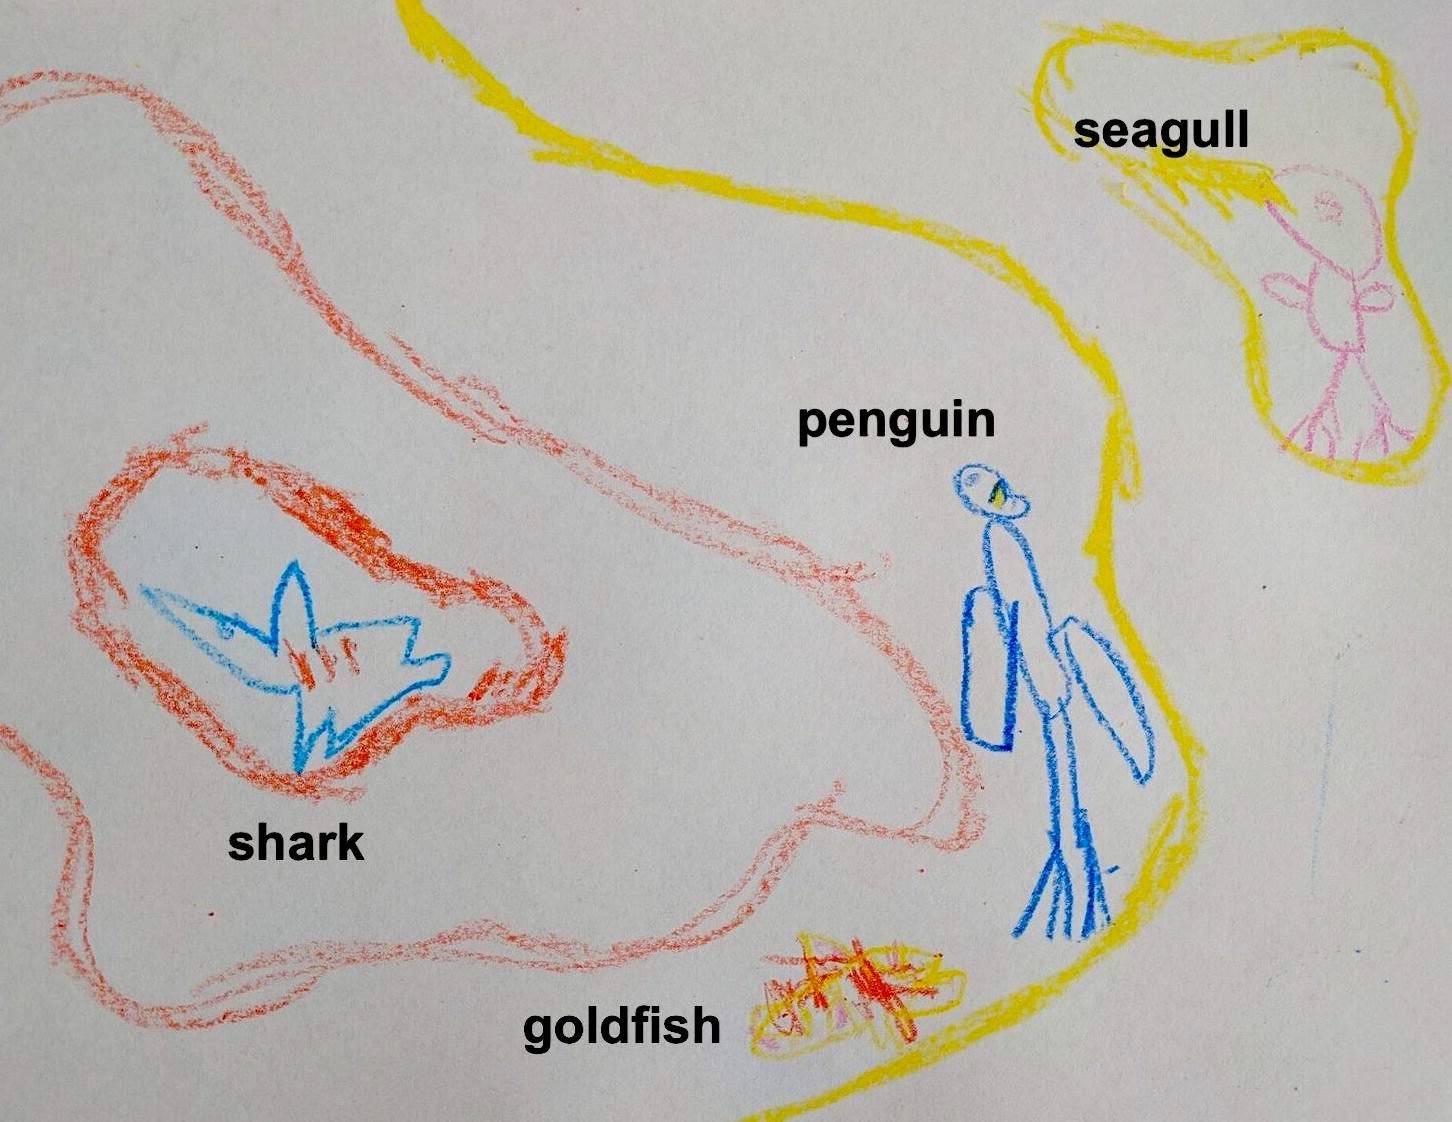
Sharks have plaxium blood
Seagulls do not
Similarity based generalisation looks rather like learning a classifier
Training set:
model {

  # mean and covariance matrix defining the Gaussian process
  for(i in 1:ncat) {
    mean_gp[i] <- m
    cov_gp[i,i] <- (sigma^2) + (tau^2)
    for(j in (i+1):ncat) {
      cov_gp[i,j] <- (tau^2) * exp(-rho * (test[i] - test[j])^2)
      cov_gp[j,i] <- cov_gp[i,j]
    }
  }

  # sample a function from the Gaussian process
  cov_gp_inv <- inverse(cov_gp)
  f ~ dmnorm(mean_gp, cov_gp_inv)

  # pass f through logit function to get a function on [0,1]
  for(i in 1:ncat) {
    phi[i] <- 1/(1+exp(-f[i]))
  }


  #
  # [SNIP]
  #

}
Gaussian process prior
Classification function
Data
Gaussian process prior
Classification function
Data
Learning and classification and are viewed as an inverse probability problem ... i.e. Bayesian reasoning
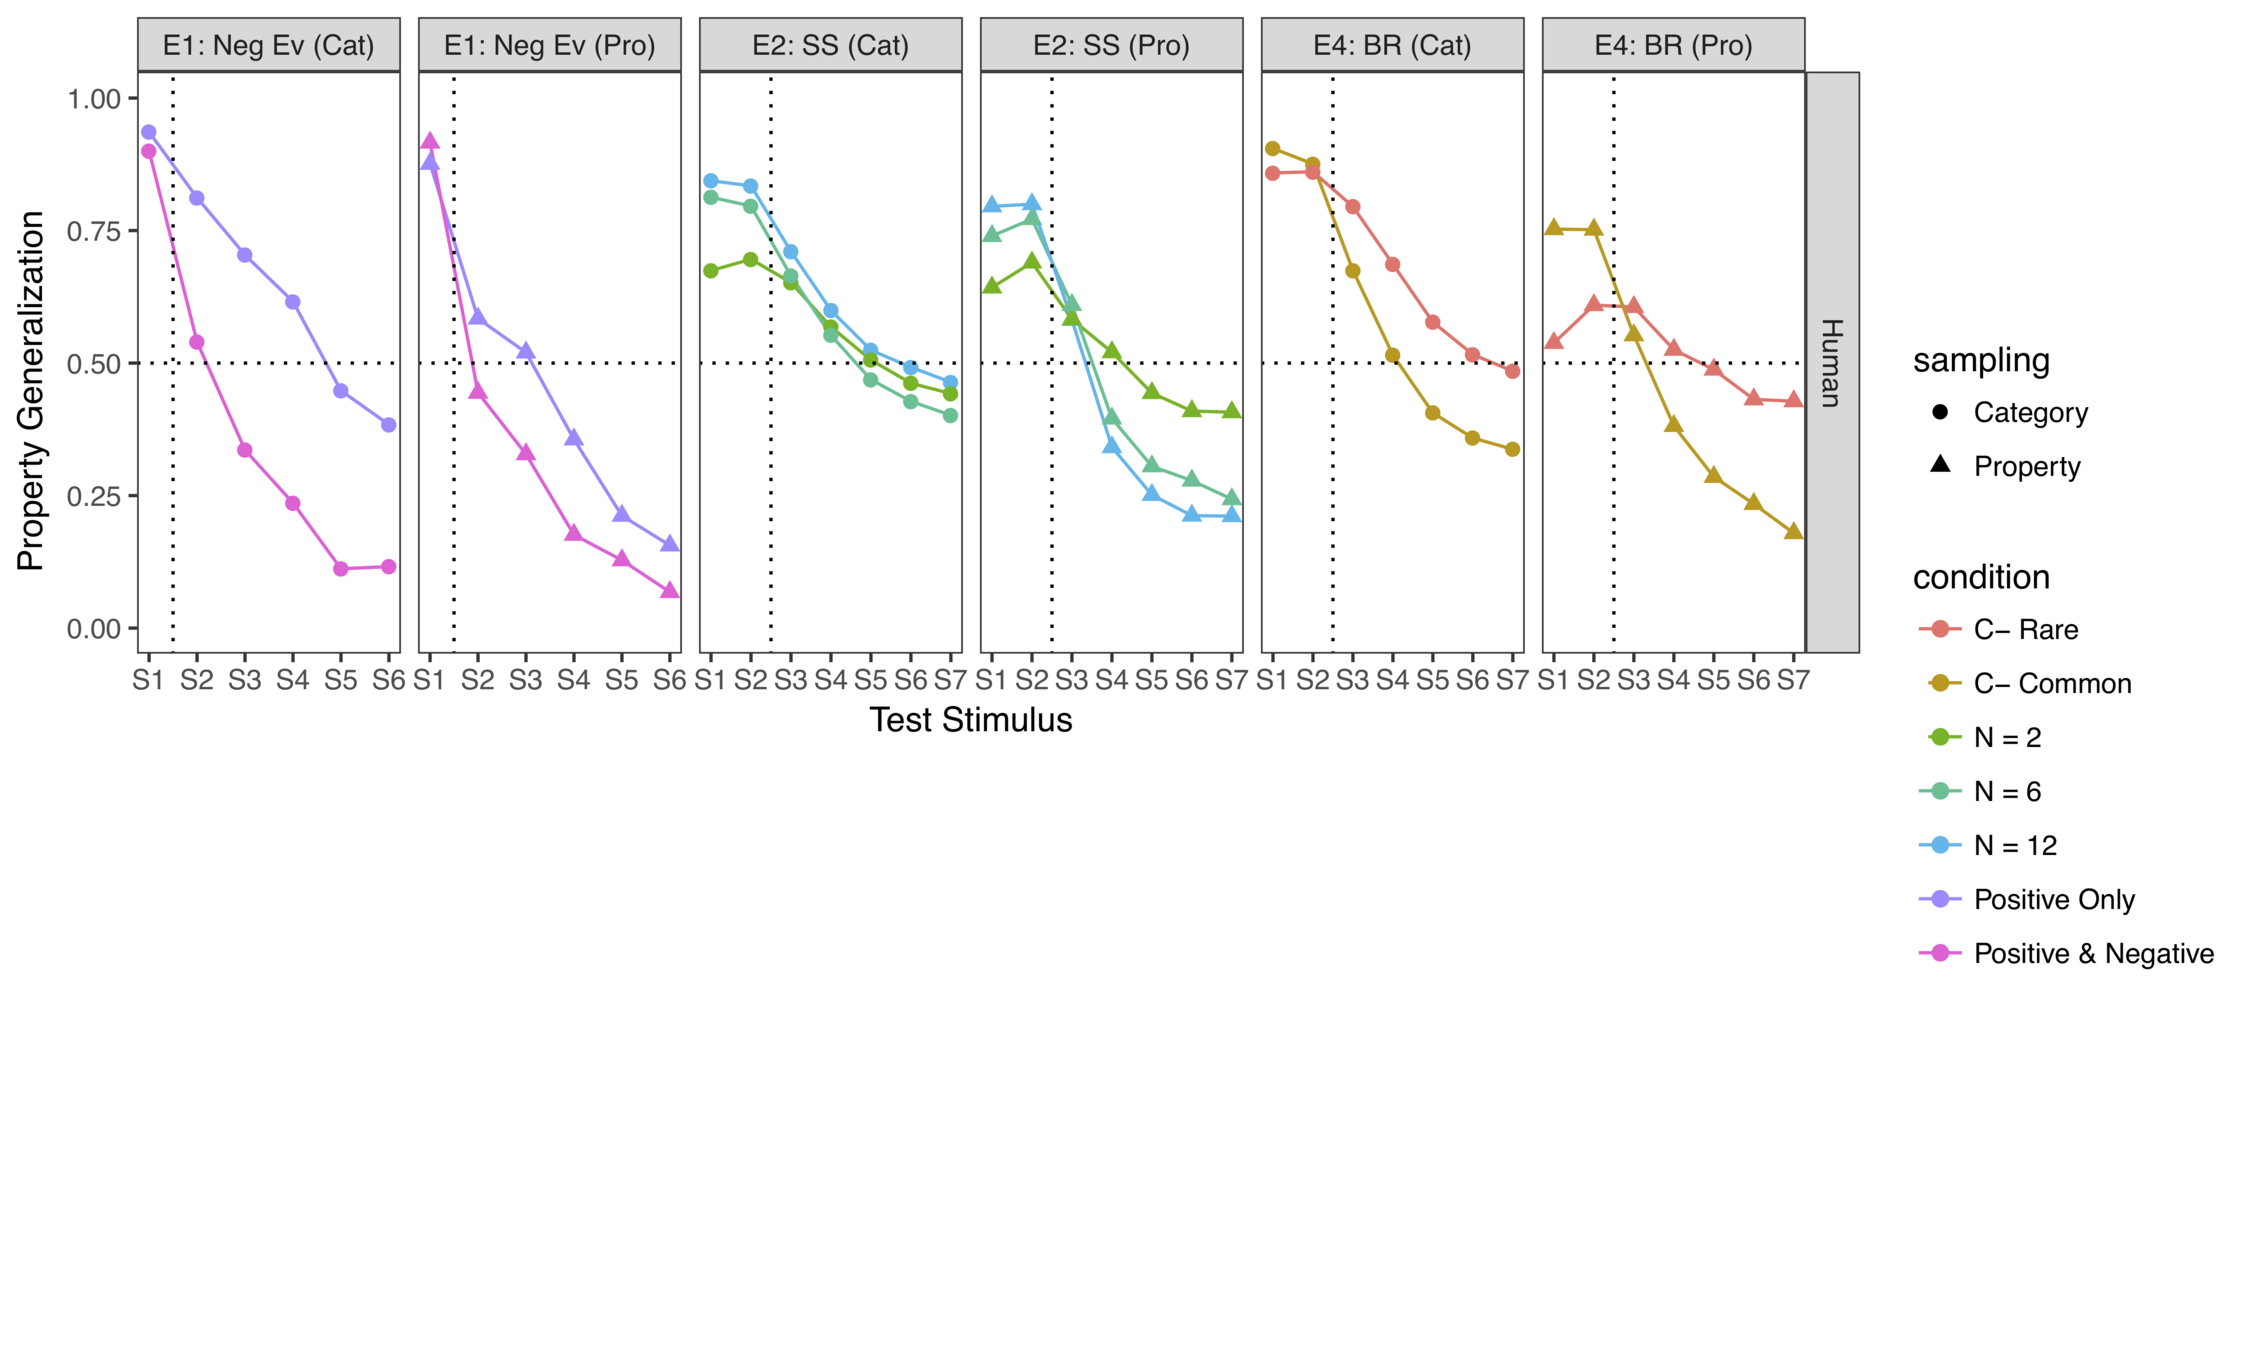
- 2 sampling types
- 2 evidence types
- 6 test points
- 2 sampling types
- 3 sample sizes
- 7 test points
- 2 sampling types
- 2 base rates
- 7 test points
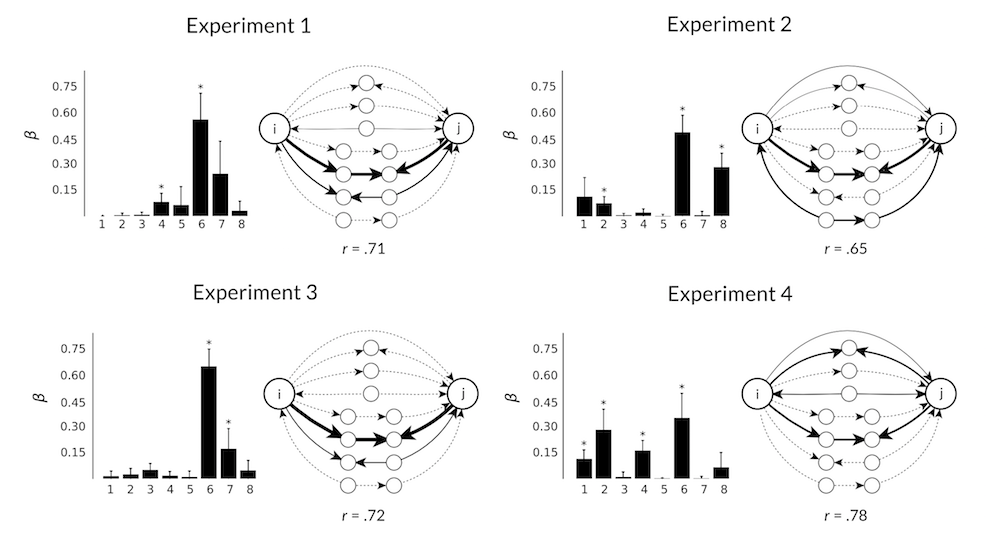
Some experiments...
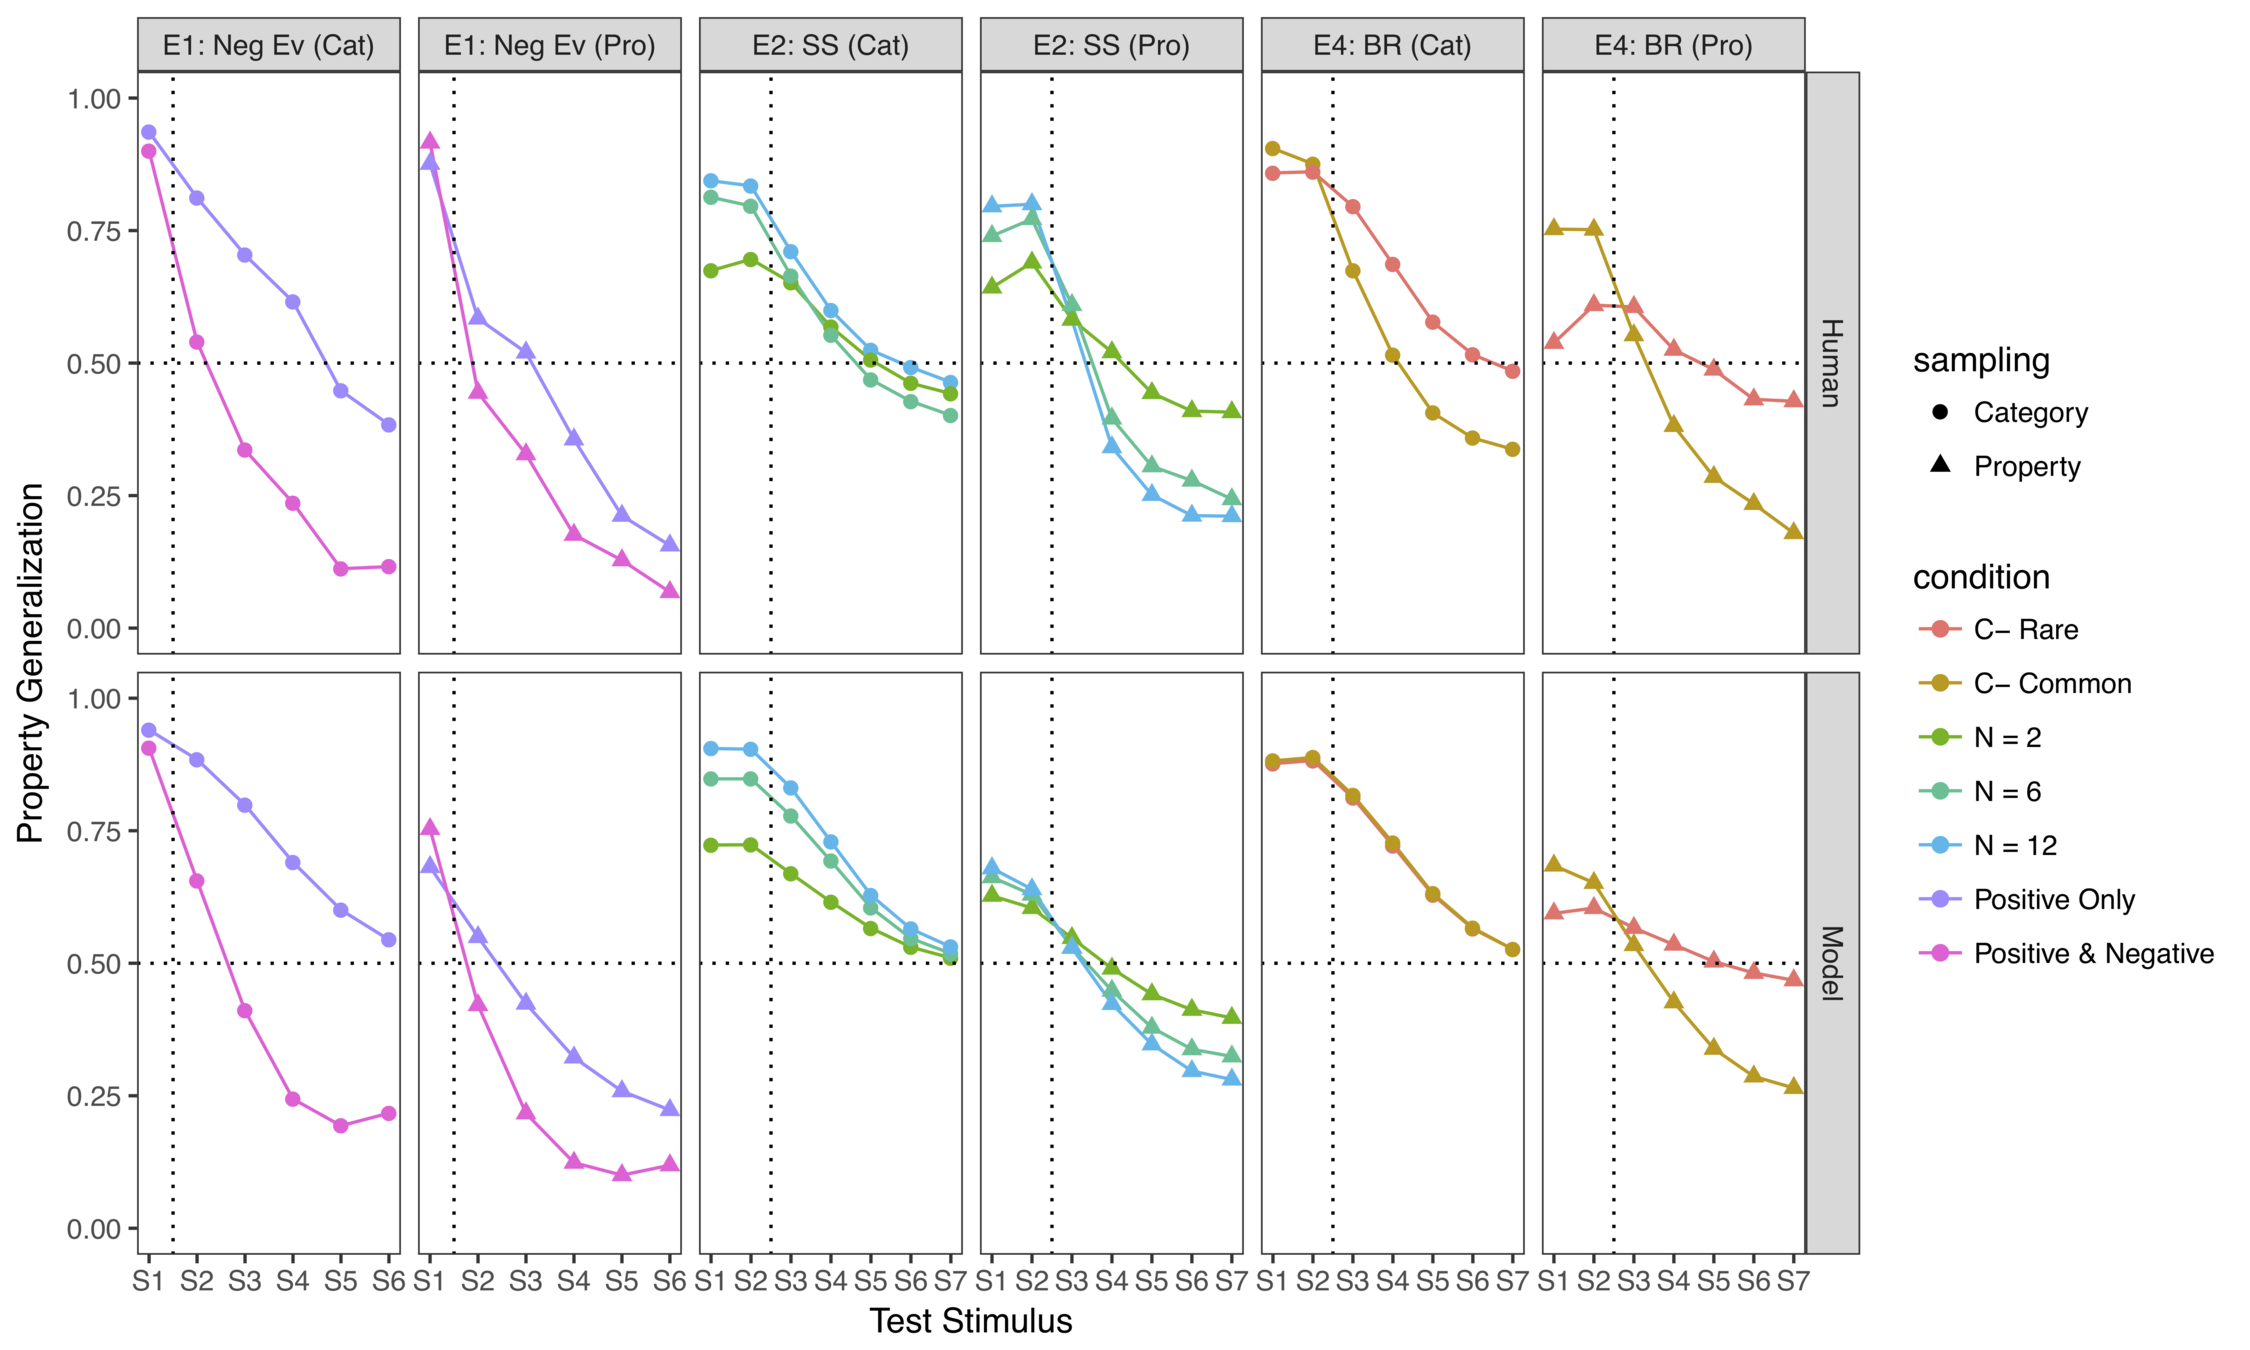
... and some model fits
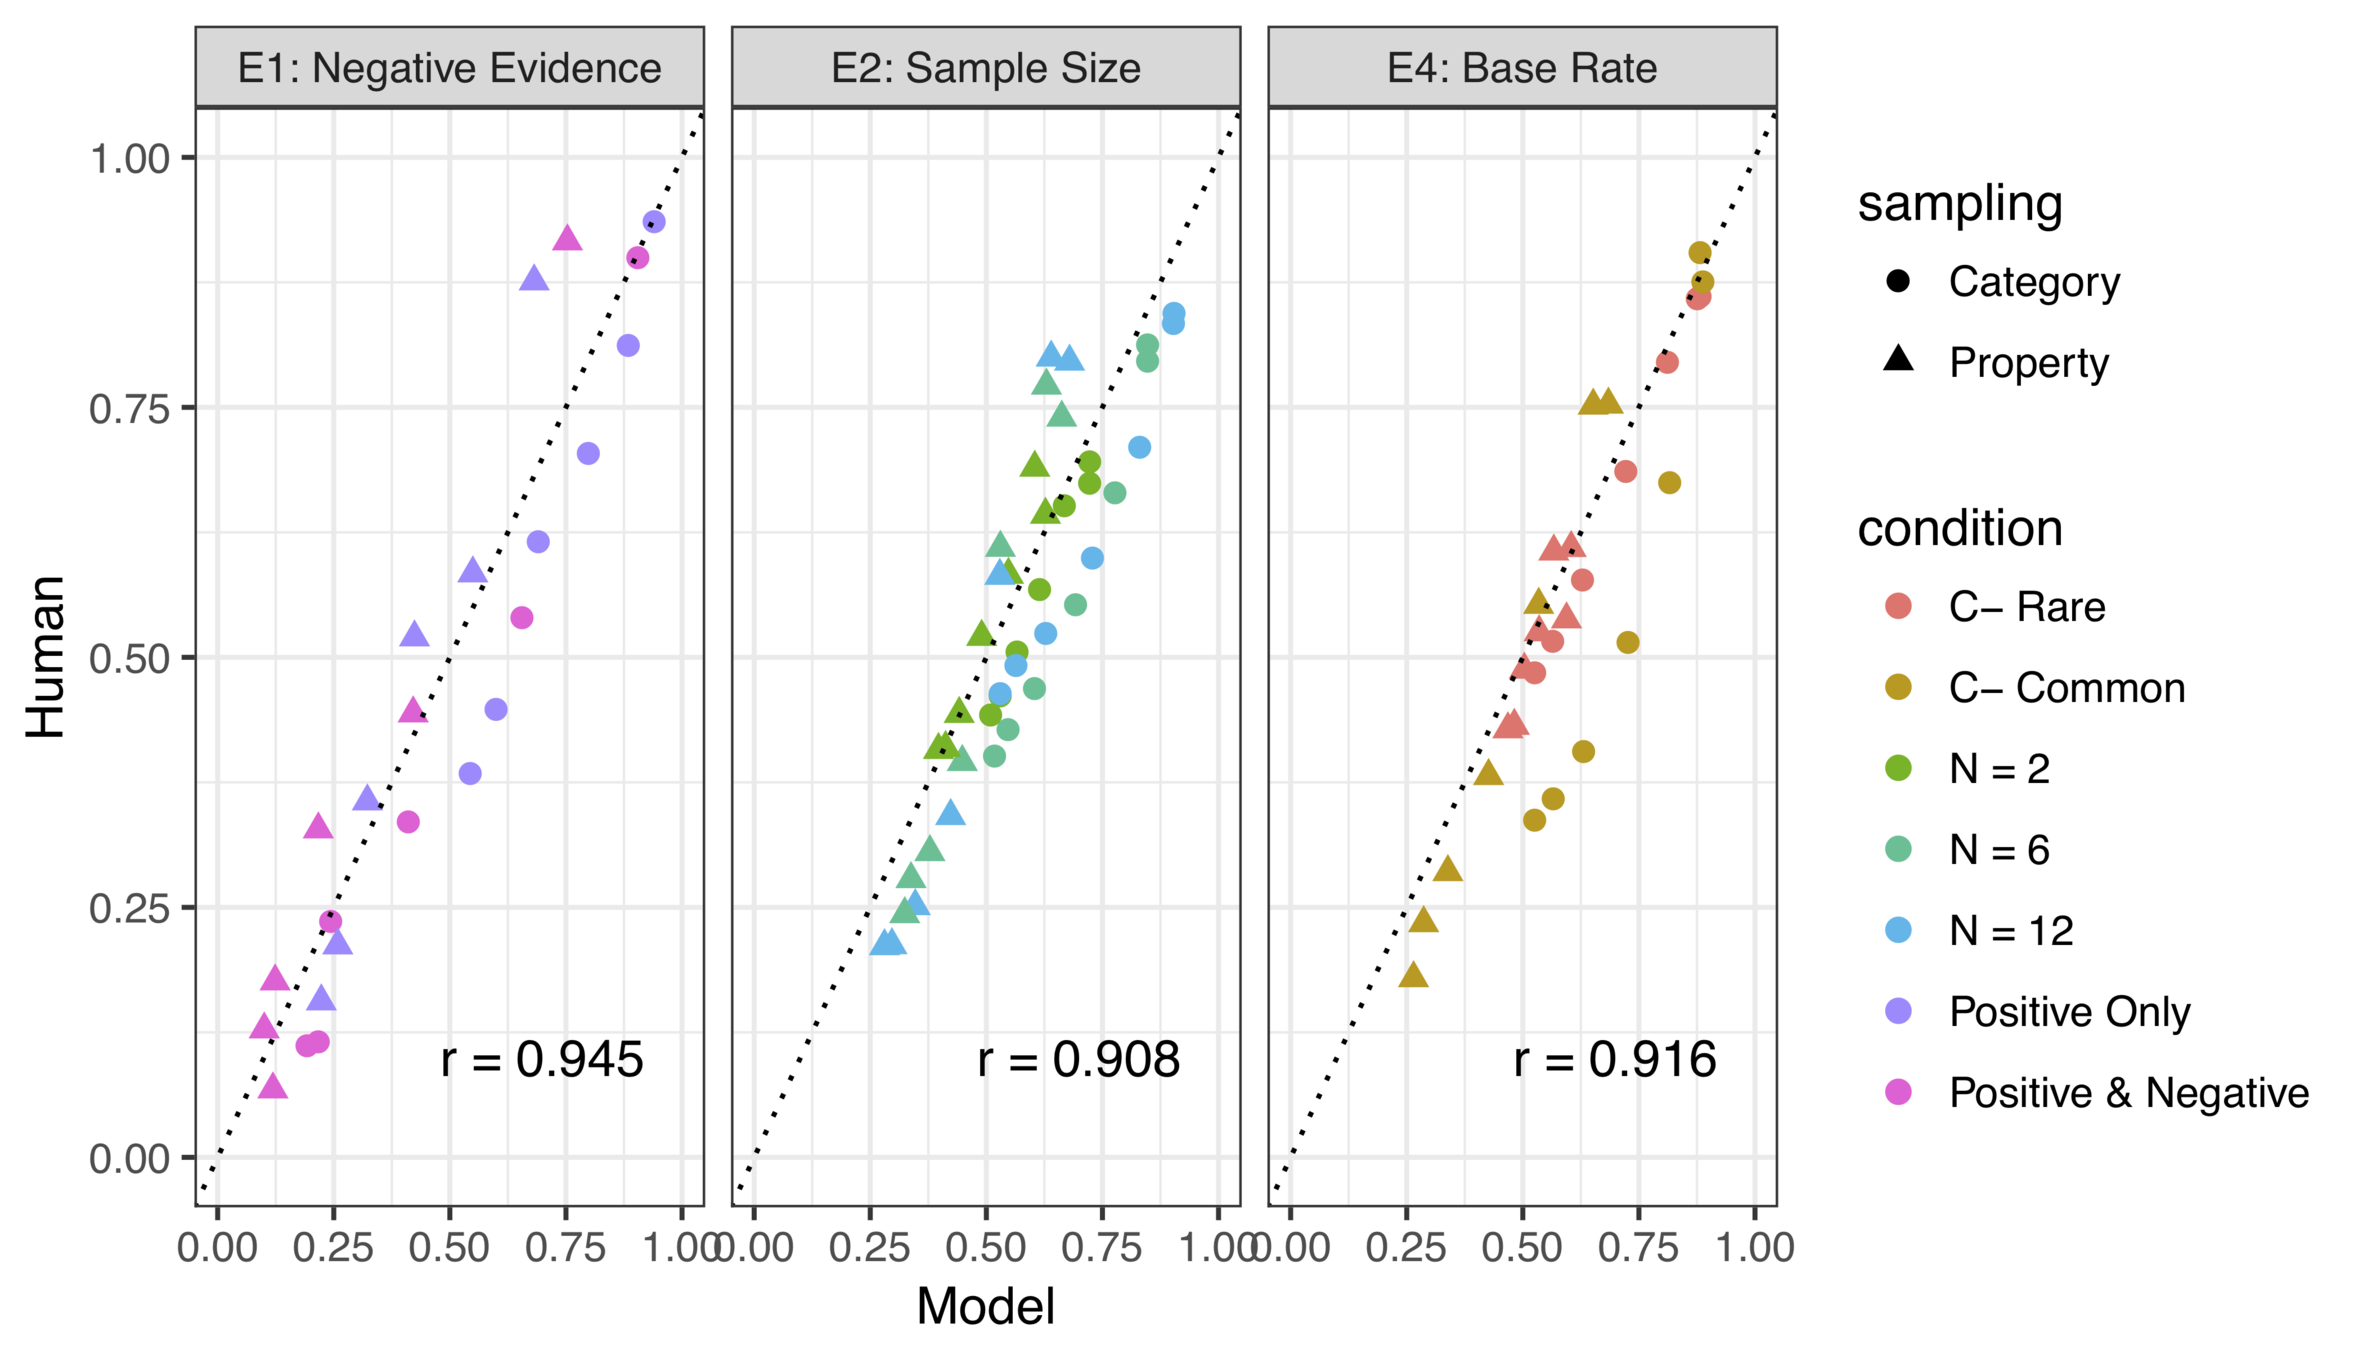
(there's a modest amount of parameter tuning required to get quantitative fits but the ordinal effects are invariant)
It works surprisingly well
What role did R play?
- Data tidying
- Data summary
- Drawing figures
- Linear modelling
- R Markdown
- Interface to JAGS
The usual things...
The less usual...
- String edits on JAGS models
- Robustness analysis for GP
2.2 Making choices with Kalman filters
image source: flaticon

- Four different slot machines?
- Four unknown restaurants?
- Four conference sessions?
Sequential decision problems
M1
M2
M3
M4
lose $5
win $2
lose $1
lose $1
Do you explore new options, or go with what worked?
Do you explore new options, or go with what worked?


win $2
lose $3
I've not used these machines recently, and someone else has taken them
I've concentrated recent bets on these machines
win $2
lose $5
A variation...
...option threat
Reinforcement learning with threatened options
1
2
3
4
5
6
7
8
chosen
viable option not chosen
someone takes the machine
someone takes the machine
Reinforcement learning with threatened options
Kalman filter model
Expected reward for option \(j\) on this trial
Uncertainty about reward for option \(j\) on this trial
Expected reward for option \(j\) on last trial
Uncertainty about reward for option \(j\) on last trial
Uncertainty drives Kalman gain
Kalman gain influences beliefs about expected reward and uncertainty
R implementation
  # Update the expected utility of the arm by applying a Kalman
  # filtering update rule. The model here does not learn any underlying
  # trend for the arm, nor does it learn the volatility of the environment
  mod$utilityUpdate <- function(current, chosen, gain, outcome) {
    current + chosen * gain * (outcome - current)
  }

  # Compute the Kalman gain
  mod$kalmanGain <- function(uncertainty, mod) {
    (uncertainty + mod$param["sigma_xi"]^2) /
      (uncertainty + mod$param["sigma_xi"]^2 + mod$param["sigma_eps"]^2)
  }

  # Update the posterior uncertainty associated with the arm, again
  # using the Kalman rule
  mod$uncertaintyUpdate <- function(current, chosen, gain, mod) {
    (1 - chosen * gain) * (current + mod$param["sigma_xi"]^2)
  }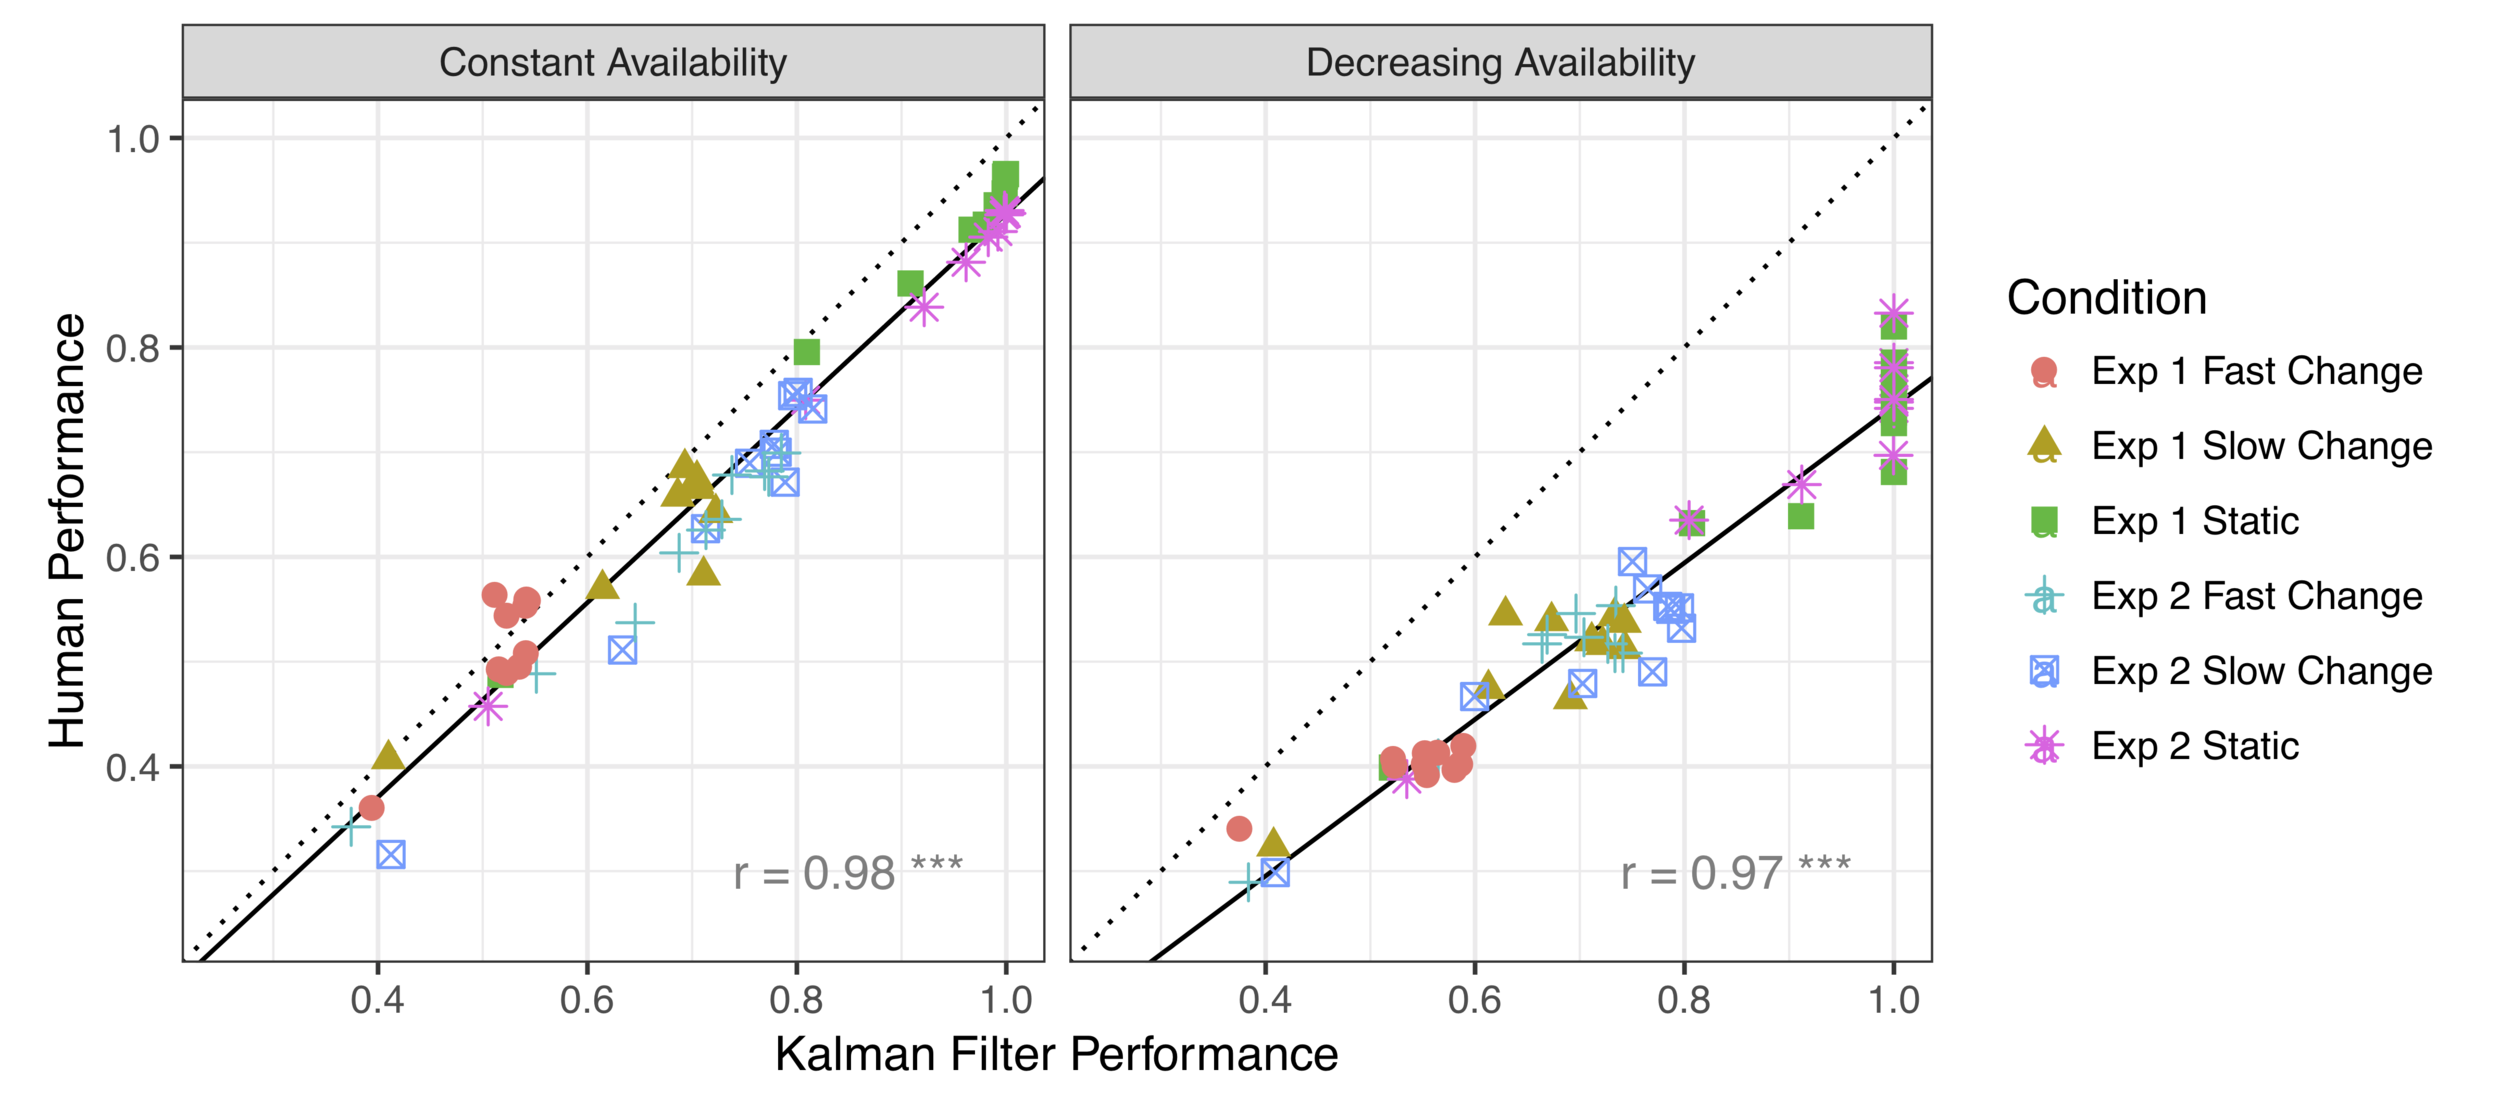
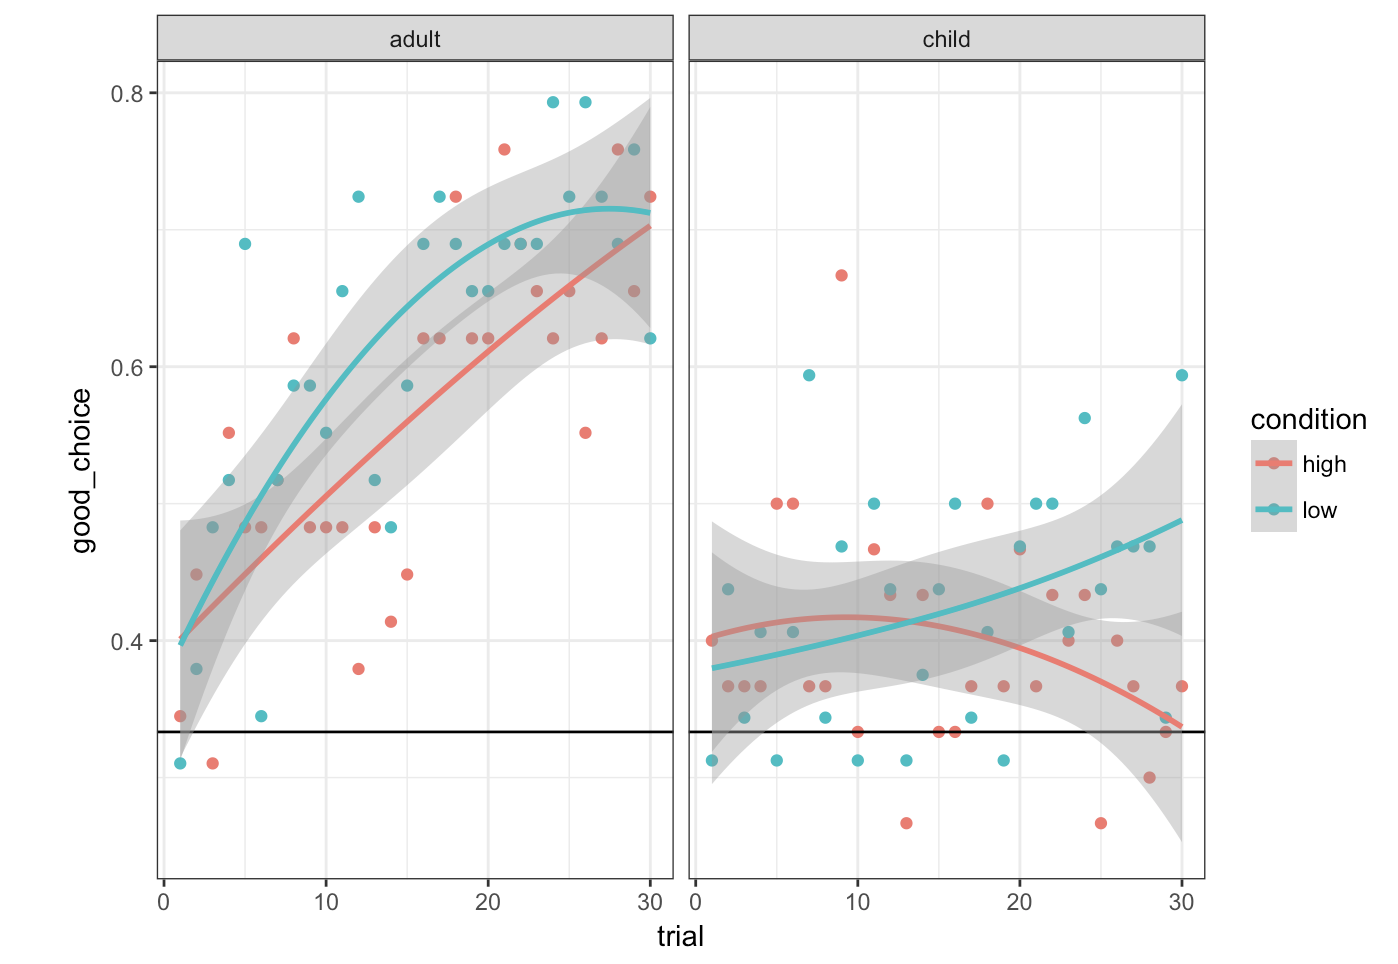
In the standard reinforcement learning task, human behaviour is closely approximated by the Kalman filter model
When the threat of option loss is added, systematic differences appear
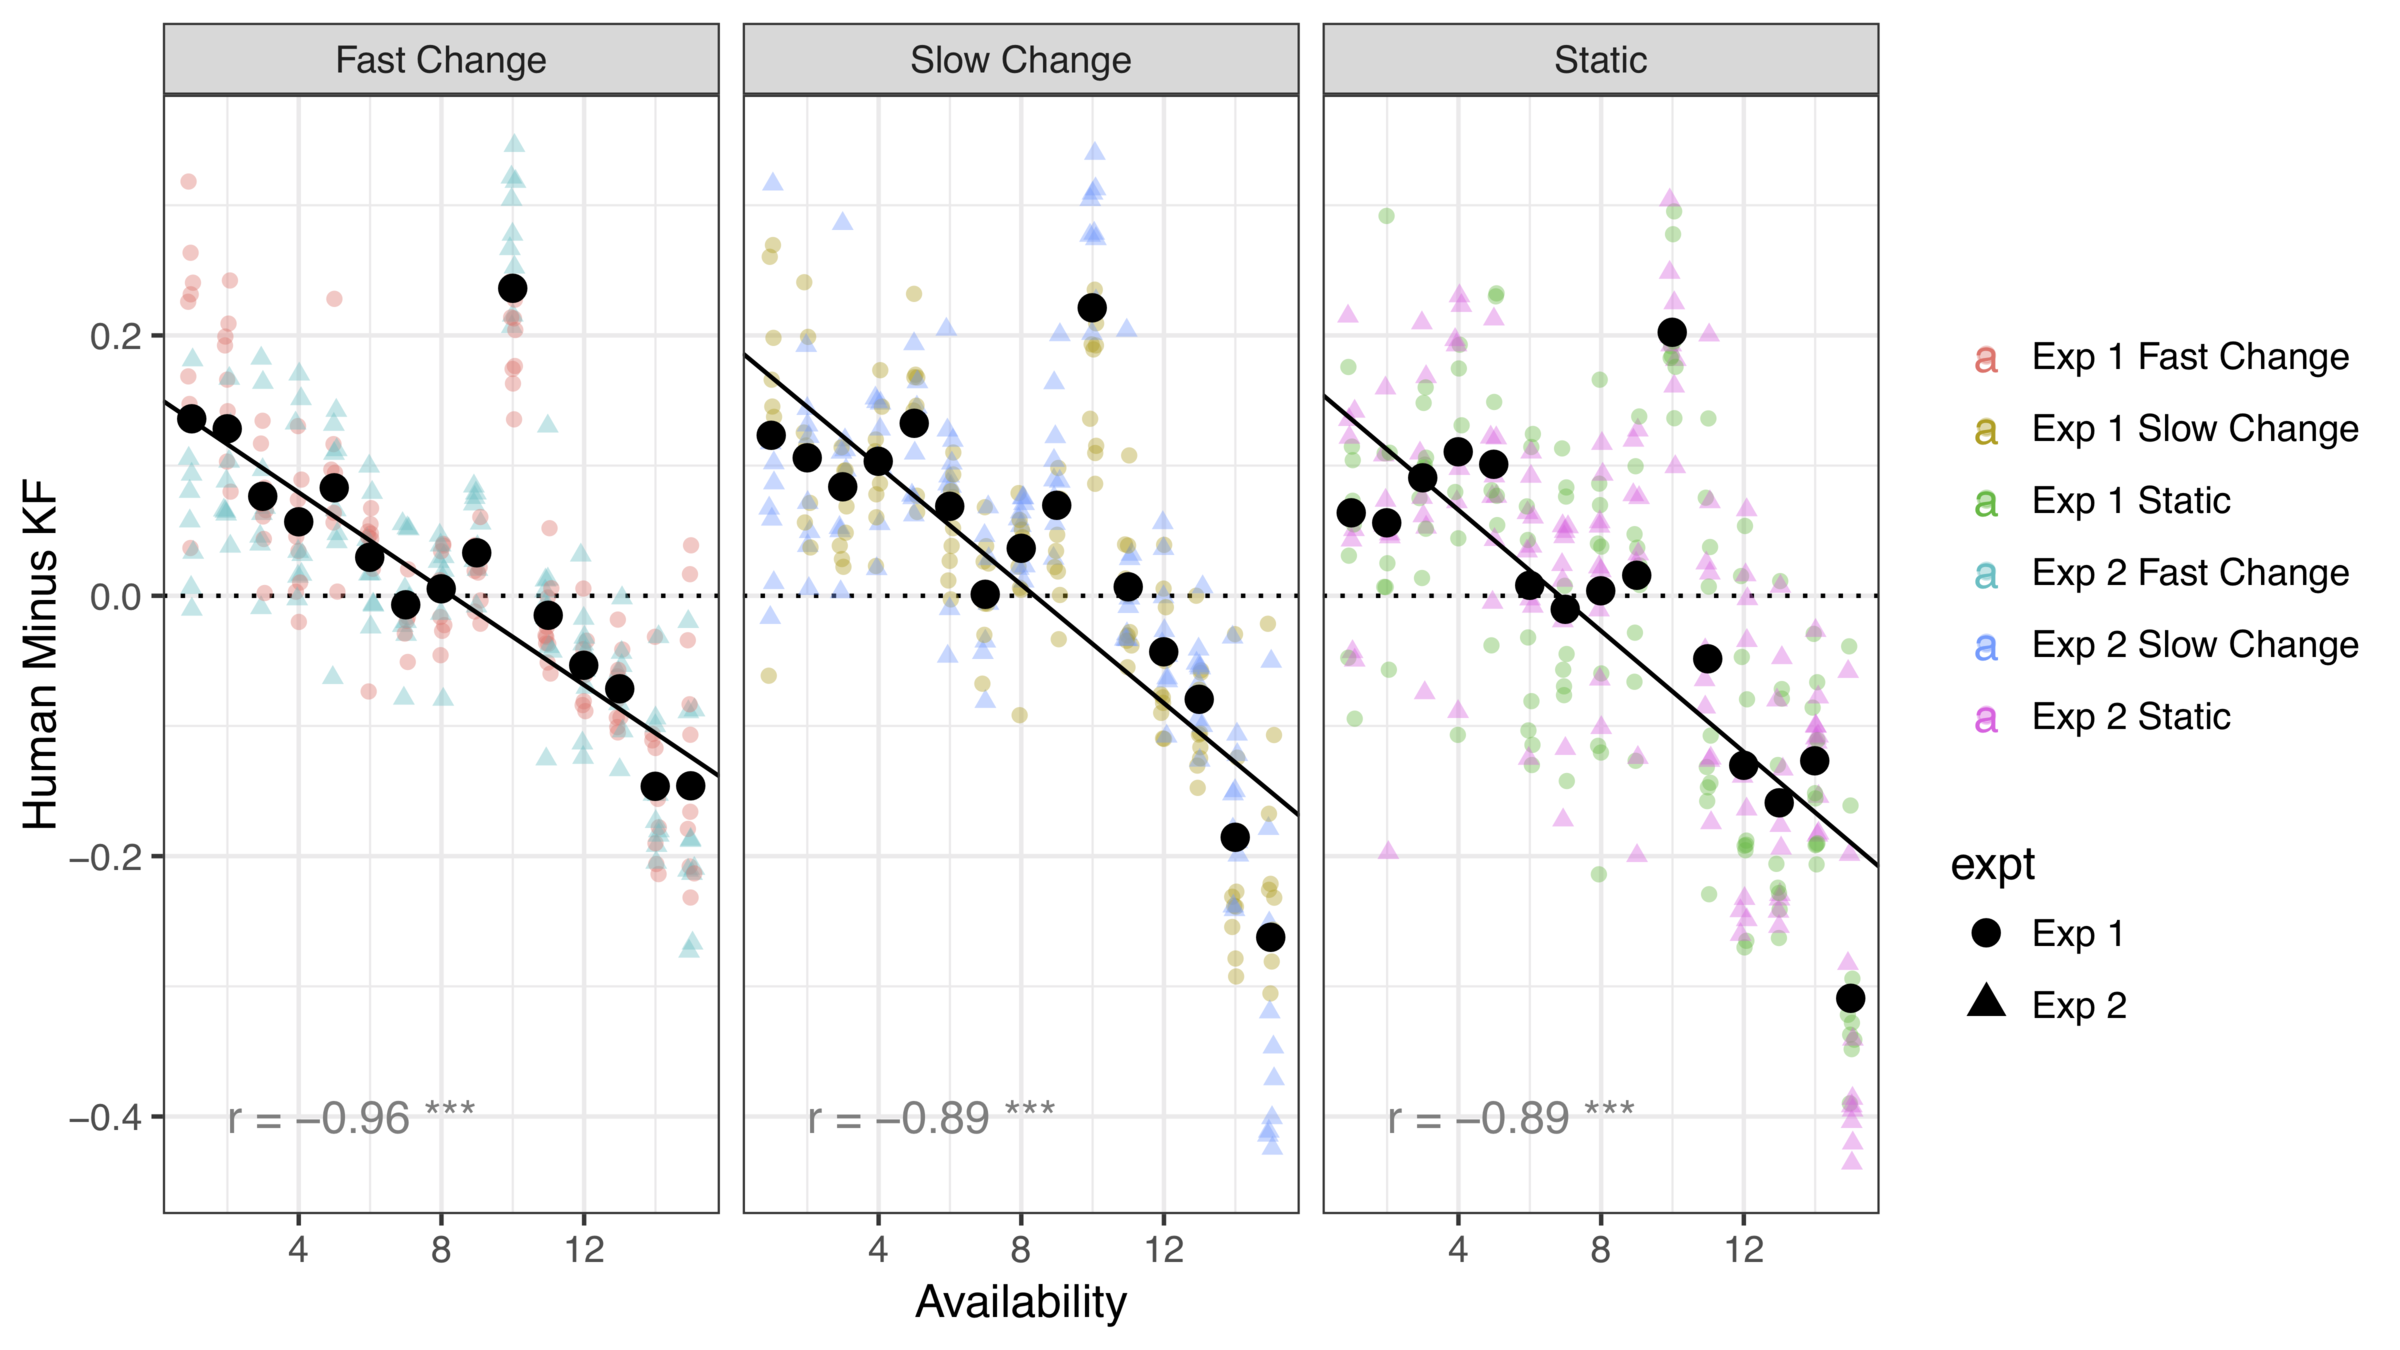
The effect is very systematic*
(* Yes, there's a data point missing. I'm hiding something)
What role did R play?
- Data tidying
- Data summary
- Drawing figures
- Linear modelling
- R Markdown
The usual...
- Simulations for study design
- Model implementation in R
The others...
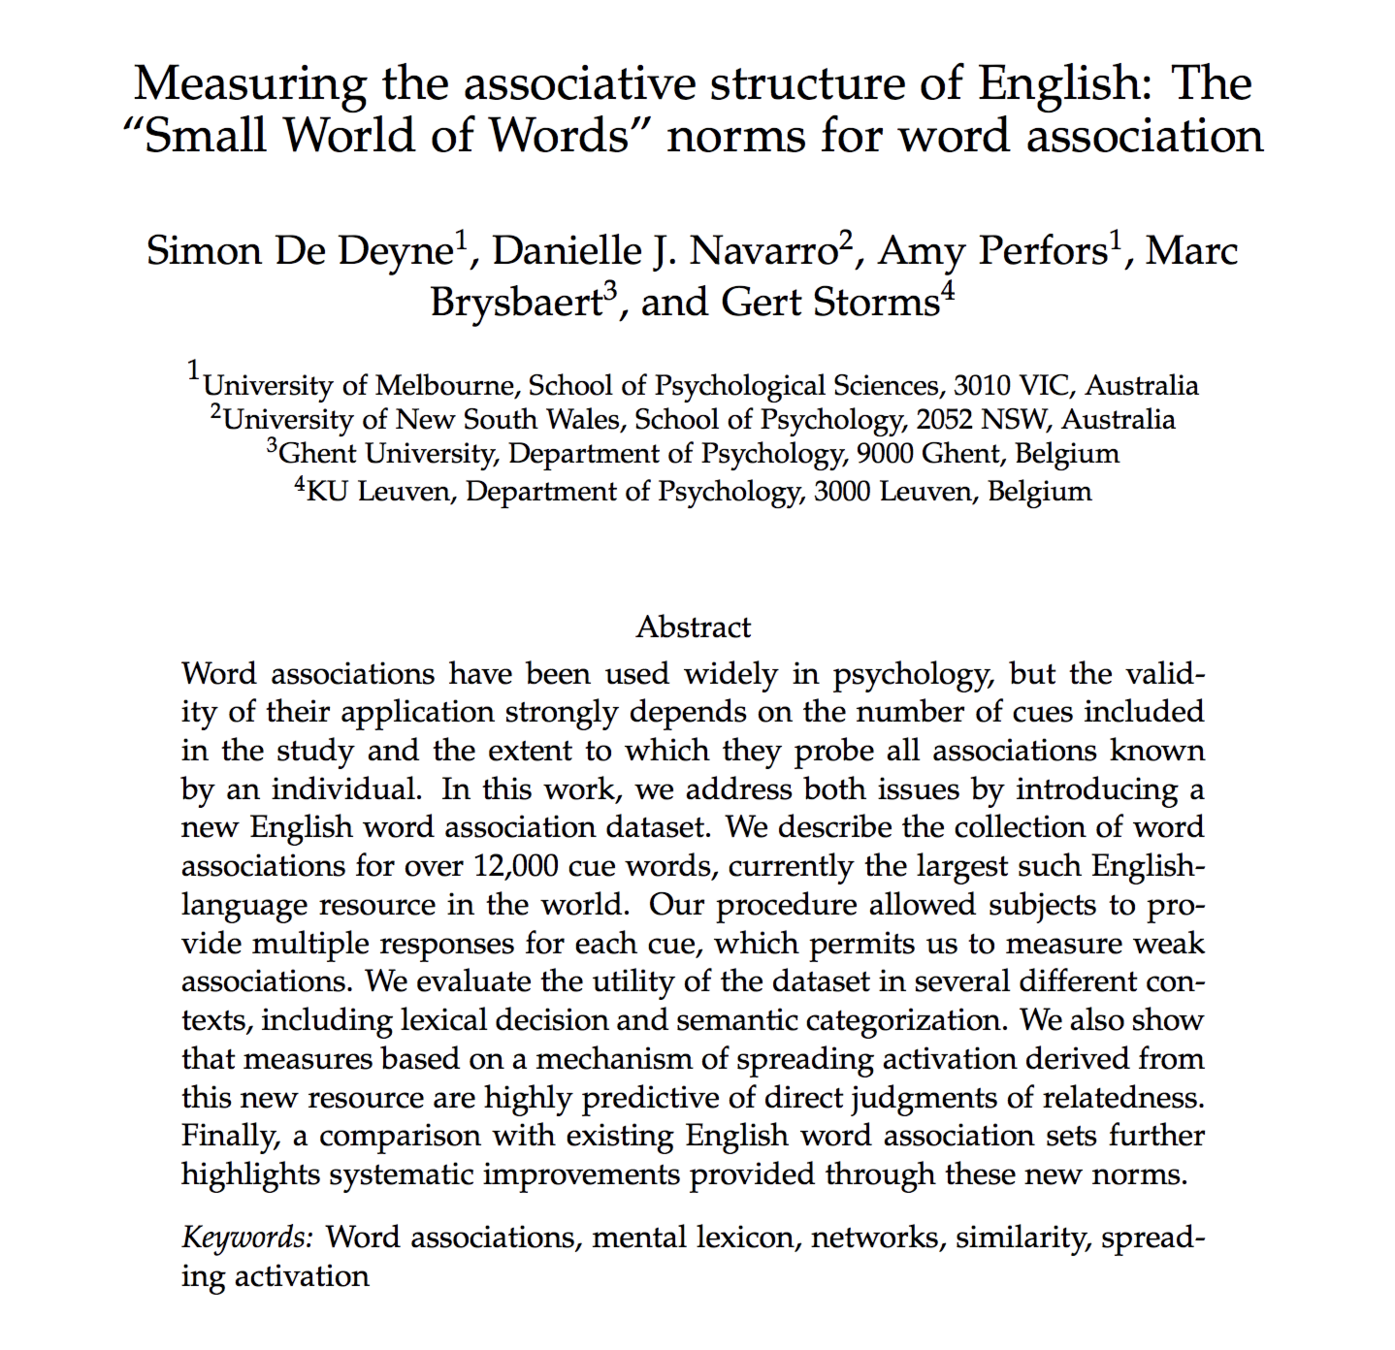
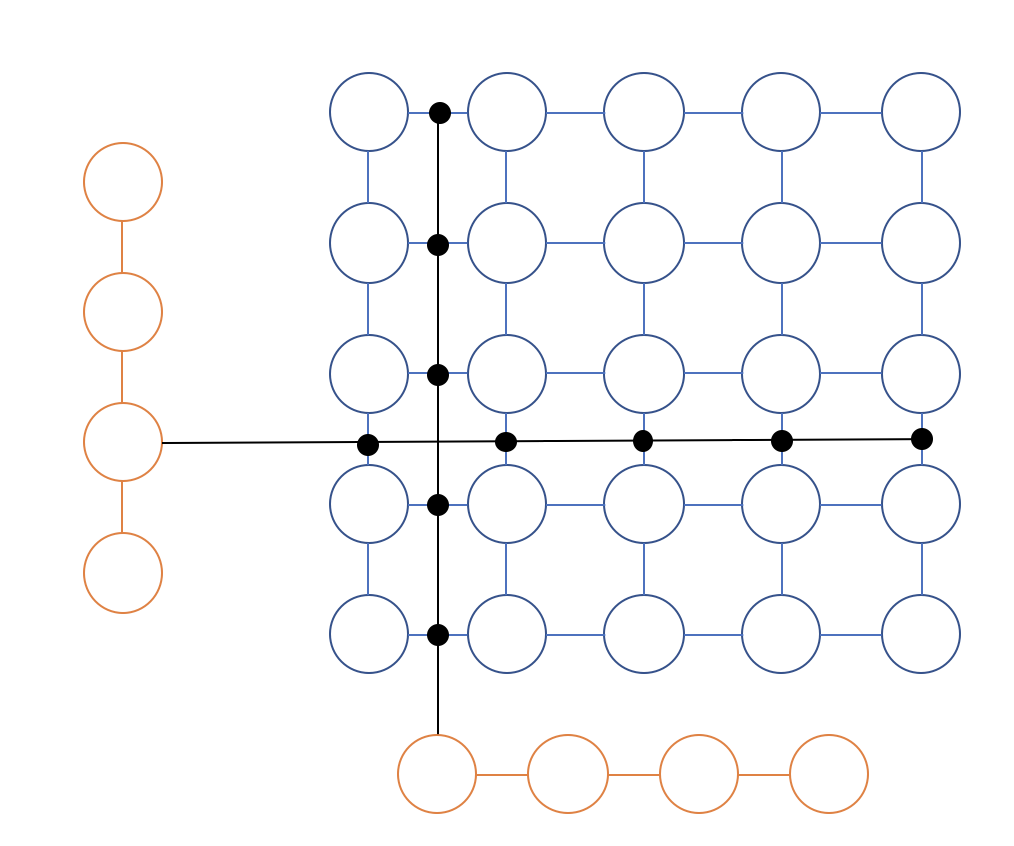
2.3 Free association with random walks
smallworldofwords.org

Free association
Coffee
Tea


(cue)
(response)
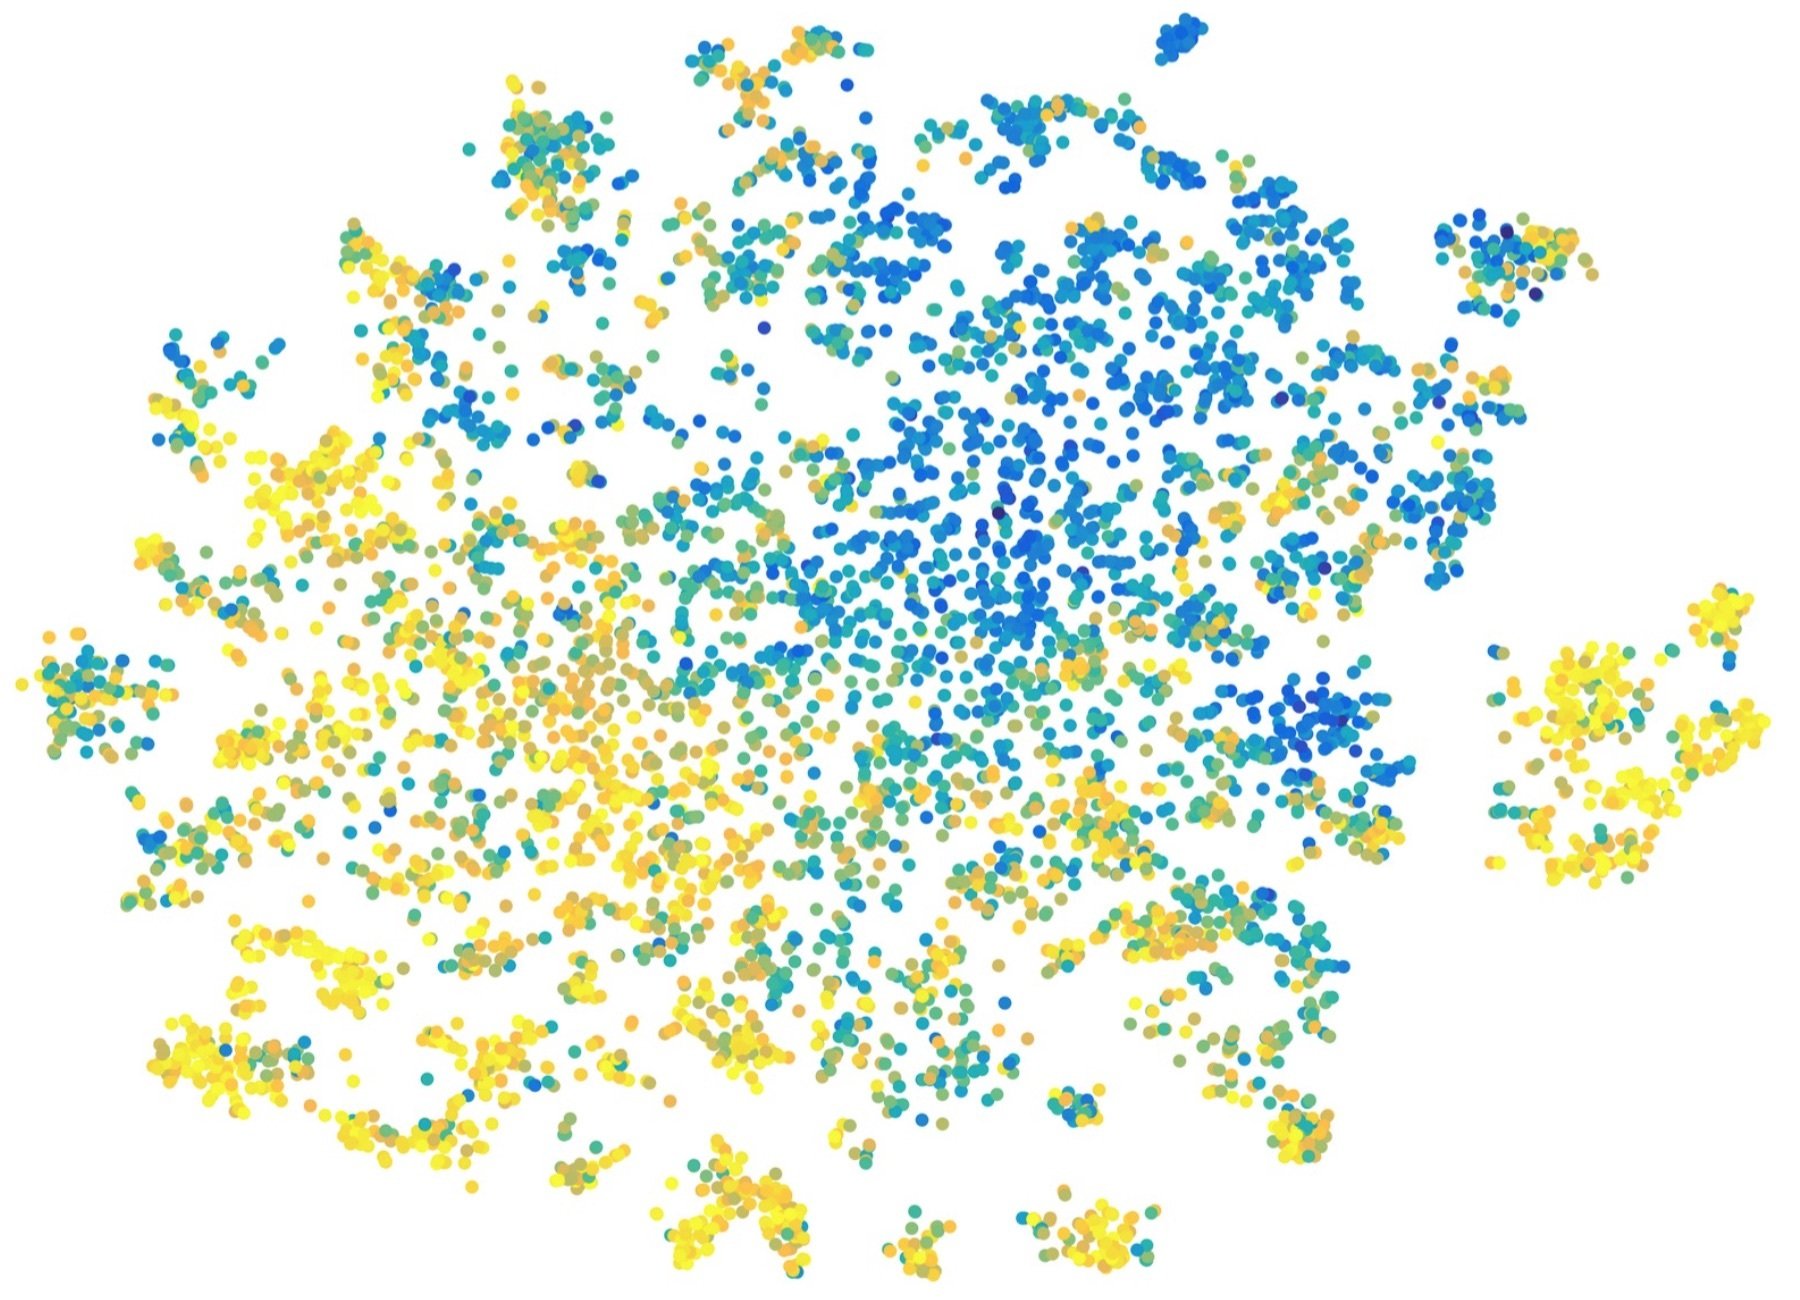
- 90,000 participants
- 12,000 words
- 4 million responses
https://smallworldofwords.org/en/project/visualize
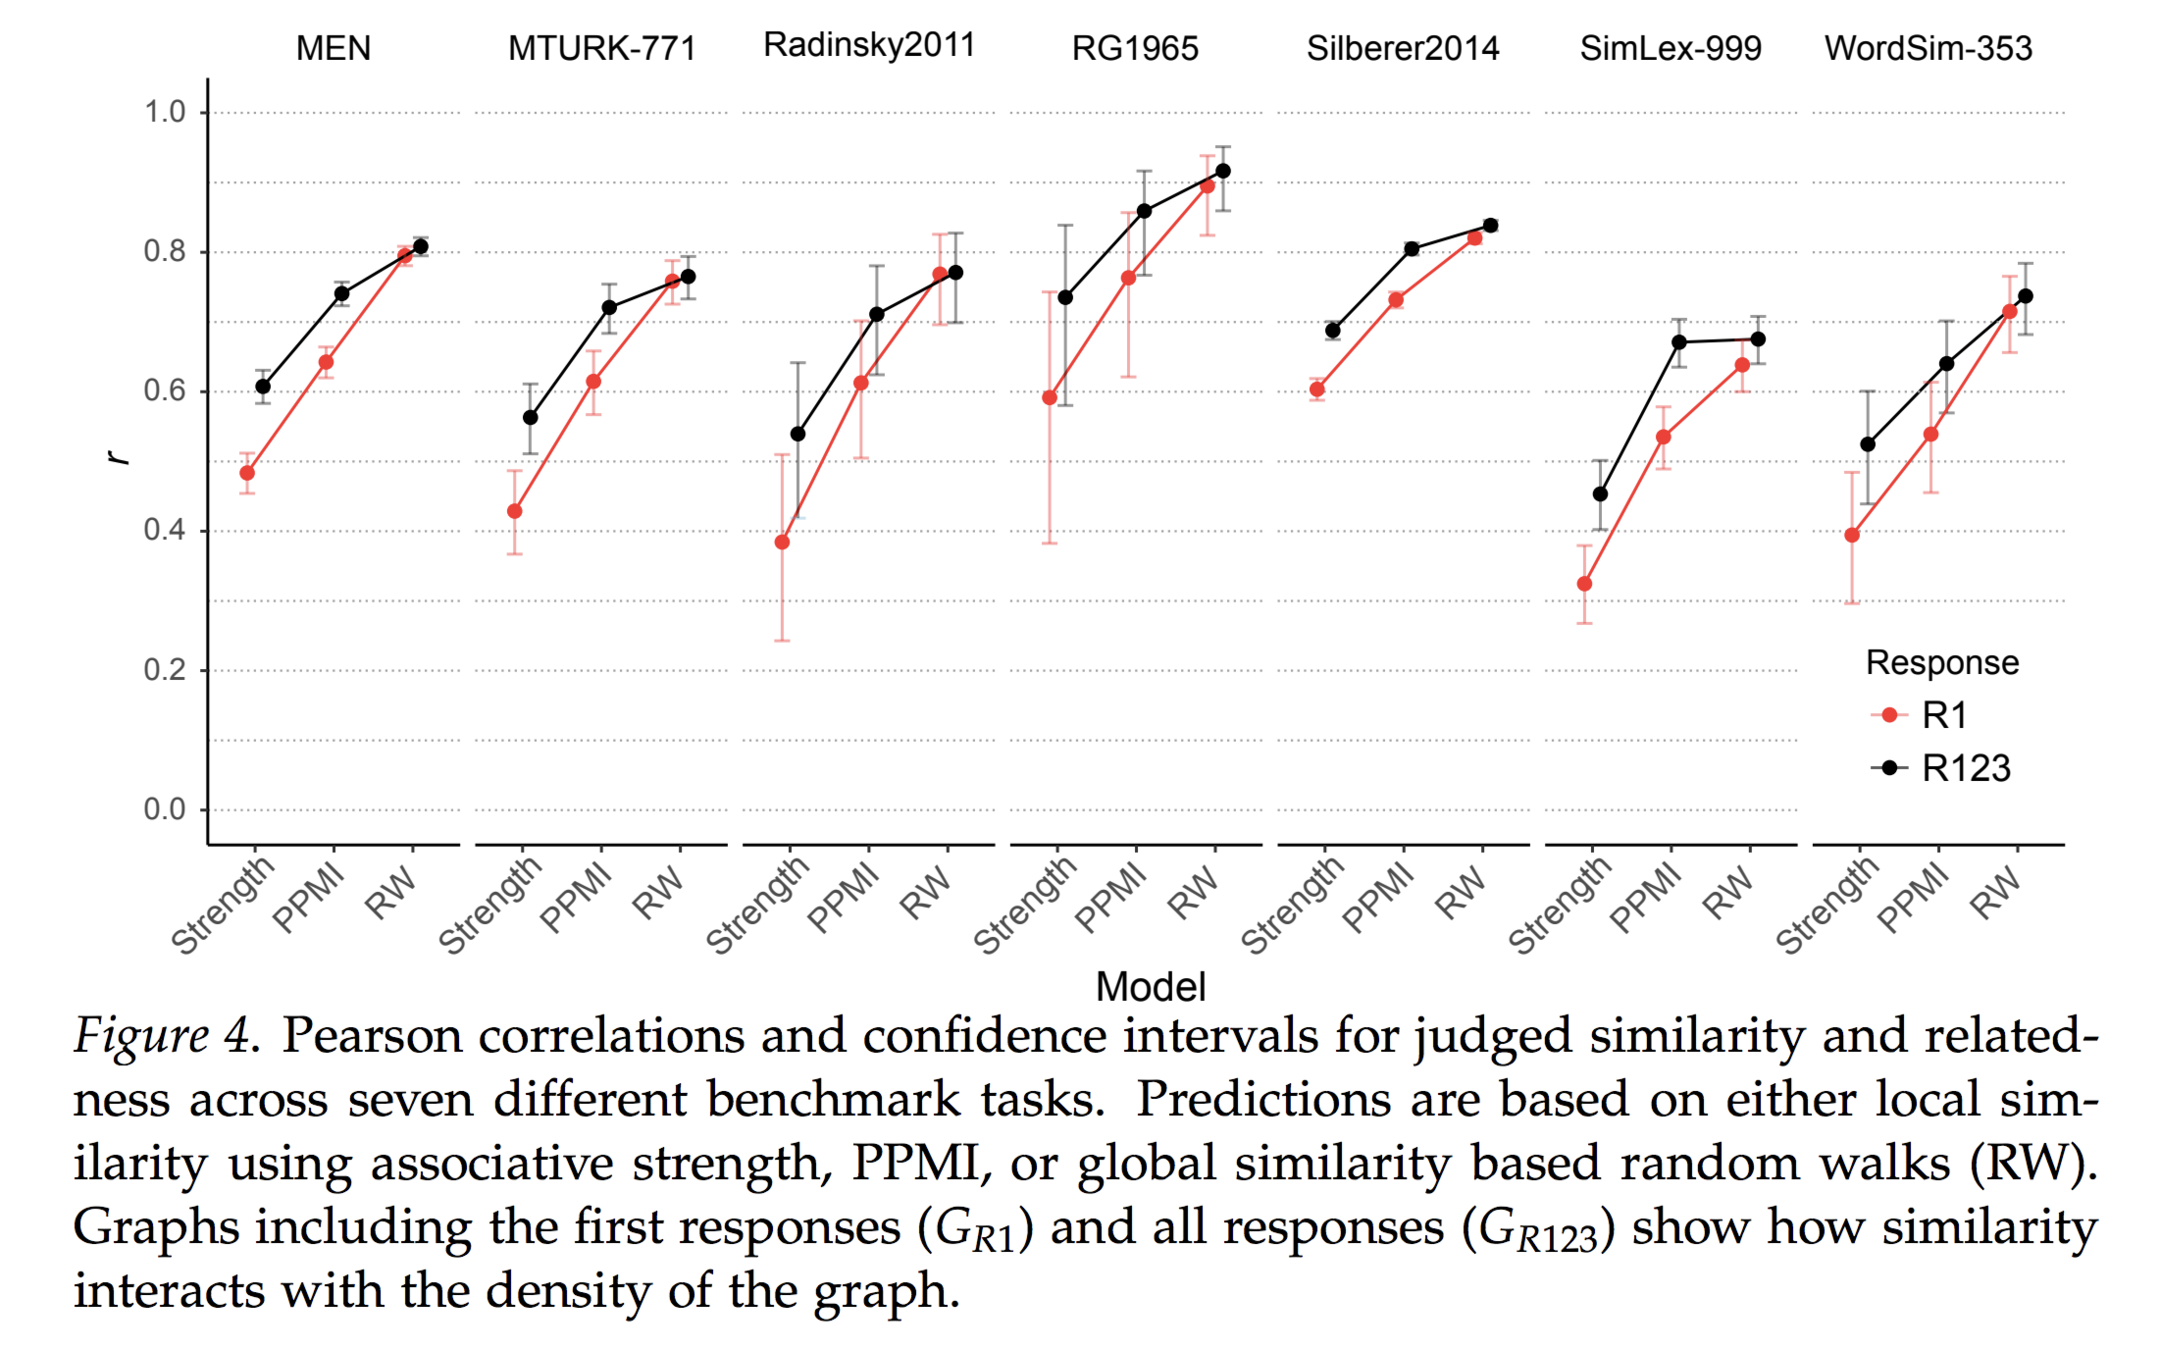
benchmarking... blah...
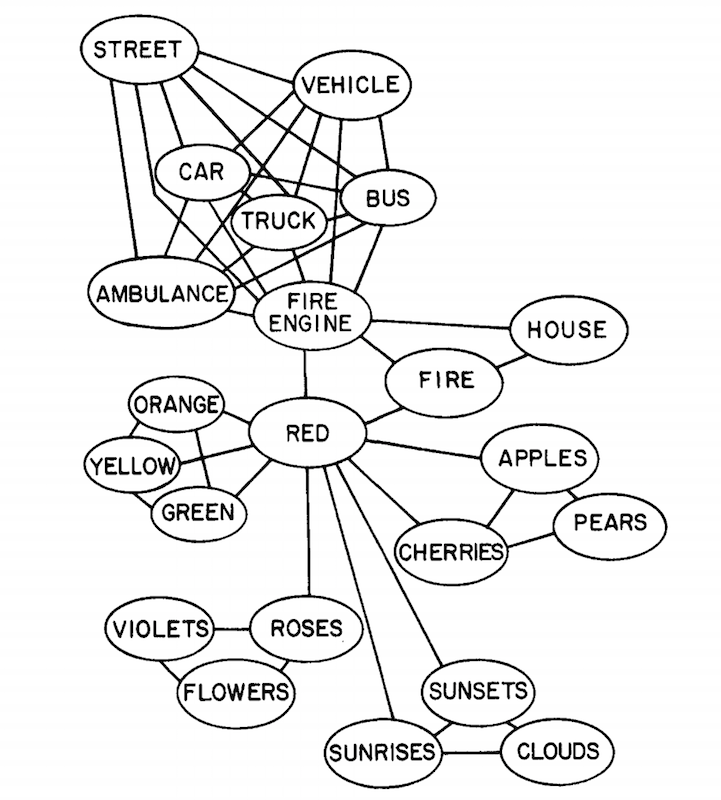
(Collins & Loftus 1975)
... historical context... blah...
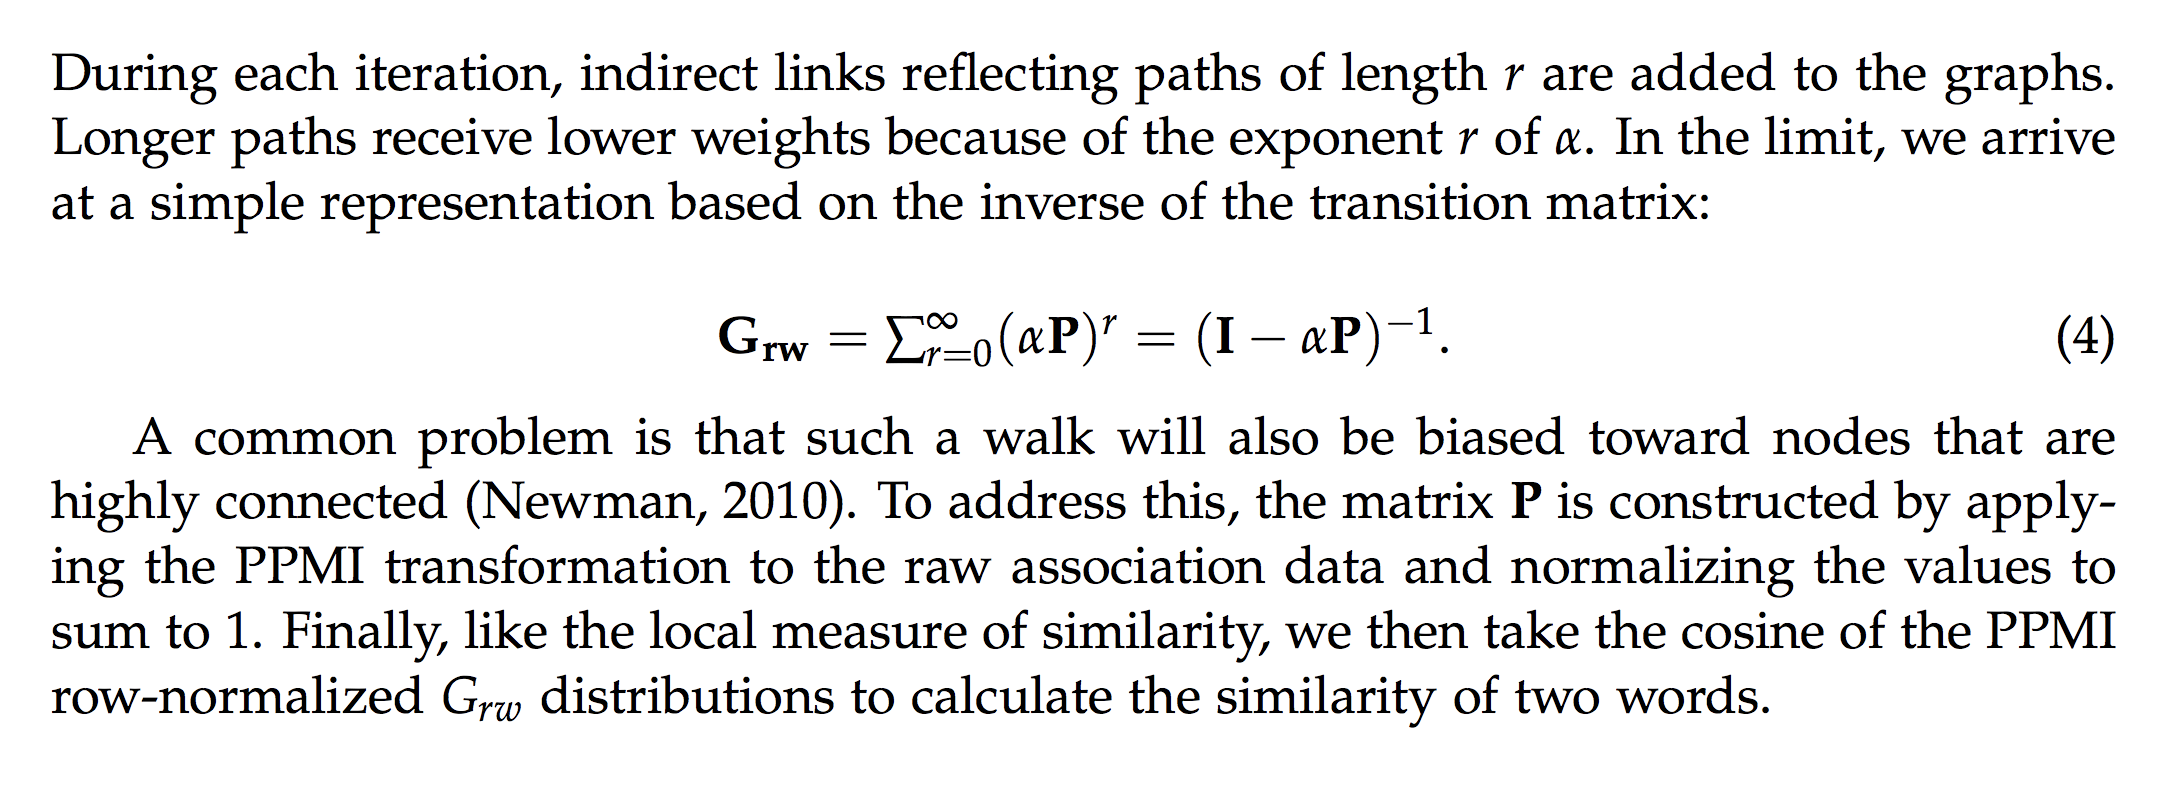
... stochastic processes on graphs ... more blah ...
Fun stuff!


similarity(rose, car)
similarity(cloud, house)
>
tl;dr - it kind of works!
What role did R play?
Useful at the margins
- Drawing figures
- Linear modelling
- Helpful with the small studies
My skill limitations?
- I don't know much about working with big data sets in R
- Suggestions appreciated!
R %>% psych() %>%
y_tho()
3. On advocating for R
to psychologists
Cast of characters

A cognitive psychologist with some experience with R

A grumpy psychometrician with a limited time budget

A social psychologist who wants to believe
Hey, I've been learning new things!
Awesome! What have you learned?
Hey, I've been learning new things!

I can add cat gifs to a plot?

I can draw pretty maps?
I can model associative learning as Bayesian inference over inhomogeneous Markov random fields?
Hello?
Hello? Was it something I said?
Photo by Sven Scheuermeier on Unsplash
Act I
Act II


A complicating factor:
Hey, how would you feel about posting research code to the web?
Oh hell no. People would call me stupid
What? You literally wrote a textbook on latent variable modelling and your Ph.D. research won a best paper award at Multivariate Behavior Research. You are not stupid
Yeah but my code has to be written in 20 minute consults and it's ugly. People are unkind about code
- Our code works (mostly), but it's ugly
- We have limited time & money
- It's difficult for us to make nice code, but at least we have some training
- You want me to put myself in the firing line too? Pfft
- Why should I do that????
- Byeeee....
Be kind:
- "Everyone you meet is fighting a hard battle"
- The code you see was written under unknown constraints
- Behavioural scientists aren't trained coders (any more than you are a behavioural scientist)
https://quoteinvestigator.com/2010/06/29/be-kind/

...But look, it's a long climb. Help me believe it's worthwhile
Okay, I'm back
Structural equations models? With Bayes?
Flexible experiments with Shiny apps?
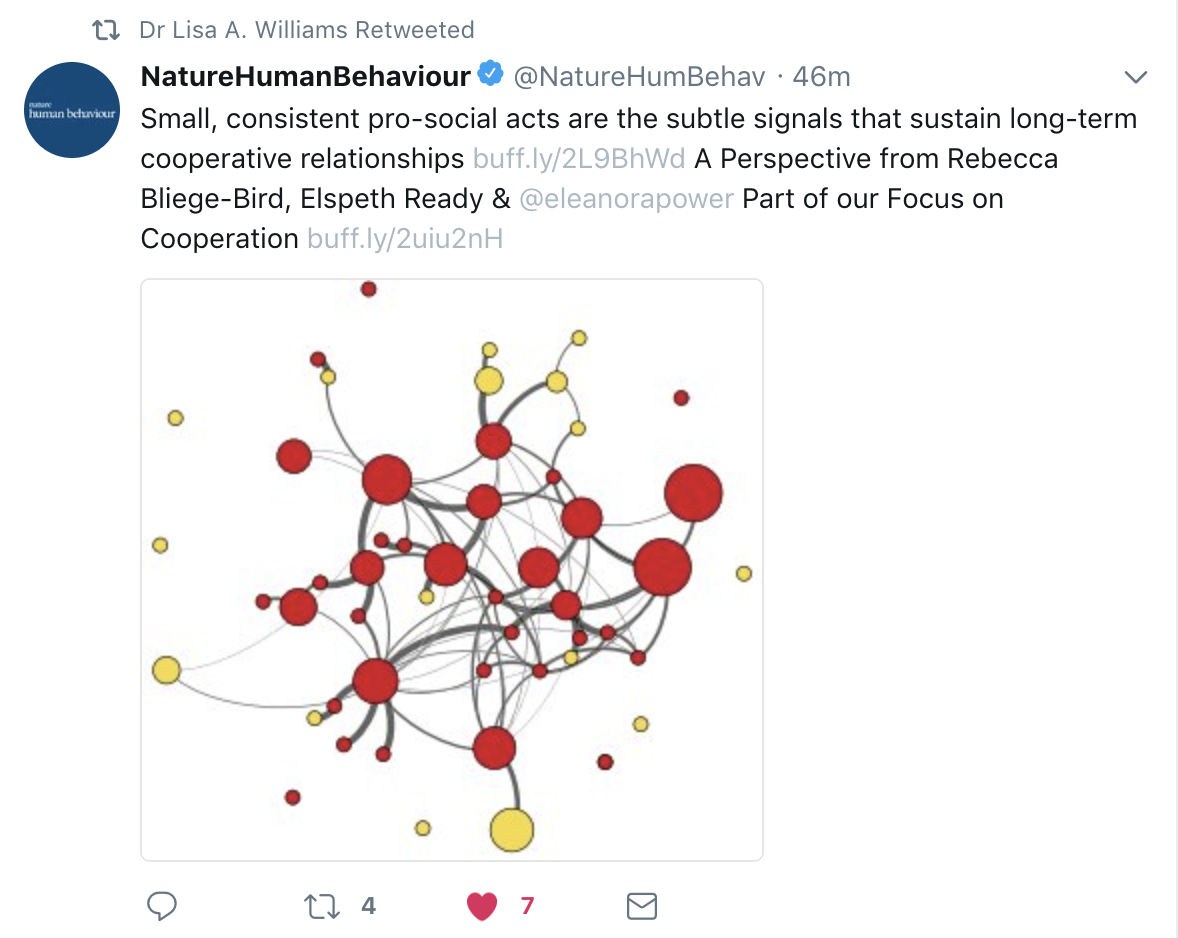
Social network analysis? With beautiful pictures?
Okay, I'm listening, but...
Better tools for reproducible research?
Which packages should I prioritise?
How will journal editors & reviewers respond?
How do I move my whole lab across?
Which packages?
Which packages?
Migration?
base R
tidyverse
jsPsych
Matlab
JASP
BayesFactor
.Rmd
SQL
lme
JAGS
Stan
base R
tidyverse
jsPsych
Matlab
JASP
BayesFactor
.Rmd
SQL
lme
JAGS
Stan

Even after 2.5 years at UNSW, integration of tools across different contexts is modest
Model selection via MDL principle, imposing a complexity penalty similar to a Bayesian approach with Jeffreys priors
You should use AIC

Reviews?
Hypothesis testing used a priori mapping of theoretically meaningful patterns onto order constrained inference problems
You need to run an ANOVA to test for interactions
Reviews?
We used package A
Everybody knows that package B is better
Reviews?
So... it's a long way to the top, someone might push me off a cliff, and my peers might not respect the effort if I make it?
(seriously, you are terrible at sales)
Well, maybe I exaggerate.
Still, it helps to climb with a team...


tidyverse
lme
git

BayesFactor
lavaan
car
Shiny
R markdown
knowing all the R
It can be hard to find a team within a single applied field...


#rstats
But there are people who will support you
Yay!
thank you!