Electrostatics
The influence of electric charges
The Electric Field
Electrostatics
The Electric Field
Learning Outcomes

Learn how to:
Calculate the electric field at a given point in space due to
- a configuration of point charges.
- a "continuous" distribution of electric charges.
Relate the electric field to
- the electric potential
- the electric force
Electrostatics
The Electric Charge
... and the rest of the cast

Electrostatics
The influence & interaction of electric charges
The Cast
potential
potential energy
field
force
charge
flux
influence
interaction
Electric ....
Electrostatics
The influence & interaction of electric charges
The Cast - relationship map
Electric ....
influence
interaction
Electrostatics
The influence & interaction of electric charges
The Cast - relationship map
Electric ....
influence
interaction
influence
interaction
gravitational....
analogus to
Electrostatics
The Electric Charge
Charge Distribution
Electrostatics
Electric Charge
Charge Distributions
Linear Charge Density
Surface Charge Density
Volume Charge Density
Electrostatics
Electric Charge
Point Charge
Charge distribution A
Charge distribution B
What do we mean by point charges?
Electrostatics
The Electric Field
due to a point charge
Electrostatics
The Electric Field
due to a point charge
The Electric Field due to a point charge is

given by ...
charge creating the field.
distance from the charge q to the point of interest P
unit-vector pointing away from the charge towards P
Electrostatics
The Electric Field
due to a point charge
charge creating the field.
distance from the charge q to the point of interest P
unit-vector pointing away from the charge towards P

Electrostatics
The Electric Field
due to a point charge
charge creating the field.
distance from the charge q to the point of interest P
unit-vector pointing away from the charge towards P
Electrostatics
The Electric Field
Example

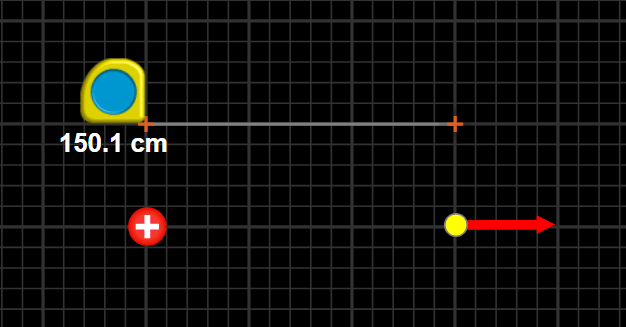
Find the magnitude and direction of the electric field.
Electrostatics
The Electric Field
Example
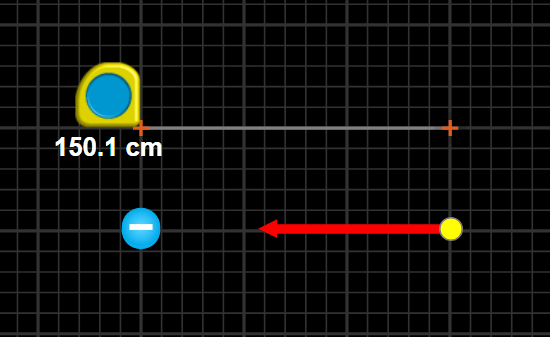
Find the magnitude and direction of the electric field.
Electrostatics
The Electric Field
Example
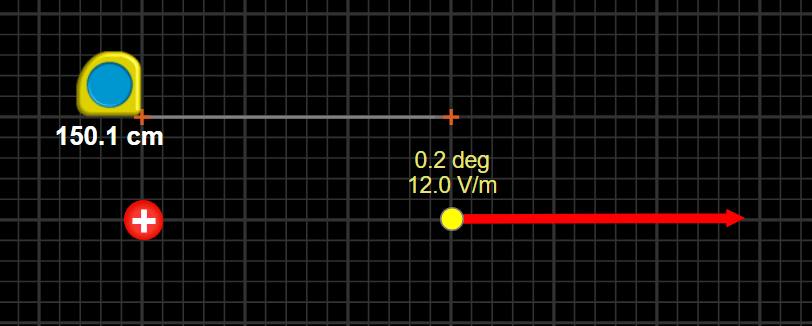
Find the magnitude of the charge generating the field.
Electrostatics
The Electric Field
Example
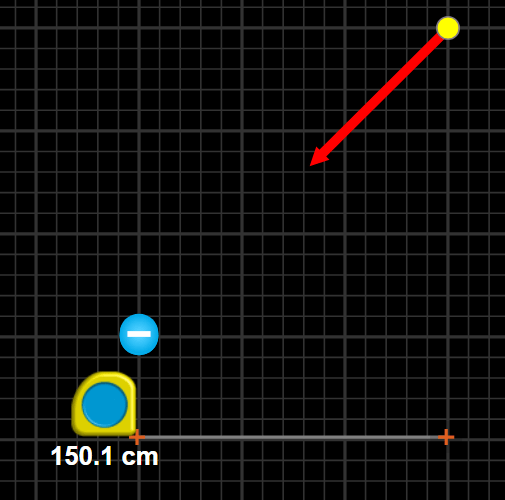
Find the magnitude and direction of the electric field.
Electrostatics
The Electric Field
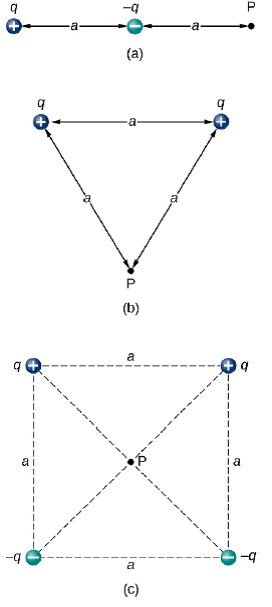
due to a configuration of point charges
Electrostatics
The Electric Field
Multiple point charges
Electrostatics
The Electric Field
Representation and Visualization
Electrostatics
The Electric Field
Visualizing the Electric Field
In this simulation, the electric field is represented on a grid by arrows whose color indicates their magnitude.
The yellow sensors detect the magnitude and direction of the electric field at any given point in space.
Electrostatics
The Electric field
Visualizing the Electric Field
In this simulation, you can switch between presenting the field as vectors (arrows) or by electric field lines (EFLs).
The electric field lines follow the vectors in tip-to-tail sequence.
Electrostatics
The Electric Field
The Electric Field Lines
Electrostatics
The Electric Field
Electric Field Lines and Equipotential Surfaces
The "landscape" analogy
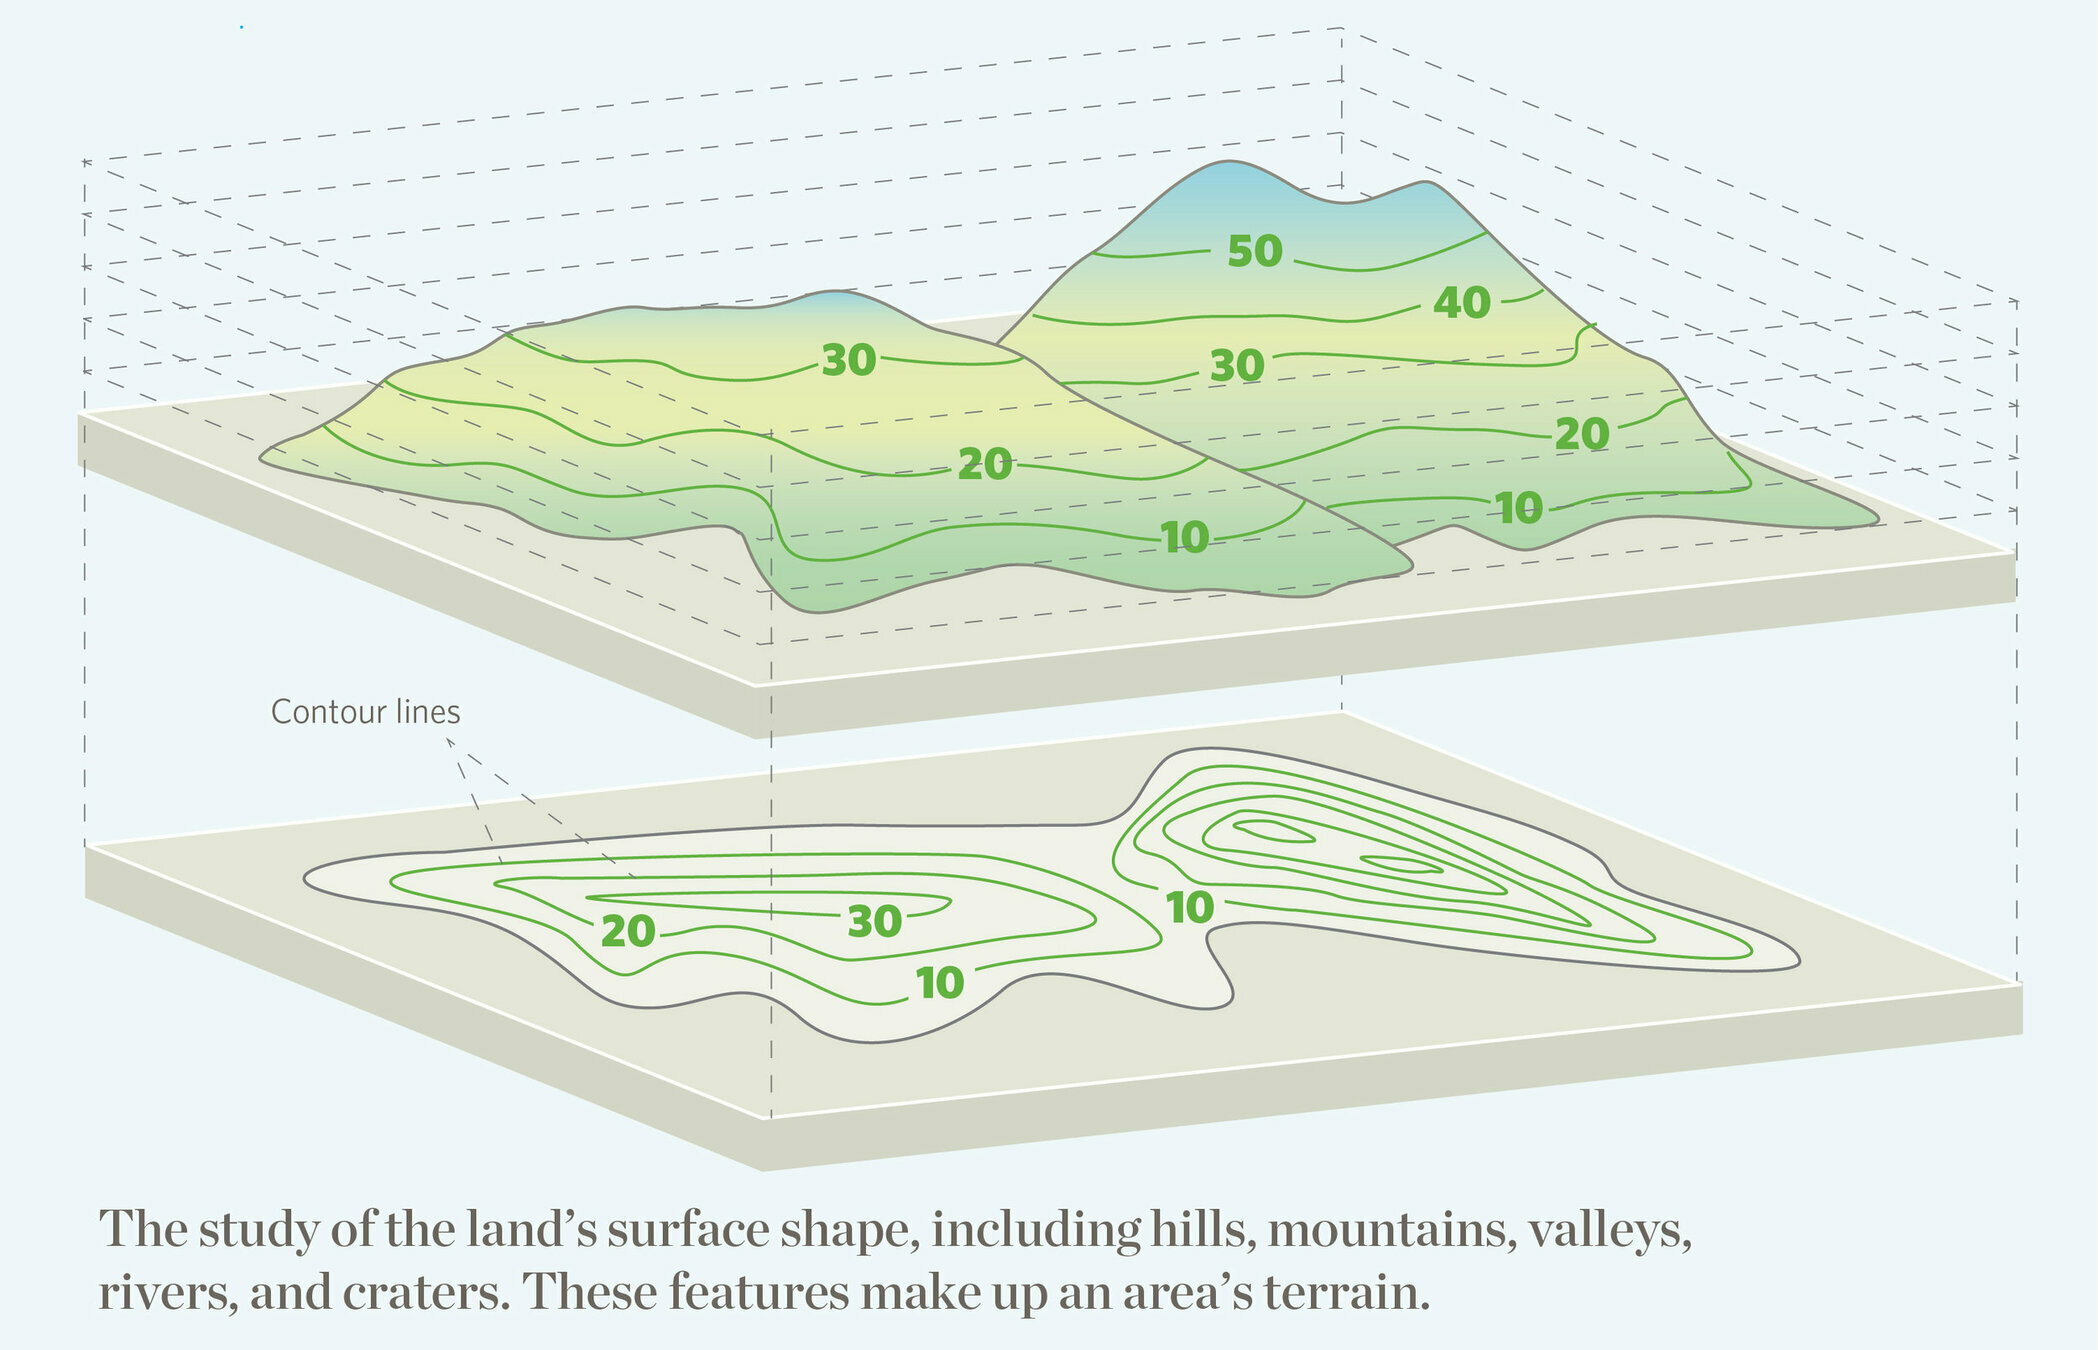
The electric field at any point is the steepest slope of the electric potential -- if the potential is smooth, the steepest slope is a continuous curve.
If you follow that curve, you are traveling on an electric field line.
Electric Field lines are perpendicular to the equipotential surfaces.
Electrostatics
The Electric field
Visualizing the Electric Field
In this simulation, you can switch between presenting the electric potential or the EFLs
Notice how these two sets are perpendicular to each other at every point they meet?
Electrostatics
The Electric Field
Electric Field Lines
Draw the EFLs for a dipole; use the equipotential surfaces as a guide
Electrostatics
The Electric Field
Electric Field Lines
Read more about electric field lines, and the 5 criteria for a correct drawing.
Electrostatics
The Electric Field
Due to charge distributions
Electrostatics
The Electric Field
Due to a straight-line-segment of length L
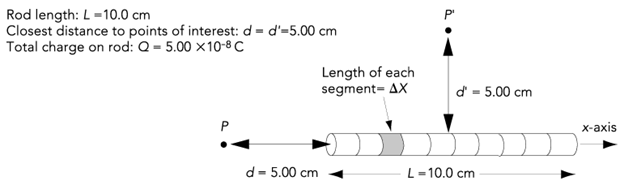
| Segment | x | z | Ex | Ez |
|---|---|---|---|---|
| 1 | ||||
| 2 | ||||
| ... |
Electrostatics
The Electric Field
Due to a straight-line-segment of length L
Electrostatics
The Electric Field
Due to a straight-line-segment of length L
Electrostatics
The Electric Field
Due to a straight-line-segment of length L
Electrostatics
The Electric Field
Due to an infinite straight-line-segment
"Infinite" line-segment
Electrostatics
The Electric Field
Due to a straight-line-segment of length L
"Infinite"ly far from the line-segment
like a point-charge!
Electrostatics
The Electric Field
Due to a line-segment in the shape of a ring
Electrostatics
The Electric Field
Due to a ring of charge -- key points
Symmetry leads to Field only in z direction
What is the Electric Field at the center of the ring?
"Infinite"ly far from the ring?
Electrostatics
The Electric Field
Due to a disk of charge -- key points
Symmetry leads to Field only in z direction
Electrostatics
The Electric Field
& The Electric Flux
Electrostatics
The Electric Field
Definition of the Electric Flux
The Electric Flux through a given surface, s, is a measure of how much electric field passes through the surface.
Electrostatics
The Electric Field
Definition of the Electric Flux
The Electric Flux through a given surface, s, is a measure of how much electric field passes through the surface.
For a flat surface, and a uniform field
Electrostatics
The Electric Field
Definition of the Electric Flux
The Electric Flux through a given surface, s, is a measure of how much electric field passes through the surface.
In general, the field maybe variable, and the surface maybe curved.
so, surface is divided into patches, and the flux through the patches is added up
Electrostatics
The Electric Field
Definition of the Electric Flux
Find the Electric Flux through the two surfaces shown in the figure due to a uniform field pointing in the +y direction.
Which is larger?
Field is uniform: is constant (magnitude and direction.)
Surface is flat: is constant (direction.)
Electrostatics
The Electric Field
Definition of the Electric Flux
Field is radial w/ constant magnitude on the spherical surface.
Surface is spherical, so the normal to the surface is radial.
Find the electric flux through a spherical surface of radius R, centered around a charge +q.
The Flux is independent of the size of the sphere!
Electrostatics
The Electric Field
Gauss' Law
Electrostatics
The Electric Field
Gauss' Law -- example: uniformly charged sphere
Electrostatics
The Electric Field
Gauss' Law -- example: conducting sphere
Electrostatics
The Electric Field
Wait, wait ... what is a field?
Electrostatics
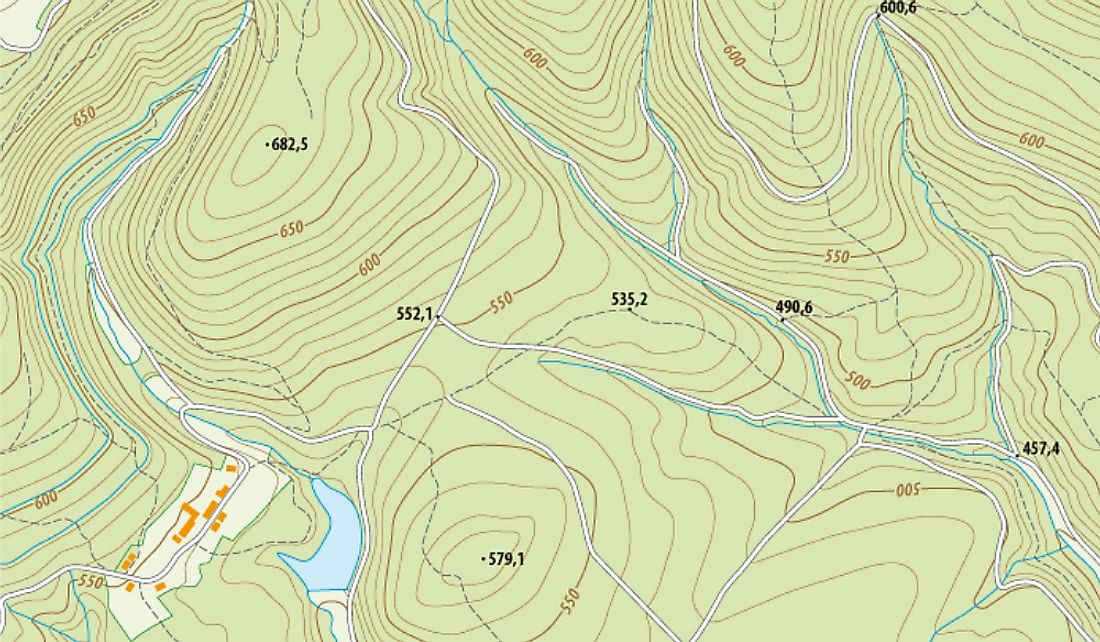
The topology of some geographical area can be represented by a field. In this case, the elevation above sea level is a scalar field. That is to say, for every point on this map, the physical quantity called the elevation above sea level has a known magnitude (represented by the contour lines.)
The Electric Field
What is a field?
Electrostatics
The temperature distribution inside a coffee pot is a scalar field. i.e. at every point in the space within the pot, the physical quantity known as temperature has a given magnitude. (represented by the colormap)
The Electric Field
What is a field?

Electrostatics
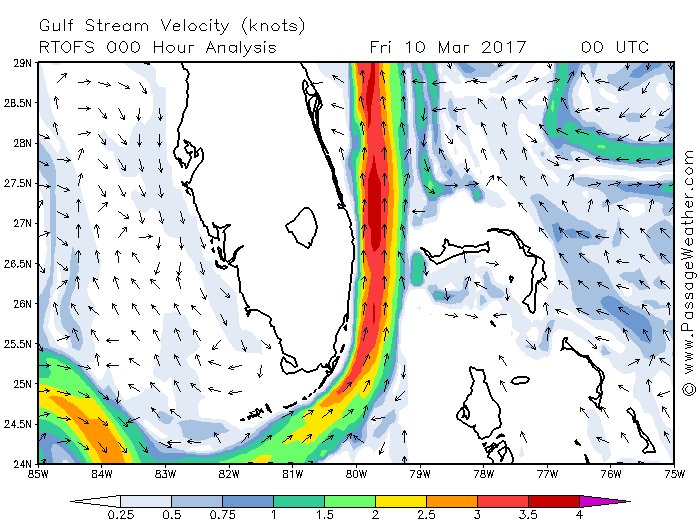
The gulf stream can be represented by a vector field. At every point on the ocean surface, the velocity of the water has some magnitude (represented by the color scale) and a direction (represented by the direction of the little arrows.
The Electric Field
What is a field?
Electrostatics
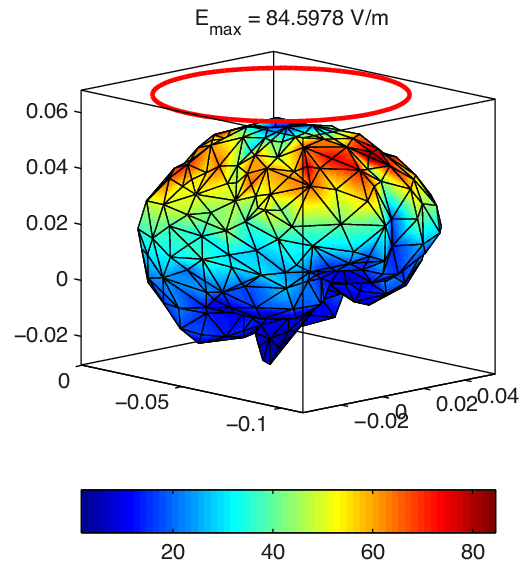
A simulation of the electric field strength induced in a model of a human brain via external electrodes. The magnitude of the electric field at each location within the brain is represented by the color map. The direction of the electric field is not represented in this figure.
The Electric Field
What is a field?